. 2023 Feb 1;133(3):e161759.
doi: 10.1172/JCI161759.

Long noncoding RNA LEENE promotes angiogenesis and ischemic recovery in diabetes models

Affiliations

Long noncoding RNA LEENE promotes angiogenesis and ischemic recovery in diabetes models

Xiaofang Tang et al. J Clin Invest. .

Abstract

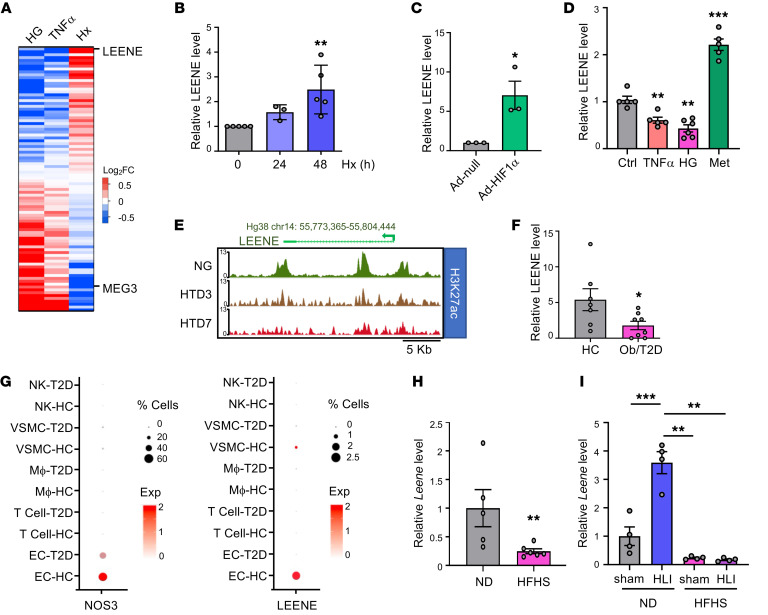
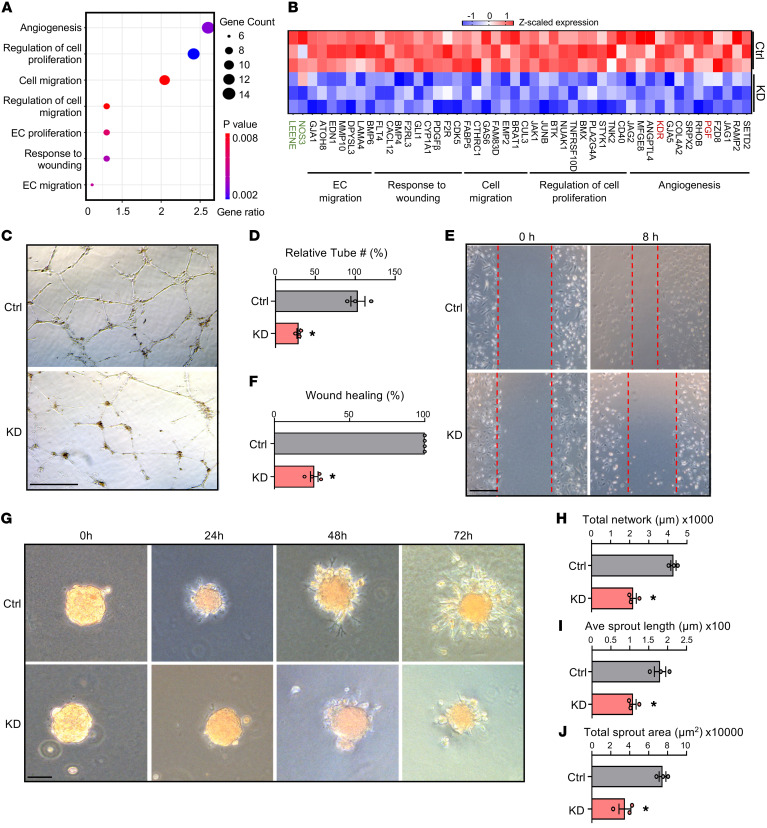
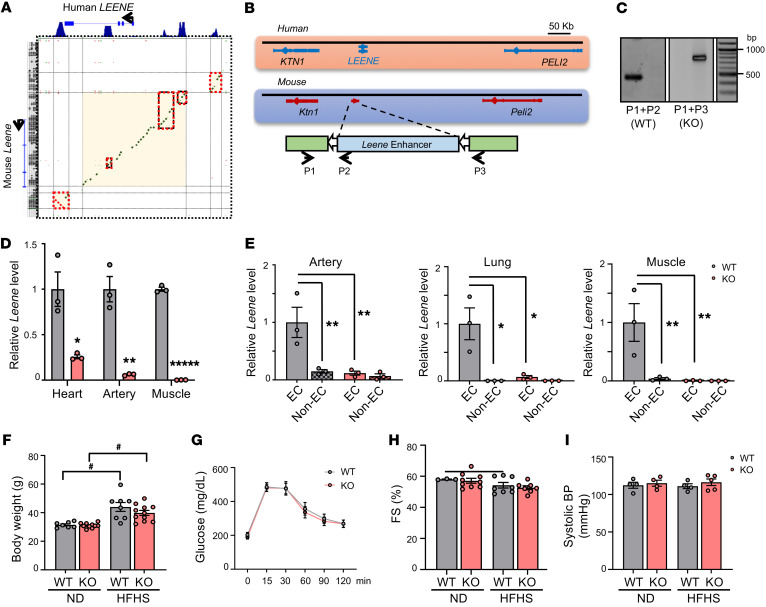
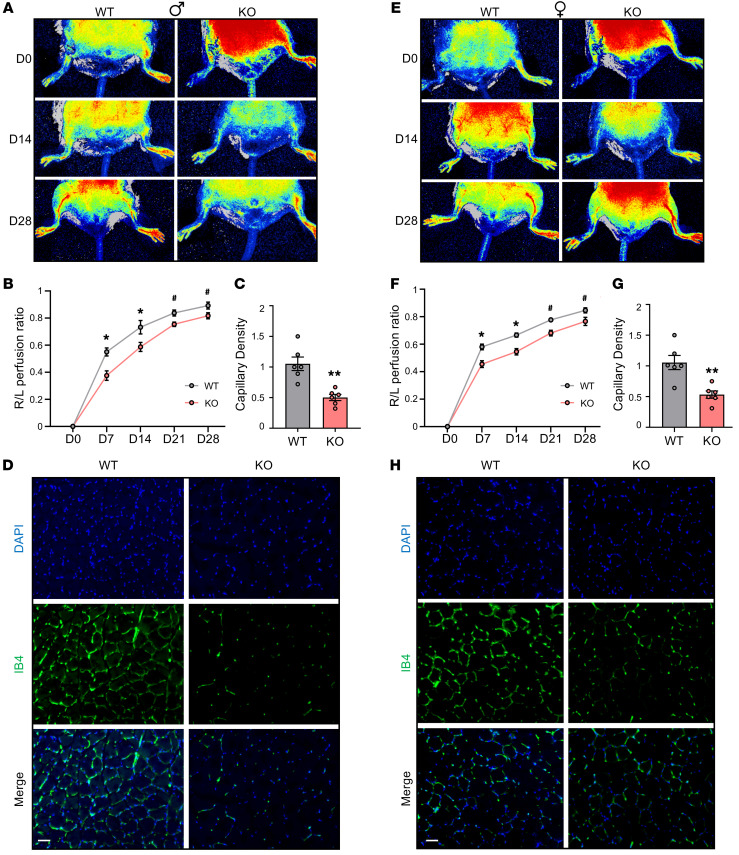
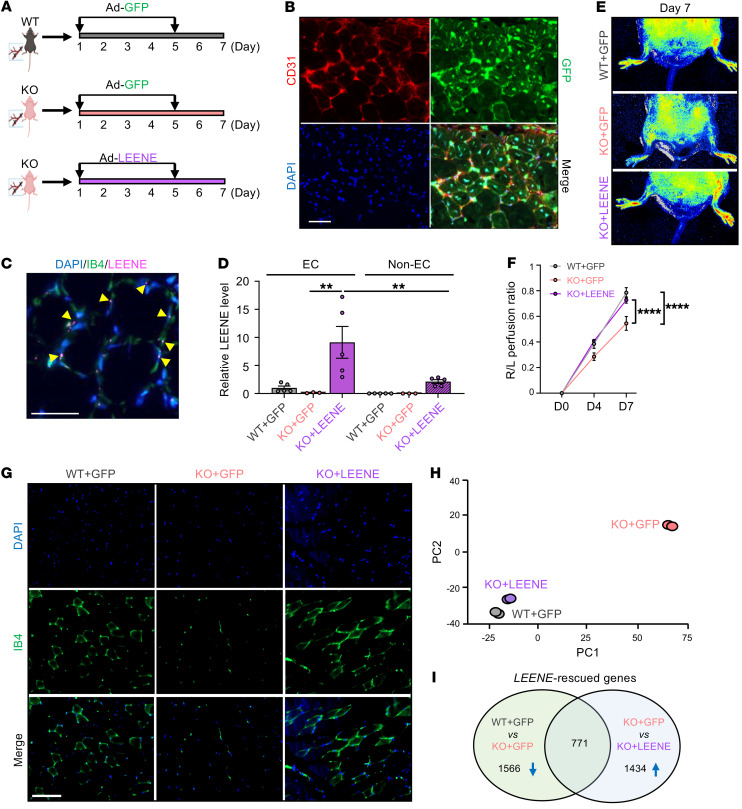
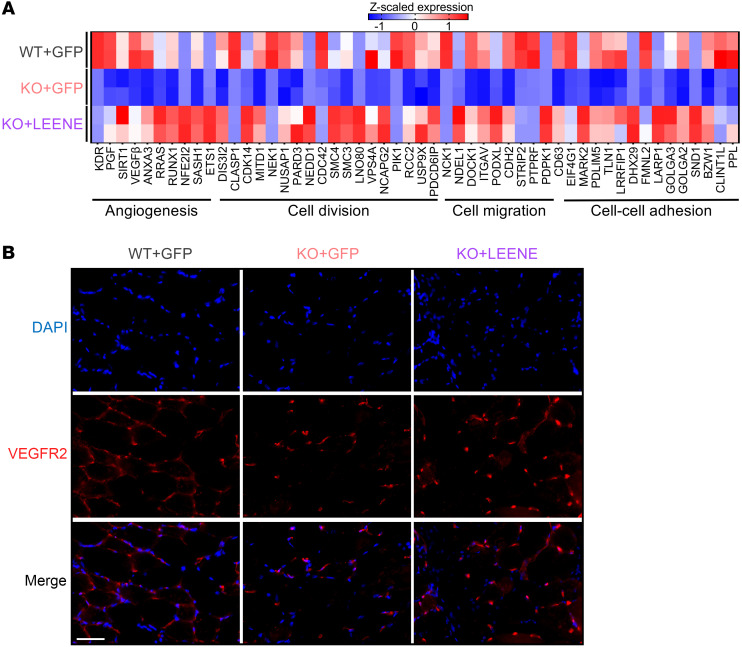
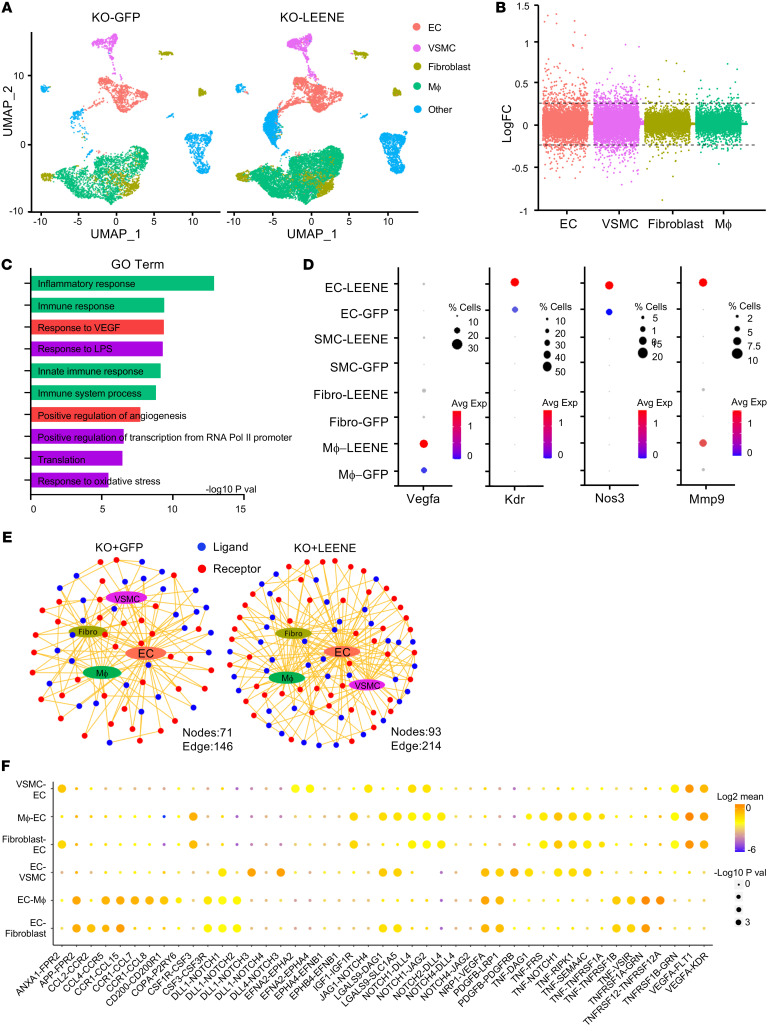
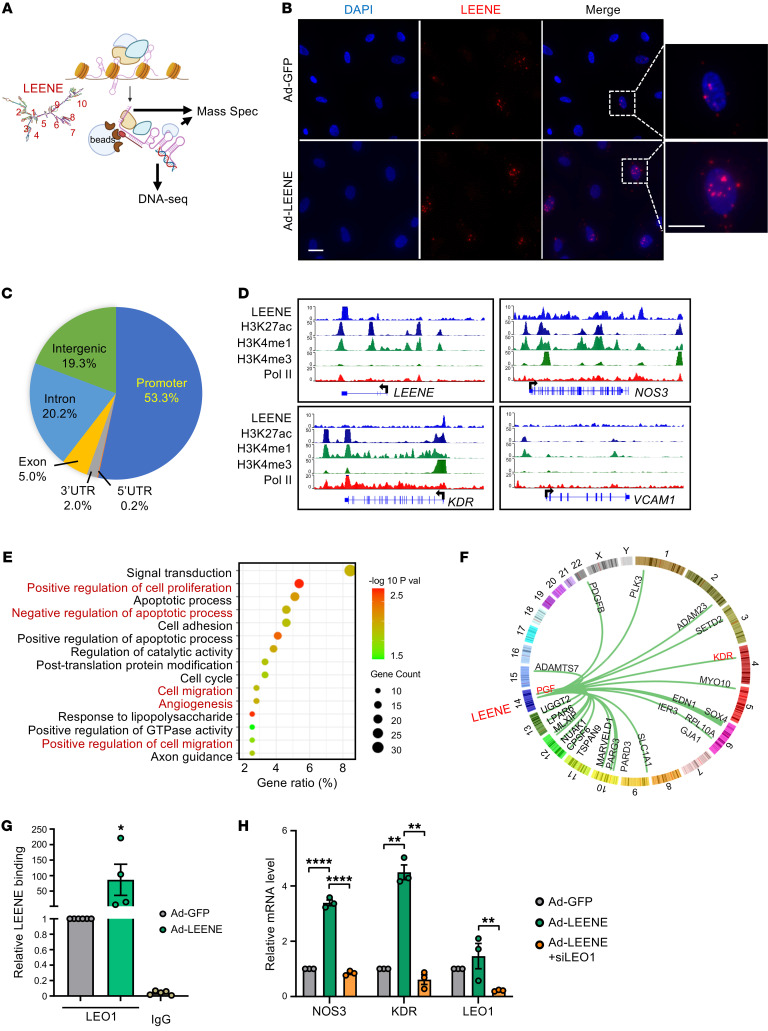
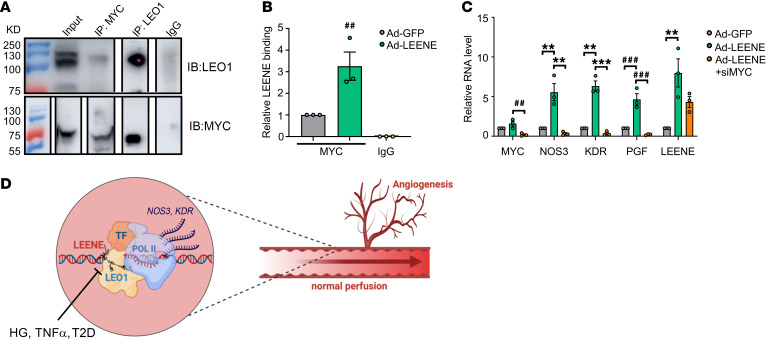
Impaired angiogenesis in diabetes is a key process contributing to ischemic diseases such as peripheral arterial disease. Epigenetic mechanisms, including those mediated by long noncoding RNAs (lncRNAs), are crucial links connecting diabetes and the related chronic tissue ischemia. Here we identify the lncRNA that enhances endothelial nitric oxide synthase (eNOS) expression (LEENE) as a regulator of angiogenesis and ischemic response. LEENE expression was decreased in diabetic conditions in cultured endothelial cells (ECs), mouse hind limb muscles, and human arteries. Inhibition of LEENE in human microvascular ECs reduced their angiogenic capacity with a dysregulated angiogenic gene program. Diabetic mice deficient in Leene demonstrated impaired angiogenesis and perfusion following hind limb ischemia. Importantly, overexpression of human LEENE rescued the impaired ischemic response in Leene-knockout mice at tissue functional and single-cell transcriptomic levels. Mechanistically, LEENE RNA promoted transcription of proangiogenic genes in ECs, such as KDR (encoding VEGFR2) and NOS3 (encoding eNOS), potentially by interacting with LEO1, a key component of the RNA polymerase II-associated factor complex and MYC, a crucial transcription factor for angiogenesis. Taken together, our findings demonstrate an essential role for LEENE in the regulation of angiogenesis and tissue perfusion. Functional enhancement of LEENE to restore angiogenesis for tissue repair and regeneration may represent a potential strategy to tackle ischemic vascular diseases.

Keywords: Angiogenesis; Diabetes; Endothelial cells; Noncoding RNAs; Vascular Biology.


Figures

Figure 1
Figure 1. Differential regulation of LEENE by conditions that affect angiogenesis.
(A) Heatmap of lncRNA expression in ECs, ranked by fold-change (FC) determined by RNA-seq in HUVECs treated with 25 mM glucose (high glucose [HG] vs. normal glucose [NG]/osmolarity control [ctrl]) (2 replicates), HUVECs and HAECs treated with 100 ng/mL TNF-α (vs. untreated ctrl) (1 replicate of each), and HMVECs subjected to hypoxia (Hx [2% O2], vs. normoxia) (2 replicates). (BD) qPCR of LEENE in HMVECs subjected to normoxia (0 h) or Hx for the indicated times (B), infected with Ad-null or Ad-HIF1α (C), and treated with 100 ng/mL TNF-α, HG, or 10 mM metformin (Met) for 24 hours (D), with respective controls set to 1 (n = 3–6 biological replicates/group). (E) H3K27ac ChIP-seq signals in the LEENE locus from ECs subjected to NG or HG and 5 ng/mL TNF-α for 3 (HTD3) and 7 days (HTD7). (F) qPCR of LEENE in intima isolated from human mesenteric arteries of age-matched healthy control (HC) or donors with severe obesity (ob) and/or (pre)T2D. (G) Dot plot showing expression of NOS3 and LEENE in HC and T2D human mesenteric arteries detected by scRNA-seq. Dot size denotes the percentage of cells expressing the corresponding gene and dot color represents the average expression. (H and I) qPCR of Leene in aortas from male C57BL/6J mice fed a normal chow diet (ND) or an HFHS diet starting from 8 weeks old for 16 weeks (n = 5–6/group) in (H) and in ischemic (HLI) and sham-operated control limbs (sham) of normal chow– or HFHS diet–fed male C57BL/6J mice (n = 7 mice/group) (I). Data are represented as mean ± SEM. *P < 0.05; **P < 0.01; ***P < 0.001 by 1-way ANOVA with Tukey’s post hoc test (B and D), 2-tailed Student’s t test (C, F, and H), or 2-way ANOVA with Tukey’s post hoc test (I).
Figure 2
Figure 2. LEENE knockdown inhibits angiogenesis in vitro.
(A and B) HUVECs were transfected with scramble or LEENE LNA gapmers and then subjected to pulsatile flow (12 ± 1 dyne/cm2) for 24 hours. Total RNA from 3 biological replicates was subjected to RNA-seq. Significantly enriched pathways related to angiogenesis in the DEGs (scramble vs. LEENE LNA) were plotted with P values and numbers (gene counts) and percentage of genes involved (gene ratio). (B) Heatmap showing expression of select DEGs involved in pathways shown in A. LEENE, NOS3, KDR, and PGF are colored in green and red for distinction. (CJ) HMVECs were transfected with respective LNAs for 48 hours and then used for tube formation (C and D), scratch wound (E and F), and 3D spheroid-sprouting assays (G–J). Scale bars: 0.5 mm (C), 1 mm (E), and 100 μm (G). Data are represented as mean ± SEM from 3 independent experiments. *P = 0.02 based on 2-tailed Student’s t test.
Figure 3
Figure 3. Generation of a Leene-KO mouse model.
(A) DNA sequence alignment between the human LEENE and the syntenic region in mouse. Green indicates conservation on the sense strand and red indicates conservation on the antisense strand. Red boxes mark the sequence alignment in the H3K27ac-enriched peak regions shown on the top. (B) Human LEENE and mouse Leene loci; CRISPR/Cas9 targeting strategy in mouse genome and genotyping primers to identify WT (P1 + P2) and KO (P1 + P3). (C) Genotyping by PCR with P1–P3 primers as depicted in B. (D) qPCR of Leene in different organs/tissue of WT and KO littermates (n = 3/group). (E) qPCR of Leene in EC and non–EC-enriched fractions isolated from different tissues of WT and KO littermates (n = 3 mice/group). (FI) Male Leene-KO and WT littermates were fed chow or HFHS diet for 16 weeks starting at 8 weeks old. (F) Body weight, (G) glucose tolerance, (H) fractional shortening (FS), and (I) systolic BP were measured (n = 3–11/group). Data are represented as mean ± SEM. #P = 0.05; *P < 0.05; **P < 0.01; *****P < 0.00001 between indicated groups by 2-tailed Student’s t test (D) or 2-way ANOVA followed by Tukey’s test (E and F).
Figure 4
Figure 4. Leene-KO mice have impaired hind limb blood flow recovery after arterial ligation.
Male (AD) and female (EH) mice were fed an HFHS diet for 16 weeks, followed by femoral artery ligation on the right hind limb and sham operation on the left on day 0 (D0). Perfusion recovery rate was measured at various time points (D0, D7, D14, D21, and D28) after femoral artery ligation by laser speckle flowgraphy. Data show blood perfusion ratio of the right to left (R/L) hind limb. Representative images (A and E) and quantitative analysis (B and F) (n = 8–10/group). (C and G) Quantification of capillary density based on IB4 staining (n = 6/group) and (D and H) representative images of IB4 (green) and DAPI (blue) staining in the gastrocnemius muscle collected 7 days after HLI. Scale bars: 50 μm. Data are represented as mean ± SEM. #P = 0.05, *P < 0.05; **P < 0.01 based on 2-tailed Student’s t test.
Figure 5
Figure 5. LEENE RNA promotes ischemic recovery in vivo.
(A) Design of the rescue experiment: Adenovirus driving GFP (Ad-GFP) or LEENE (tagged by GFP) (Ad-LEENE) was injected intramuscularly on days 1 and 5 after HLI into WT or KO mice fed an HFHS diet. (B and C) Staining of CD31 and GFP (B) and smRNA FISH of LEENE and IB4 staining with DAPI counterstain (C) in the hind limb muscle of KO mice receiving Ad-LEENE. Arrows indicate colocalization of LEENE and IB4 signals. Scale bars: 50 μm. (D) qPCR of LEENE in EC-enriched and non–EC-enriched fractions isolated from the gastrocnemius muscle (n = 3–5/group). **P = 0.006 based on 1-way ANOVA followed by Tukey’s test. (E and F) Representative flowgraphy images (E) and quantitative analysis of perfusion recovery rate in the hind limbs (n = 4/group) (F). ****P < 0.0001 based on 2-way ANOVA followed by Tukey’s test. (G) IB4 staining in the hind limb muscle (n = 3–5/group). Scale bar: 100 μm. (H) PCA plot showing the gene expression of 3 groups profiled by RNA-seq with 2 replicates per group. (I) Venn diagram showing the LEENE-rescued genes, namely the overlap between downregulated by Leene KO (WT + GFP vs. KO + GFP) and upregulated by LEENE overexpression in KO (KO + GFP vs. KO + LEENE).
Figure 6
Figure 6. Human LEENE OE restores angiogenesis marker gene expression, including KDR.
(A) Heatmap showing expression of select LEENE-rescued genes in EC-enriched fractions isolated from the gastrocnemius muscle, as described in Figure 5. (B) Immunofluorescent staining of VEGFR2 (encoded by KDR) with DAPI counterstain in the ischemic muscles. Scale bar: 50 μm. Data are represented as mean ± SEM.
Figure 7
Figure 7. LEENE promotes angiogenic function in ECs and EC interactions with other vascular cells that promote ischemic recovery.
Leene-KO mice were subjected to HLI and Ad-GFP/LEENE injection as illustrated in Figure 5A. Gastrocnemius muscles on the ischemic side were collected 7 days after HLI and the CD144-enriched fraction underwent scRNA-seq. Cells from 4 mice were pooled into 1 sample and 8 mice in total were used per group. Cells (5,573) from KO-GFP and 13,465 cells from KO-LEENE groups were profiled. (A) UMAP showing cell clusters identified from scRNA-seq split by condition (KO-GFP and KO-LEENE). (B) Manhattan plot showing logFC of all genes detected by scRNA-seq in different cell types. The cutoff for DEGs (log|FC| > 0.25) is indicated by the 2 horizontal dashed lines. (C) Top 10 enriched biological pathways of DEGs in ECs plotted with –log10(P value). (D) Dot plots showing representative gene expression in different cell types. (E) Network visualization of ligand (blue) and receptor (red) connectivity between ECs and VSMCs, macrophages (Mϕ), or fibroblasts (Fibro). Note the increase in the number of nodes and edges in the KO + LEENE group. (F) The increased, i.e., higher expression in KO + LEENE vs. KO + GFP or only detected in KO + LEENE but not in KO + GFP ligand-receptor interactions between ECs and other cell types in the hind limb by LEENE OE. The size of spheres indicates –log10(P value) between the 2 groups and color indicates expression of the ligand-receptor pair in the corresponding cell types.
Figure 8
Figure 8. LEENE interacts with promoters and LEO1 to increase proangiogenic gene expression.
(A) Schematic diagram showing ChIRP performed with 10 biotinylated probes, the locations of which are shown based on the predicted secondary structure of LEENE. The ChIRP precipitates were subjected to DNA-seq and mass spectrometry. (B) smRNA FISH of LEENE in ECs infected with Ad-GFP or Ad-LEENE. Scale bar: 50 μm. (C and D) ChIRP-seq was performed with Ad-LEENE–infected HUVECs in biological triplicates. (C) Pie chart showing the proportion of reads aligned to different genomic regions. (D) LEENE binding signals in representative genes (top blue tracks) in parallel to HUVEC ChIP-seq data from ENCODE. (E) GO analysis of top 15 enriched pathways in LEENE interactome and regulome, i.e., 395 genes downregulated by LEENE KD in vitro and showing genomic interaction with LEENE. (F) Circle plot showing LEENE interaction with 23 LEENE-regulated (in vitro and in vivo) and -interacting genes. (G) RIP performed with HMVECs and anti-LEO1 antibody with IgG as an isotype control. LEENE RNA in the immunoprecipitates was quantified by qPCR and the relative enrichment in the Ad-GFP sample was set to 1. *P = 0.04 based on 1-way ANOVA followed by Dunnett’s test. (H) qPCR analysis of NOS3, KDR, and LEO1 in HMVECs transfected by scramble or LEO1 siRNA (siLEO1) and infected by Ad-GFP or Ad-LEENE. Bar graphs represent mean ± SEM. **P < 0.01; ****P < 0.0001 compared with Ad-GFP or between indicated groups based on 1-way ANOVA followed by Dunnett’s test.
Figure 9
Figure 9. Involvement of MYC in the LEENE-LEO1 mechanism.
(A) Co-IP of LEO1 and MYC in ECs. (B) RIP with ECs infected with Ad-GFP or Ad-LEENE using anti-MYC antibody or IgG control. LEENE RNA in the immunoprecipitates was quantified by qPCR and the relative enrichment in the Ad-GFP sample was set to 1. (C) qPCR analysis of ECs transfected with scramble or MYC siRNA (siMYC) and infected with Ad-GFP or Ad-LEENE. Bar graphs represent mean ± SEM. ##P = 0.01; **P < 0.01; ###P = 0.001; ***P < 0.001 based on 1-way ANOVA followed by Dunnett’s test. (D) Schematic illustration of LEENE-regulated angiogenic and ischemic responses. LEENE, potentially by binding LEO1 and MYC, promotes the transcription of proangiogenic genes, e.g., those encoding eNOS (NOS3) and VEGFR2 (KDR), to enhance angiogenesis and flow perfusion. Such mechanism is suppressed in diabetic conditions, which contributes to the reduced tissue perfusion in PAD.

Comment in

References

    1. Potente M, et al. Basic and therapeutic aspects of angiogenesis. Cell. 2011;146(6):873–887. doi: 10.1016/j.cell.2011.08.039. - DOI - PubMed
    1. Eelen G, et al. Basic and therapeutic aspects of angiogenesis updated. Circ Res. 2020;127(2):310–329. doi: 10.1161/CIRCRESAHA.120.316851. - DOI - PubMed
    1. Kolluru GK, et al. Endothelial dysfunction and diabetes: effects on angiogenesis, vascular remodeling, and wound healing. Int J Vasc Med. 2012;2012:918267. - PMC - PubMed
    1. American Diabetes Association. Peripheral arterial disease in people with diabetes. Diabetes Care. 2003;26(12):3333–3341. doi: 10.2337/diacare.26.12.3333. - DOI - PubMed
    1. Cooke JP, Meng S. Vascular regeneration in peripheral artery disease. Arterioscler Thromb Vasc Biol. 2020;40(7):1627–1634. doi: 10.1161/ATVBAHA.120.312862. - DOI - PMC - PubMed

Publication types

Substances