. 2022 Dec 9;46(1 Suppl 1):e20220153.
doi: 10.1590/1678-4685-GMB-2022-0153. eCollection 2022.

Genome-wide, evolutionary, and functional analyses of ascorbate peroxidase (APX) family in Poaceae species

Affiliations

Genome-wide, evolutionary, and functional analyses of ascorbate peroxidase (APX) family in Poaceae species

Douglas Jardim-Messeder et al. Genet Mol Biol. .

Abstract

Ascorbate peroxidases (APXs) are heme peroxidases involved in the control of hydrogen peroxide levels and signal transduction pathways related to development and stress responses. Here, a total of 238 APX, 30 APX-related (APX-R), and 34 APX-like (APX-L) genes were identified from 24 species from the Poaceae family. Phylogenetic analysis of APX indicated five distinct clades, equivalent to cytosolic (cAPX), peroxisomal (pAPX), mitochondrial (mitAPX), stromal (sAPX), and thylakoidal (tAPX) isoforms. Duplication events contributed to the expansion of this family and the divergence times. Different from other APX isoforms, the emergence of Poaceae mitAPXs occurred independently after eudicot and monocot divergence. Our results showed that the constitutive silencing of mitAPX genes is not viable in rice plants, suggesting that these isoforms are essential for rice regeneration or development. We also obtained rice plants silenced individually to sAPX isoforms, demonstrating that, different to plants double silenced to both sAPX and tAPX or single silenced to tAPX previously obtained, these plants do not show changes in the total APX activity and hydrogen peroxide content in the shoot. Among rice plants silenced to different isoforms, plants silenced to cAPX showed a higher decrease in total APX activity and an increase in hydrogen peroxide levels. These results suggest that the cAPXs are the main isoforms responsible for regulating hydrogen peroxide levels in the cell, whereas in the chloroplast, this role is provided mainly by the tAPX isoform. In addition to broadening our understanding of the core components of the antioxidant defense in Poaceae species, the present study also provides a platform for their functional characterization.


Conflict of interest statement

Conflict of Interest: The authors declare that there is no conflict of interest that could be perceived as prejudicial to the impartiality of the reported research.

Figures

Figure 1 -
Figure 1 -. Phylogenetic analysis of APX, APX-R and APX-L proteins. The phylogenetic relationship between APX, APX-R, APX-L was reconstructed using the maximal-likelihood method under the best model selection in IQ-TREE software with 1000 replicates of rapid bootstrap and aLRT statistics. A total of 334 protein sequences were included in the analysis, and ambiguous positions were removed from the alignment. The protein sequences separated in five well-supported clusters: Group I - cytosolic APX (cAPX); Group II - peroxisomal APX (pAPX); Group IIII - mitochondrial/chlroplastic APX (mit/chlAPX); Group IV - APX-related (APX-R); Group V - APX-Like (APX-L). The posterior probabilities are discriminated above each branch.
Figure 2-
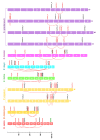
Figure 2-. Chromosomal distribution of APX, APX-R and APX-L genes in Oryza sativa, Brachypodium distachyion, Panicum virgatum (subgenomes K and N), Setaria italica, Zea mays, Sorghum bicolor and Saccharum spontaneum (subgenomes A, B, C and D). Chromosome numbers are displayed next to each bar. Red lines indicate segmental duplications and gene duplicated in tandem are indicated in green.
Figure 3-
Figure 3-. Ratios of non-synonymous to synonymous substitutions (Ka/Ks) and estimated divergence time in APX genes from Poaceae species. (A) Ka/Ks ratios of intraspecific duplicated gene pairs from group I (group Ia x group Ib), group II (group IIa x group IIb) and group III (group IIIa and IIIc; group IIIb and IIIc); (B) estimated divergence time of duplicated gene pairs from group I, group II and group III. These parameters are determined for 24 Poaceae species and the values for Oryza sativa, Brachypodium distachyon, Panicum virgatum, Setaria italica, Zea mays, Sorghum bicolor and Saccharum spontaneum are indicated in colored symbols.
Figure 4-
Figure 4-. Exon-intron structure APX genes from Oryza sativa, Brachypodium distachyion, Panicum virgatum, Setaria italica, Zea mays, Sorghum bicolor and Saccharum spontaneum (A) cAPX and pAPX, and (B) tAPX, sAPX and mitAPX. For all genes, grey lines represent introns and the lengths of exons are exhibited proportionally.
Figure 5-
Figure 5-. Conserved motifs of APX, APX-R and APX-L proteins from Chlamydomonas reinhardtii (Chrei), Physcomitrella patens (Phpat), Amborella trichopoda (Amtri), Arabidopsis thaliana (At), Oryza sativa (Os), Brachypodium distachyion (Bd), Panicum virgatum (Pv), Setaria italica (Si), Zea mays (Zm), Sorghum bicolor (Sb) and Saccharum spontaneum (Ss). The phylogenetic relationship between APX, APX-R, APX-L was reconstructed using the maximal-likelihood method under the best model selection in IQ-TREE software with 1000 replicates of rapid bootstrap and aLRT statistics. A total of 111 protein sequences were included in the analysis, and ambiguous positions were removed from the alignment. All 15 conserved motifs in APX, APX-R and APX-L proteins were identified by MEME software and indicated by a colored box. The lines represent the non-conserved sequences, and the length of motifs in each protein is presented proportionally.
Figure 6-
Figure 6-. Structure and protein sequence analysis of APX, APX-R and APX-L in Poaceae species. The tertiary structure of OsAPX1 and OsAPX2 (cAPX) (A), OsAPX3 and OsAPX4 (pAPX) (B), OsAPX5 and OsAPX6 (mitAPX) (C), OsAPX7 and OsAPX8 (chlAPX) (D), OsAPX-R (E) and OsAPX-L (F) was predicted by AlphaFold algorithm. The amino acid residues involved in ascorbate bind and catalytic activity are indicated. (G) Multiple sequence alignments of protein sequences. Green, red, orange, pink and purple bars represent the active site domain (ASD), organellar signature domain 1 (Org-D1), heme-binding domain (HBD), organellar signature domain 2 (Org-D2) and cation binding domain (CBD) present in all phylogenetic groups. Blue triangles represent the amino acid residues involved in ascorbate bind residues (Lys, Cys and Arg) and yellow triangles represent catalytic residues (Arg, Trp, His, His).
Figure 7-
Figure 7-. APX activity and hydrogen peroxide content in shoots from rice plants silenced to cAPX, pAPX and chlAPX isoforms. (A) Quantitative determination of APX expression in shoots from RNAi OsAPX1/2, RNAi OsAPX4, RNAi OsAPX7/8, RNAi OsAPX7 and RNAi OsAPX8 plants. The values are expressed relatively to NT plants. (B) Measurement of APX activity in shoots from NT and silenced plants. (C) Hydrogen peroxide content in shoots from NT and silenced plants. (D) The relationship among the APX activity and hydrogen peroxide content in shoots from all plants analyzed. The values represent the media ± SE of at least three independent experiments.
Figure 8 -
Figure 8 -. Group IIIa APX are specific to Poacea specie and located in mitochondria. (A) Deduced amino acid alignment of predicted mitochondrial transit peptide of group IIIa APX from Poacea species. The sequences were aligned by Clustal Omega and the conserved amino acids are labeled in black. The phylogenetic relationship between APX, APX-R, APX-L was reconstructed using the maximal-likelihood method under the best model selection in IQ-TREE software with 1000 replicates of rapid bootstrap and aLRT statistics. The logos were identified by MEME software. The character and size of each logo represent the proportion of an amino acid at the specific site. (B) Subcellular localization of the OsAPX5 and OsAPX6 protein in rice etiolated protoplasts throught transient expression of the 35S-OsAPX5::YFP and 35S-OsAPX6::YFP. Green signals indicate YFP fluorescence; red signals indicate mitochondria location by MitoTracker fluorescence and yellow signals is the merged image. The negative control of YFP fluorescence is indicated. (C) Quantitative determination of OsAPX5 (orange), OsAPX6 (red), OsAPX7 (light green) and OsAPX8 (dark green) genes by RT-qPCR in shoot during rice development relative to 60 days after germination (D.A.G.) The values were normalized by at least three constitutive genes and represent the media ± SE of at least three independent experiments.

References

    1. Agrawal GK, Jwa NS, Iwahashi H, Rakwal R. Importance of ascorbate peroxidases OsAPX1 and OsAPX2 in the rice pathogen response pathways and growth and reproduction revealed by their transcriptional profiling. Gene. 2003;11:93–103. - PubMed
    1. Akbudak MA, Filiz E, Vatansever R, Kontbay K. Genome-Wide identification and expression profiling of Ascorbate Peroxidase (APX) and Glutathione Peroxidase (GPX) genes under drought stress in Sorghum (Sorghum bicolor L.) J Plant Growth Regul. 2018;37:925–936.
    1. Asada K. The water-water cycle in chloroplasts, scavenging of active oxygen and dissipation of excess photons. Annu Rev Plant Physiol Plant Mol Biol. 1999;50:601–639. - PubMed
    1. Bailey TL, Boden M, Buske FA, Frith M, Grant CE, Clementi L, Ren J, Li WW, Noble WS. MEME SUITE: Tools for motif discovery and searching. Nucleic Acids Res. 2009;37:W202–W208. - PMC - PubMed
    1. Barros J, Escamilla-Trevino L, Song L, Rao X, Serrani-Yarce JC, Palacios MD, Engle N, Choudhury FK, Tschaplinski TJ, Venables BJ, et al. 4-Coumarate 3-hydroxylase in the lignin biosynthesis pathway is a cytosolic ascorbate peroxidase. Nat Commun. 2019;10:1994. - PMC - PubMed