. 2023 Feb:59:102569.
doi: 10.1016/j.redox.2022.102569. Epub 2022 Dec 5.

Silica nanoparticles aggravated the metabolic associated fatty liver disease through disturbed amino acid and lipid metabolisms-mediated oxidative stress

Affiliations

Silica nanoparticles aggravated the metabolic associated fatty liver disease through disturbed amino acid and lipid metabolisms-mediated oxidative stress

Alimire Abulikemu et al. Redox Biol. 2023 Feb.

Abstract

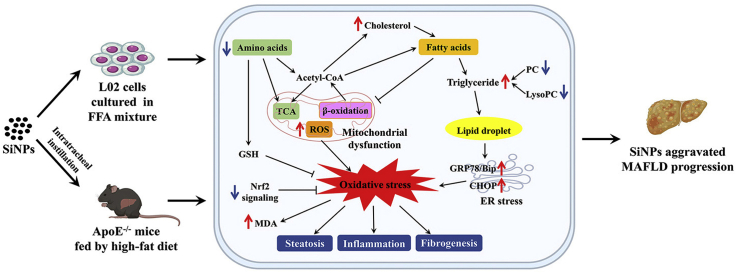
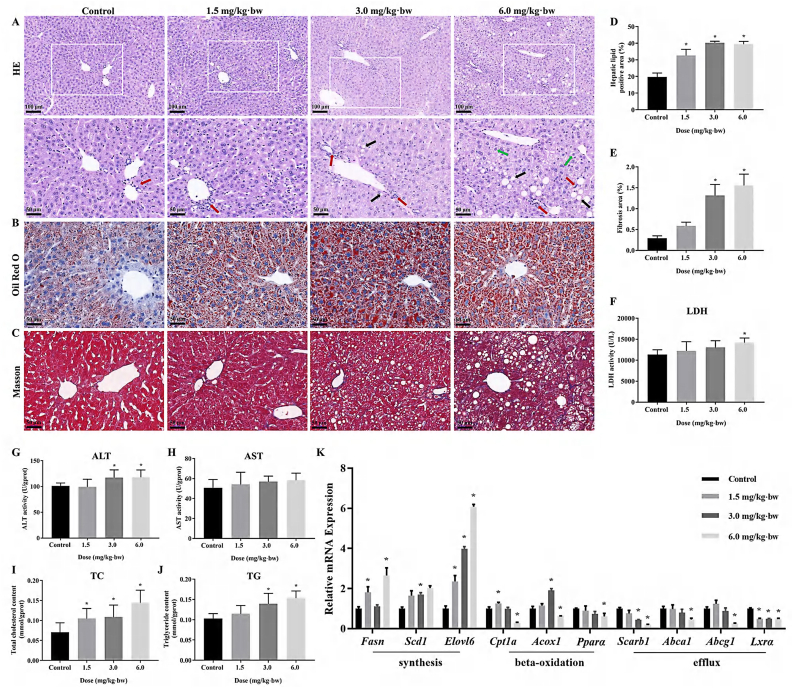
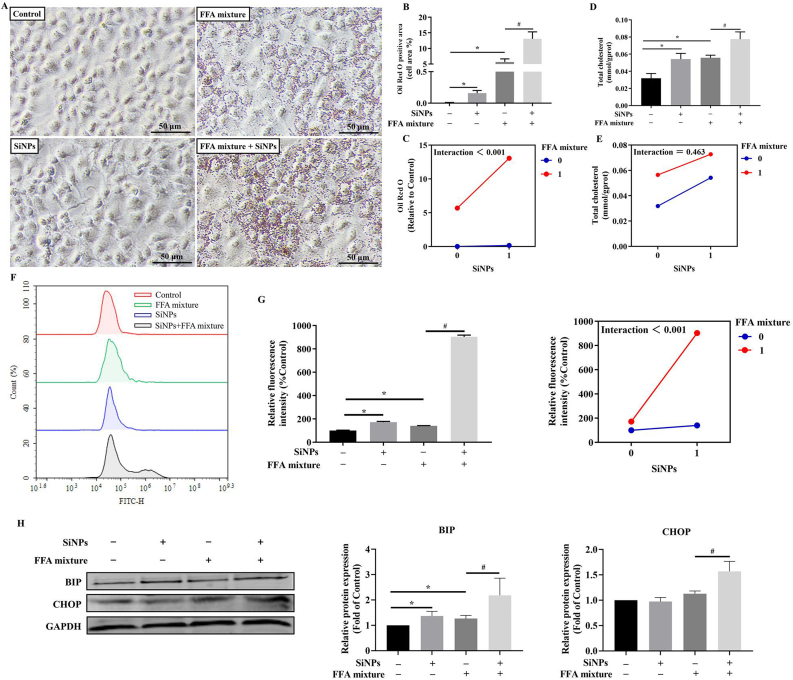
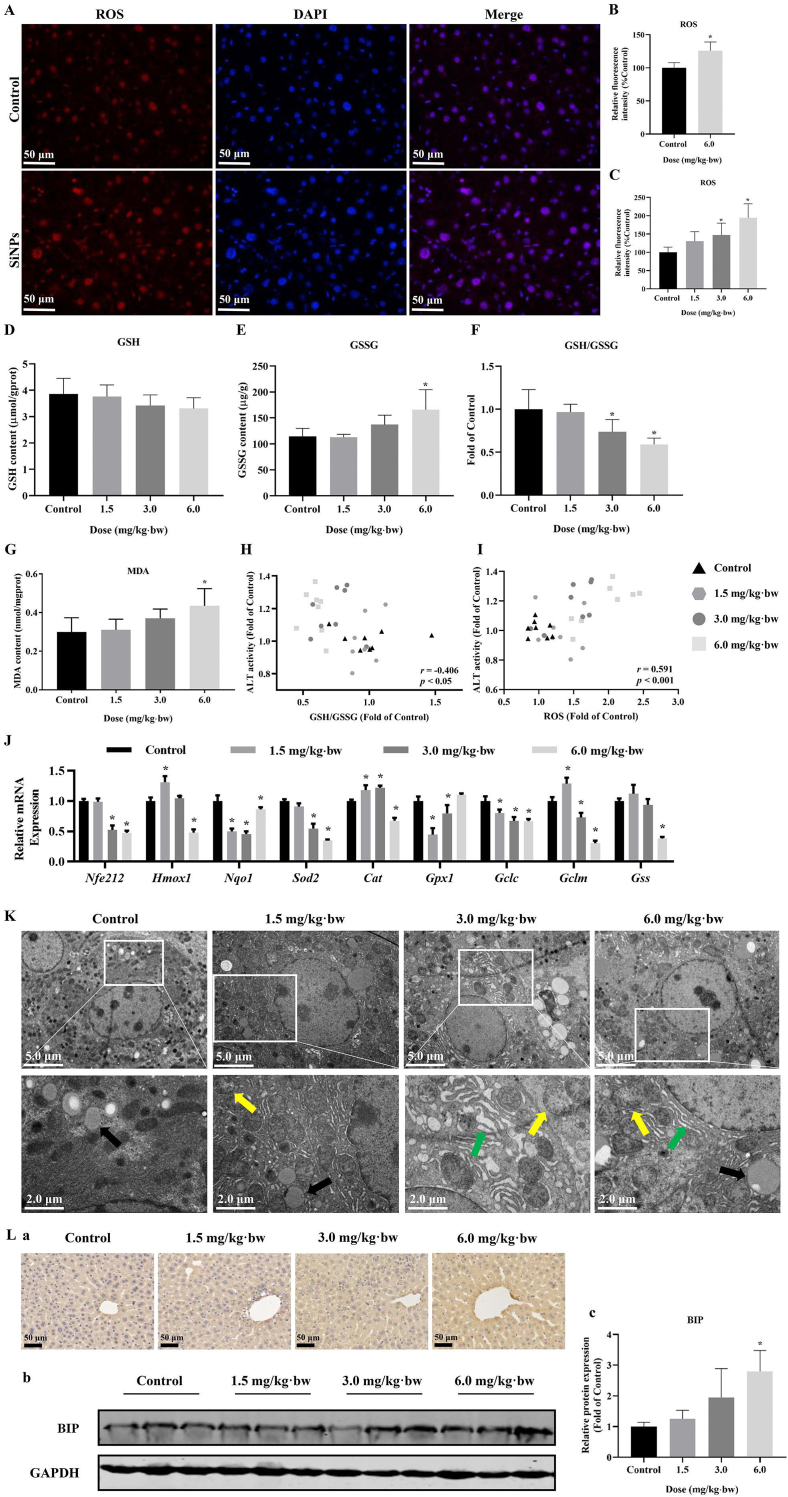
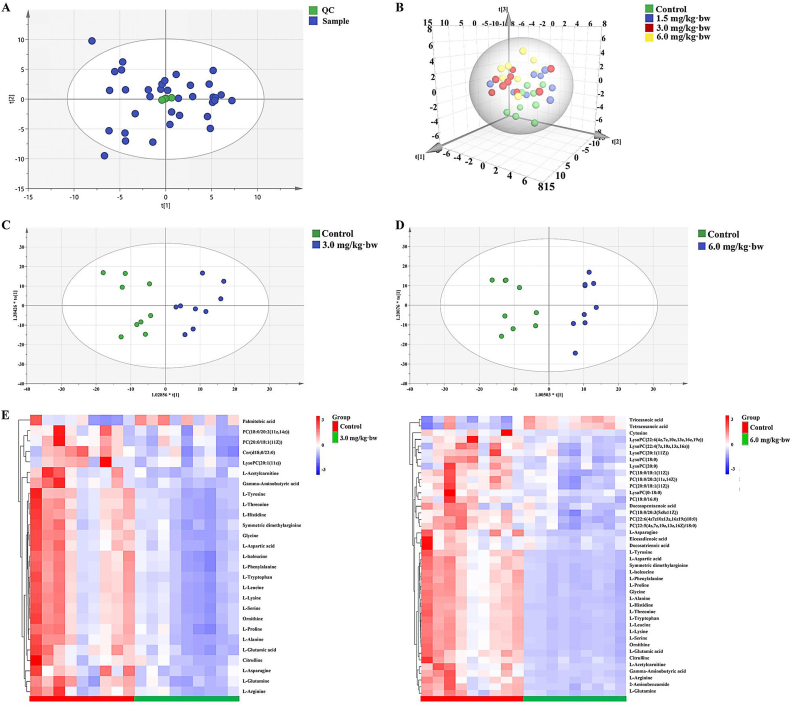
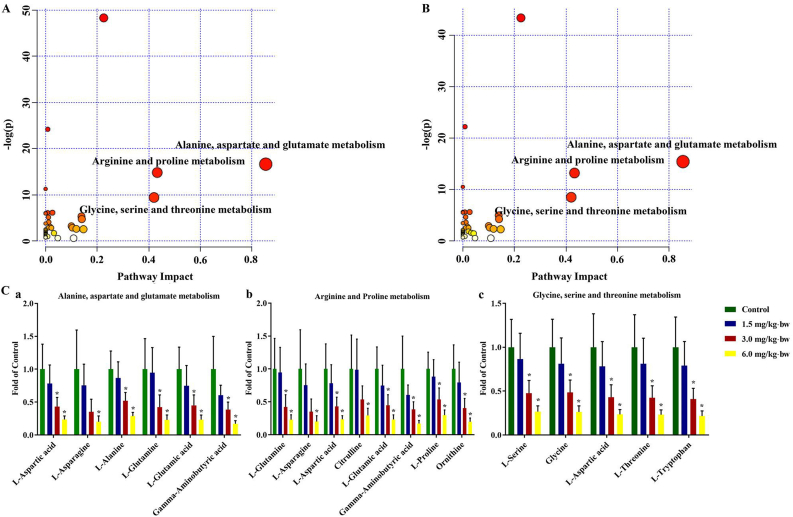
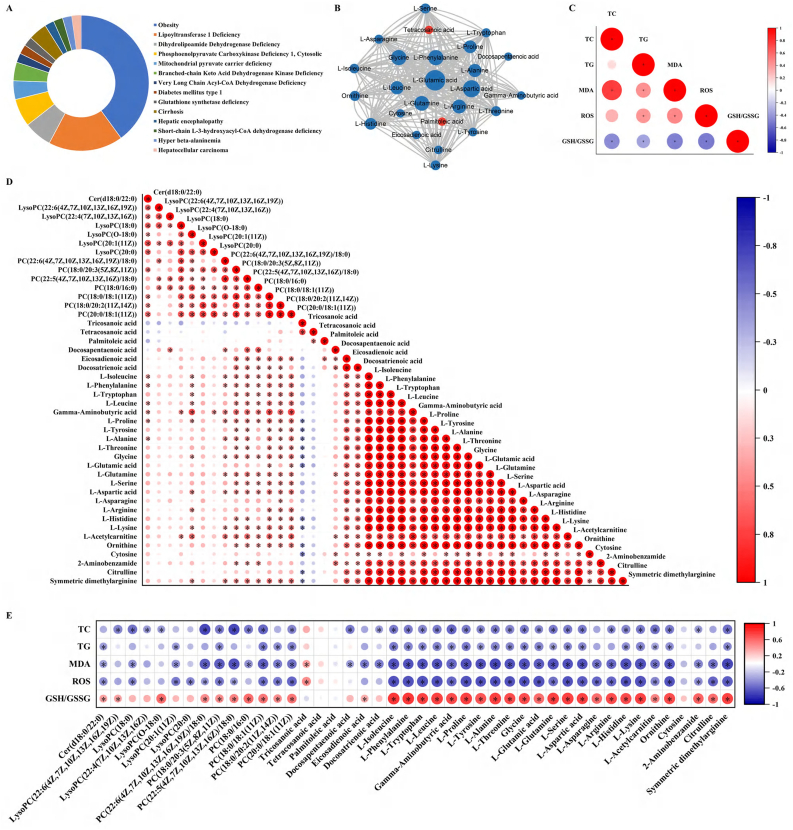
The metabolic associated fatty liver disease (MAFLD) is a public health challenge, leading to a global increase in chronic liver disease. The respiratory exposure of silica nanoparticles (SiNPs) has revealed to induce hepatotoxicity. However, its role in the pathogenesis and progression of MAFLD was severely under-studied. In this context, the hepatic impacts of SiNPs were investigated in vivo and in vitro through using ApoE-/- mice and free fatty acid (FFA)-treated L02 hepatocytes. Histopathological examinations and biochemical analysis showed SiNPs exposure via intratracheal instillation aggravated hepatic steatosis, lipid vacuolation, inflammatory infiltration and even collagen deposition in ApoE-/- mice, companied with increased hepatic ALT, AST and LDH levels. The enhanced fatty acid synthesis and inhibited fatty acid β-oxidation and lipid efflux may account for the increased hepatic TC/TG by SiNPs. Consistently, SiNPs induced lipid deposition and elevated TC in FFA-treated L02 cells. Further, the activation of hepatic oxidative stress was detected in vivo and in vitro, as evidenced by ROS accumulation, elevated MDA, declined GSH/GSSG and down-regulated Nrf2 signaling. Endoplasmic reticulum (ER) stress was also triggered in response to SiNPs-induced lipid accumulation, as reflecting by the remarkable ER expansion and increased BIP expression. More importantly, an UPLC-MS-based metabolomics analysis revealed that SiNPs disturbed the hepatic metabolic profile in ApoE-/- mice, prominently on amino acids and lipid metabolisms. In particular, the identified differential metabolites were strongly correlated to the activation of oxidative stress and ensuing hepatic TC/TG accumulation and liver injuries, contributing to the progression of liver diseases. Taken together, our study showed SiNPs promoted hepatic steatosis and liver damage, resulting in the aggravation of MAFLD progression. More importantly, the disturbed amino acids and lipid metabolisms-mediated oxidative stress was a key contributor to this phenomenon from a metabolic perspective.

Keywords: Hepatotoxicity; Metabolic associated fatty liver disease; Metabolomics; Oxidative stress; Silica nanoparticle.


Conflict of interest statement

Declaration of competing interest All the authors have no conflict of interest.

Figures

Image 1
Graphical abstract
Fig. 1
Fig. 1
Representative TEM image of tested SiNPs. Scale bar, 100 nm.
Fig. 2
Fig. 2
Histopathological alterations, injury and lipid accumulation caused by SiNPs in the liver. (A) Representative HE-stained images of liver tissues (n = 3 per group). Fat vacuoles of different sizes (black arrow). Inflammatory cell infiltration (red arrow). The Mallory bodies (green arrow). Oil Red O (B) and Masson's trichrome staining (C) of liver tissues and corresponding semi-quantifications (D - E; n = 3 per group). Increased LDH (F), ALT (G) and AST (H) were detected in SiNPs-treated liver (n = 8 per group). Moreover, the determination of TC (I) and TG (J) level in the liver (n = 8 per group) indicated advanced steatosis caused by SiNPs. (K) Relative expression of genes related to lipid metabolism (n = 4 per group). The scale bar, 100 or 50 μm. Data are shown as mean ± SD. p < 0.05 vs control. (For interpretation of the references to color in this figure legend, the reader is referred to the Web version of this article.)
Fig. 3
Fig. 3
Lipid accumulation, oxidative stress and ER stress in MAFLD cell model. Oil Red O staining (A) and corresponding semi-quantitative analysis (B), the determination of TC level (D) in L02 cells, and the interaction analysis (C and E) indicated advanced steatosis caused by SiNPs. ROS content measurement (F) and the interaction analysis (G) were shown, as well as the protein expressions of BIP and CHOP (H). The scale bar, 50 μm. Data are shown as mean ± SD, n = 3. p < 0.05 vs control and #p < 0.05 vs FFA mixture. (For interpretation of the references to color in this figure legend, the reader is referred to the Web version of this article.)
Fig. 4
Fig. 4
Oxidative stress and ER stress induced by SiNPs in the liver. Representative images (A) and corresponding analysis (B) of ROS staining in liver (n = 3 per group), and also, the quantitative analysis of hepatic ROS content by FCM (C; n = 8 per group) were performed. The scale bar, 50 μm. According to the biochemical determination, declined GSH (D) and the ratio of GSH to GSSG (F), whilst increased GSSG (E) and MDA content (G) were induced by SiNPs (n = 8 per group). Meanwhile, hepatic ALT level was correlated with both GSH/GSSG (H) and ROS (I). (J) Relative mRNA expression of genes involved in Nrf2 signaling pathways (n = 4 per group). (K) Ultrastructure observation of mice liver by TEM. Mitochondrial deformation (yellow arrow), lipid droplets (black arrow), and swollen, fractured ER (green arrow) were seen. The scale bar, 2.0 or 5.0 μm. Immunohistochemical images of BIP (L-a), and BIP protein expression (L-b) and its analysis (L-c) in the liver. The scale bar, 50 μm (n = 3 per group). Data are shown as mean ± SD. p < 0.05 vs control. (For interpretation of the references to color in this figure legend, the reader is referred to the Web version of this article.)
Fig. 5
Fig. 5
Primary screening and related analysis of metabolites. (A) QC of reversed phase C18 separation. (B) The PCA scores plot, and OPLS-DA analysis of positive mode for RPC (C, D) were shown. n = 9 per group, except for 8 samples for 1.5 mg/kg·bw group. (E) Heatmap analysis for 3.0 and 6.0 mg/kg·bw SiNPs group, respectively. QC, quality control; RPC, reversed-phase chromatography.
Fig. 6
Fig. 6
MetPA analysis of identified metabolites. MetPA analysis for 3.0 (A) and 6.0 mg/kg·bw SiNPs group (B). (C) The relative expression of enriched metabolites in the first three important metabolic pathways, including alanine, aspartate and glutamate metabolism (a), arginine and proline metabolism (b), and glycine, serine and threonine metabolism (c). Data are shown as mean ± SD. p < 0.05 vs control.
Fig. 7
Fig. 7
The disturbed differential metabolites may contribute to the activation of oxidative stress and resultant hepatic steatosis, leading to liver-related diseases. These metabolites were associated with liver-related diseases (A). Altered metabolites were mapped to MetaboAnalyst and interaction network was generated in Cytoscape (B). Red and blue colors indicate up- and down-regulation of metabolite level, respectively. And area of the circle is correlated with the Betweeness centrality. Statistical correlations between oxidative stress- and hepatic steatosis-related indicators (C), between the identified differential metabolites (D), between metabolites and indicators (E) were analyzed. The deeper and larger the circle, the greater the correlation between the two indexes (n = 8 per group, ∗p < 0.05). (For interpretation of the references to color in this figure legend, the reader is referred to the Web version of this article.)

References

    1. Yang Y., Li J. Lipid, protein and poly(NIPAM) coated mesoporous silica nanoparticles for biomedical applications. Adv Colloid Interface Sci. 2014;207:155–163. - PubMed
    1. Krug H.F., Wick P. Nanotoxicology: an interdisciplinary challenge. Angew Chem Int Ed Engl. 2011;50(6):1260–1278. - PubMed
    1. Kaewamatawong T., Shimada A., Okajima M., Inoue H., Morita T., Inoue K., Takano H. Acute and subacute pulmonary toxicity of low dose of ultrafine colloidal silica particles in mice after intratracheal instillation. Toxicol Pathol. 2006;34(7):958–965. - PubMed
    1. Nemmar A., Vanbilloen H., Hoylaerts M.F., Hoet P.H., Verbruggen A., Nemery B. Passage of intratracheally instilled ultrafine particles from the lung into the systemic circulation in hamster. Am J Respir Crit Care Med. 2001;164(9):1665–1668. - PubMed
    1. Kreyling W.G., Semmler-Behnke M., Seitz J., Scymczak W., Wenk A., Mayer P., Takenaka S., Oberdörster G. Size dependence of the translocation of inhaled iridium and carbon nanoparticle aggregates from the lung of rats to the blood and secondary target organs. Inhal Toxicol. 2009;21(Suppl 1):55–60. - PubMed

Publication types