. 2023 Jan 17;4(1):100868.
doi: 10.1016/j.xcrm.2022.100868. Epub 2022 Dec 12.

Single-cell RNA sequencing reveals distinct T cell populations in immune-related adverse events of checkpoint inhibitors

Affiliations

Single-cell RNA sequencing reveals distinct T cell populations in immune-related adverse events of checkpoint inhibitors

Shoiab Bukhari et al. Cell Rep Med. .

Abstract

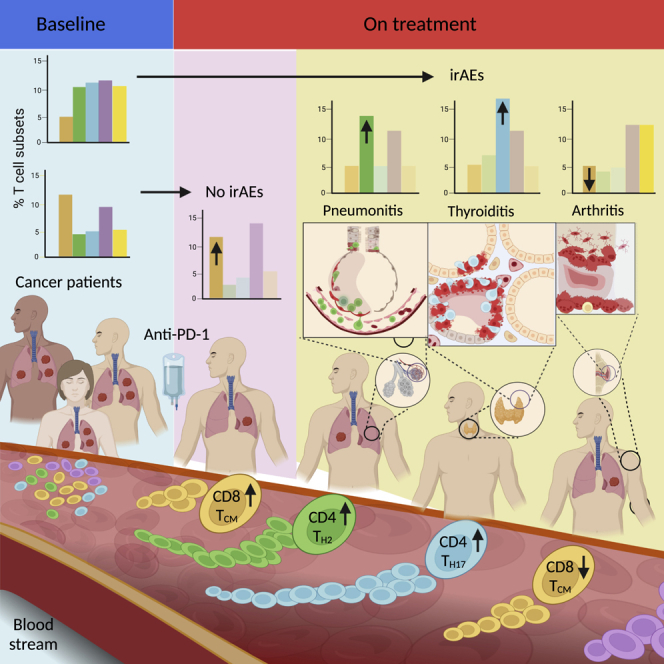
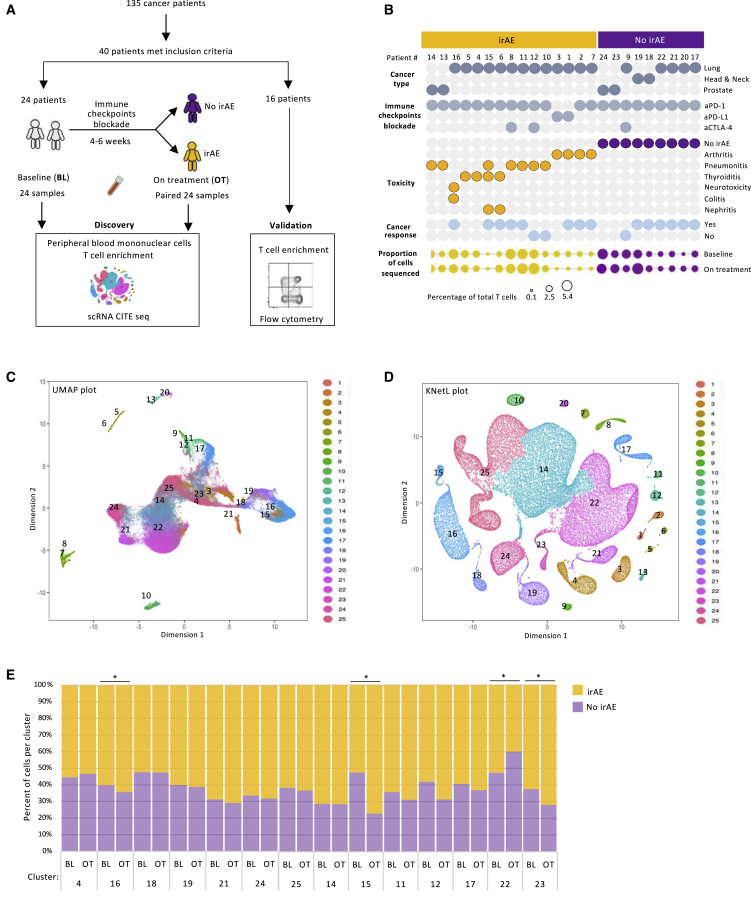
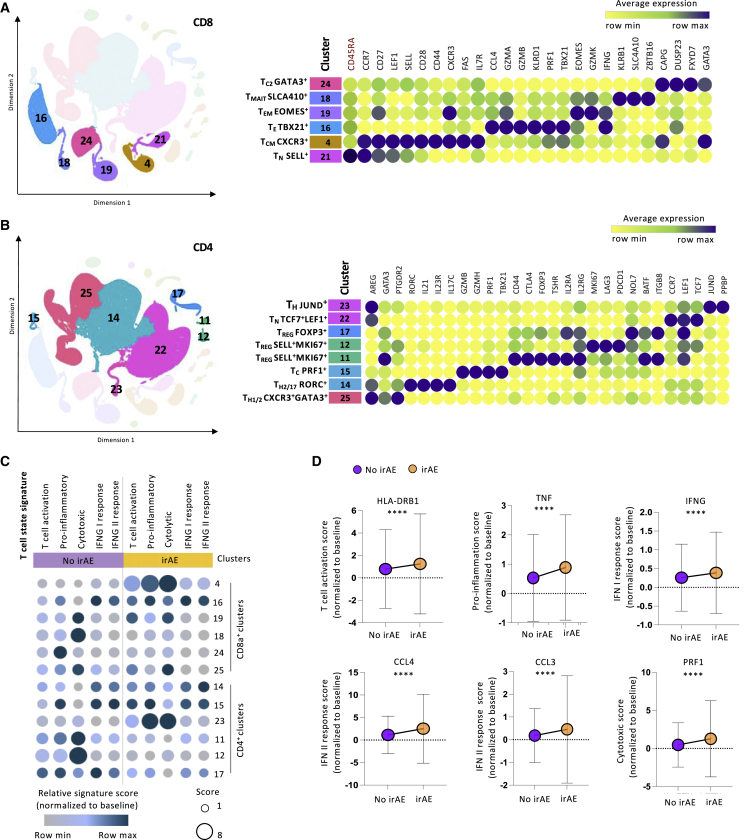
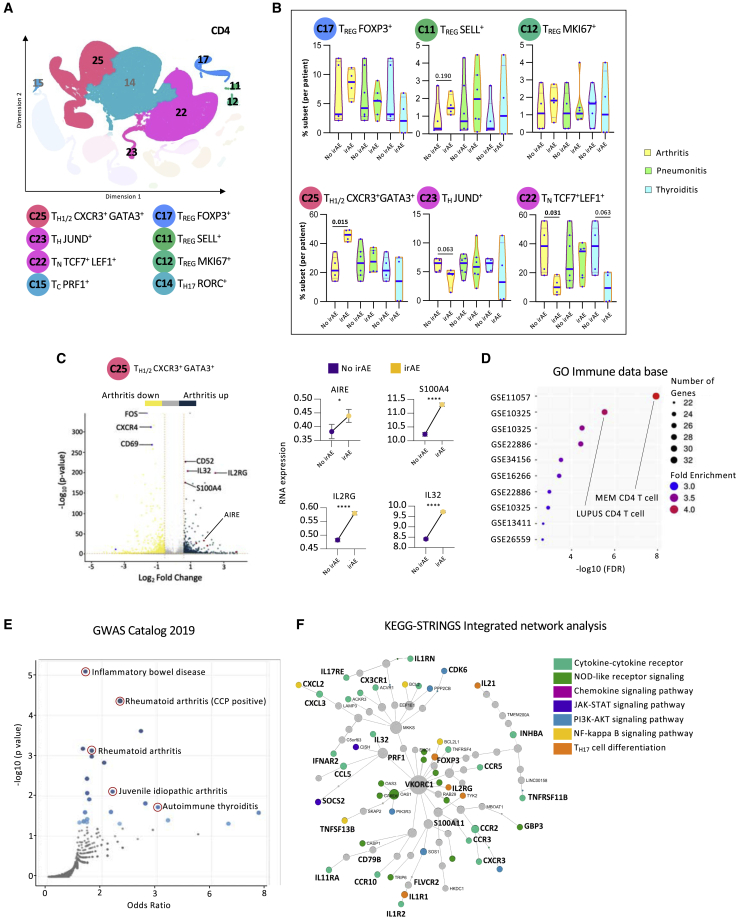
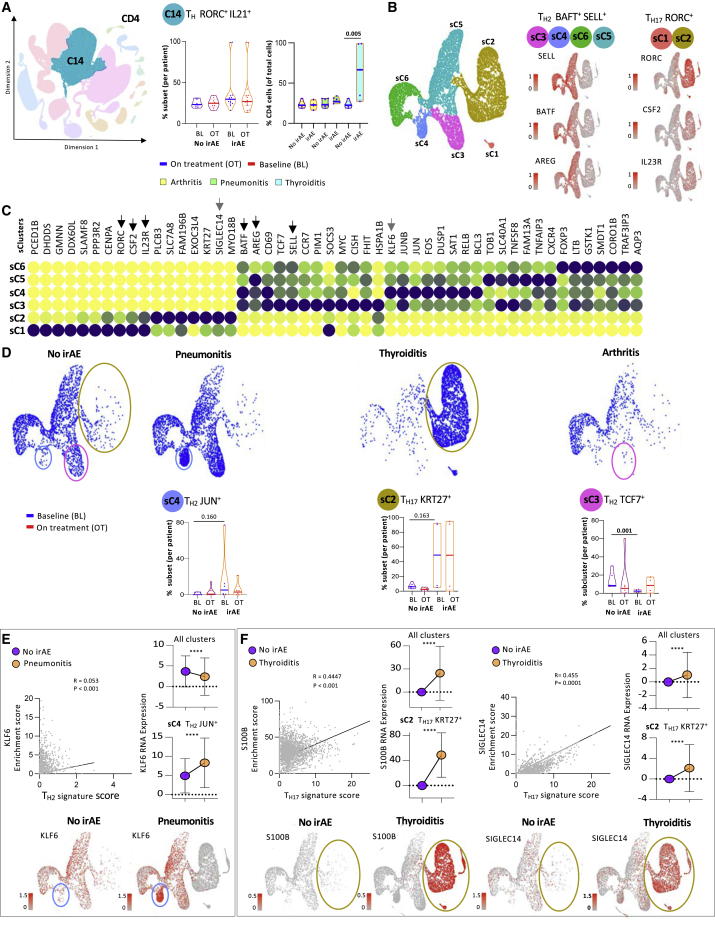
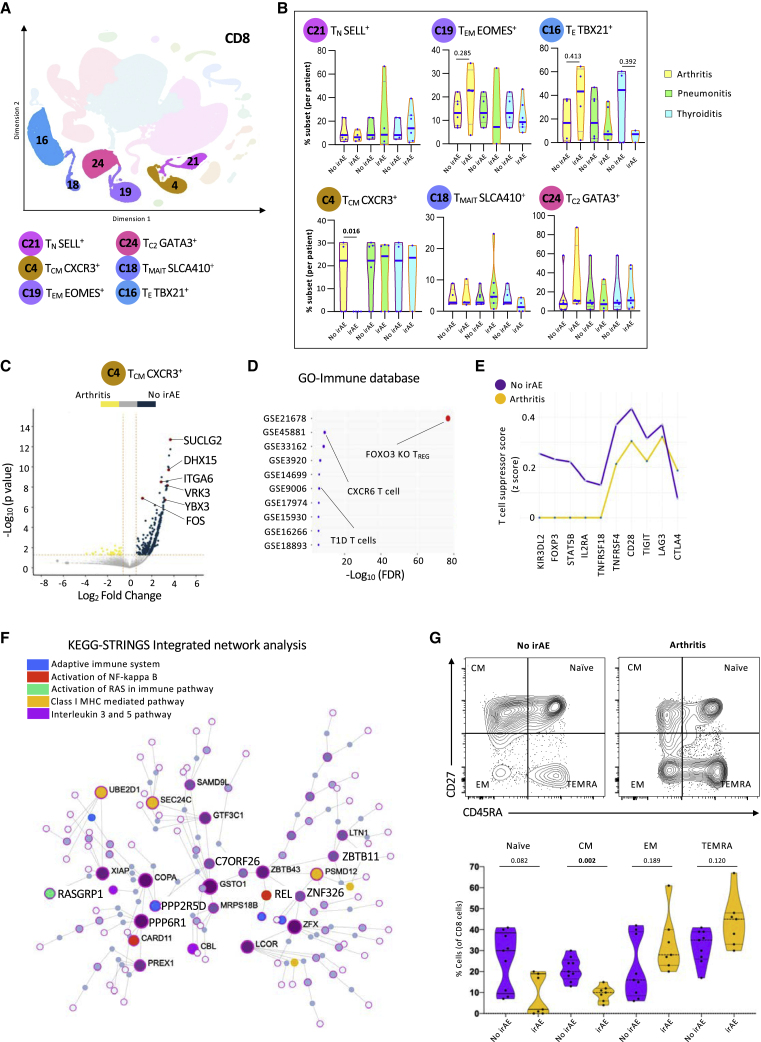
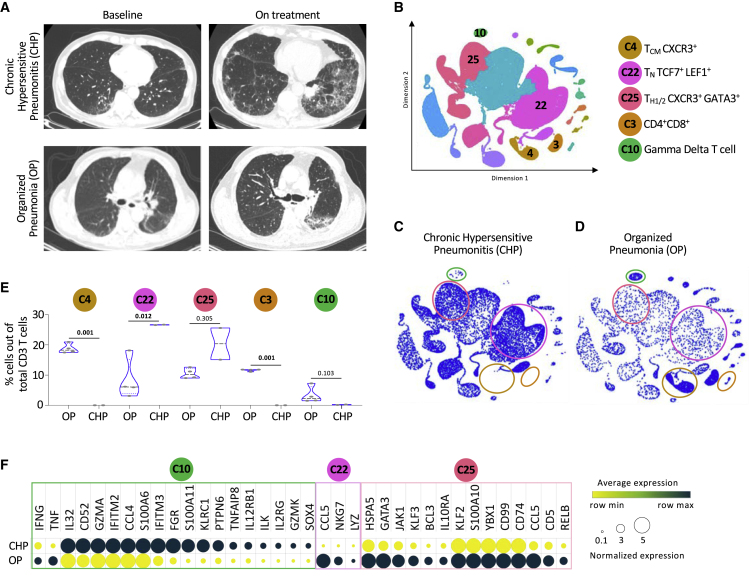
PD-1 is an inhibitory receptor in T cells, and antibodies that block its interaction with ligands augment anti-tumor immune responses. The clinical potential of these agents is limited by the fact that half of all patients develop immune-related adverse events (irAEs). To generate insights into the cellular changes that occur during anti-PD-1 treatment, we performed single-cell RNA sequencing of circulating T cells collected from patients with cancer. Using the K-nearest-neighbor-based network graph-drawing layout, we show the involvement of distinctive genes and subpopulations of T cells. We identify that at baseline, patients with arthritis have fewer CD8 TCM cells, patients with pneumonitis have more CD4 TH2 cells, and patients with thyroiditis have more CD4 TH17 cells when compared with patients who do not develop irAEs. These data support the hypothesis that different populations of T cells are associated with different irAEs and that characterization of these cells' pre-treatment has the potential to serve as a toxicity-specific predictive biomarker.

Keywords: PD-1; T cells; arthritis; autoimmunity; checkpoint inhibitor; immune-related adverse events; irAEs; pneumonitis; single-cell RNA sequencing; thyroiditis.


Conflict of interest statement

Declaration of interests The authors declare no competing interests.

Figures

None
Graphical abstract
Figure 1
Figure 1
Dimensionality reduction approach to visualize single-cell RNA sequencing data of patients with immune-related adverse events (A) Schematic workflow of study design. (B) Clinical characterization of the patients. (C and D) UMAP (C) and KNetL projection (D) of 135,287 T cells from patients with and without irAEs. (E) Percentage variation in T cells between the baseline and on treatment within the cohorts of patients with no irAEs and with irAEs (paired t test). Statistical significance for paired comparisons was performed by Student’s t test applying Wilcoxon matched-pairs signed rank test, p value reported, one-tailed. Data are presented as mean ± SD. p value, exact, two-tailed. ∗p < 0.05, ∗∗p < 0.01, ∗∗∗p < 0.001.
Figure 2
Figure 2
Gene-marker-based cluster annotation identifies effector, regulatory, and memory subsets of peripheral T cells (A and B) KNetL plot schematic of clusters according to the expression levels of CD8A with a corresponding heatmap showing the expression of selected markers in CD8A clusters (CD45RA in red fonts indicates the CITE-seq-based protein expression) (A) and CD4 clusters (B). (C) Heatmap-dot plot indicating the association between T cell states and clusters based on the relative signature score variabilities. (D) Dot plot showing the comparison of T cell states between the cohorts of patients with no irAEs and with irAEs based on the marker gene scores (unpaired t test). For unpaired comparisons, statistical significance was performed by Student’s t test applying Mann-Whitney test. Data are presented as mean ± SD. p value, exact, two-tailed, the center lines denote the mean of SD. ∗∗∗∗p < 0.0001.
Figure 3
Figure 3
Patients with immune-related arthritis have higher TH1/2 cells and lower percentages of naive CD4 T cells at baseline (A) Representative KNetL plot of annotated CD4 T cell clusters. (B) Mean percentage of cells in six CD4 T cell subsets across the different clinical outcomes: arthritis, pneumonitis, and thyroiditis at baseline (unpaired t test). (C) Volcano plot highlighting the up-regulated and down-regulated genes in cluster 25 of patients with arthritis, with paired-dot plots comparing the RNA expression of upregulated genes between no-irAE and arthritis groups. (D and E) Gene Ontology (GO) analysis for differential genes present in cluster 25 from patients with arthritis for enriched terms from Immune.MSigDB (D) and from the GWAS Catalog 2019 (E). (F) Pathway analysis of differentially expressed genes in cluster 25 from patients with arthritis using integrative KEGG-String platform. Statistical significance for unpaired comparisons was performed by Student’s t test applying Mann-Whitney test. Data are presented as mean ± SEM. p value, exact, two-tailed, the center lines denote the mean of SEM. ∗p < 0.05, ∗∗∗∗p < 0.0001.
Figure 4
Figure 4
Selected subsets of CD4 helper T cells are associated with organ-specific irAEs (A) Representative KNetL plot of cluster 14 and mean percentage differences in TH RORC+ IL21+ cells per patient and across the disease groups: arthritis, pneumonitis, and thyroiditis. (B) Subclustering of C14 cells into 6 sub clusters: sC1–sC6. Representative genes are shown separately. (C) Heatmap showing the expression of markers associated with different subclusters among TH2 and TH17 families of cells. Black arrows indicate the subset defining markers. (D) Differential clustering among the clinical irAE groups at baseline. Quantification of the percentages of cells in three clusters (sC3, sC4, and sC2) among irAE and no-irAE groups. The patients elected for each of the no-irAE groups were selected to match the type of underlying tumor. (E) Correlation and RNA expression plots highlighting the association of candidate gene markers with TH2 and TH17 clusters based on enrichment score. Representative KNetL plots showing the expression of candidate gene markers KLF6, S100B, and SIGLEC14 specifying the predictive cell populations present in pneumonitis and thyroiditis. Statistical significance for unpaired comparisons was performed by Student’s t test applying Mann-Whitney test. Data are presented as mean ± SEM. p value, exact, two-tailed, the center lines denote the mean of SEM. ∗p < 0.05, ∗∗p < 0.01, ∗∗∗p < 0.001.
Figure 5
Figure 5
Patients with inflammatory arthritis have lower levels of central memory CD8 T cells at baseline (A) Representative KNetL plot of annotated CD8 T cell clusters. (B) Mean percentage of cells in six CD8 T cell subsets across the different clinical outcomes: arthritis, pneumonitis, and thyroiditis at baseline (unpaired t test). (C) Volcano plot highlighting the up-regulated and down-regulated genes in TCM CXCR3+ cells in patients with no irAEs. (D) GO analysis for differential genes present in TCM CXCR3+ cells from patients with no irAEs for enriched terms from Immune.MSigDB. (E) Line graph showing the comparison of T cell states between cohorts of patients with no irAEs and arthritis based on the T suppressor cell signature score. (F) Pathway analysis of differentially expressed genes in TCM CXCR3+ cells from patients with no irAEs using integrative KEGG-String platform. (G) Quantification of flow cytometry data of 19 patients, showing percentages of naive, central memory (CM), effector memory (EM), and terminally differentiated T (TEMRA) cells at baseline. Statistical significance for unpaired comparisons was performed by Student’s t test applying Mann-Whitney test. Data are presented as mean ± SEM. p value, exact, two-tailed, the center lines denote the mean of SEM. ∗p < 0.05, ∗∗p < 0.01, ∗∗∗p < 0.001.
Figure 6
Figure 6
Patients with immune-related pneumonitis have distinctive distributions of T cell populations (A) Representative chest CT scans of patients with chronic hypersensitive pneumonitis (CHP) and organized pneumonia (OP) at baseline and on treatment. (B) Representative KNetL plot indicating key clusters to be used to distinguish the pneumonitis groups. (C) Cells of patients with CHP are enriched in clusters C10, C3, and C4. (D) Cells of patients with OP are depleted in clusters of C22 and C25. (E) Quantification of the mean percentage differences in CD3 T cell subsets among the different pneumonitis groups. (F) Heatmap showing the RNA expression of differentially expressed genes between CHP and OP groups within the clusters C10, C22, and C25. Statistical significance for unpaired comparisons was performed by Student’s t test applying Mann-Whitney test. Data are presented as mean ± SEM. p value, exact, two-tailed, the center lines denote the mean of SEM. ∗p < 0.05, ∗∗p < 0.01, ∗∗∗p < 0.001.

Comment in

References

    1. Hamid O., Robert C., Daud A., Hodi F.S., Hwu W.-J., Kefford R., Wolchok J.D., Hersey P., Joseph R.W., Weber J.S., Ribas A. Safety and tumor responses with lambrolizumab (Anti–PD-1) in melanoma. N. Engl. J. Med. 2013;369:134–144. - PMC - PubMed
    1. Rizvi N.A., Mazières J., Planchard D., Stinchcombe T.E., Dy G.K., Antonia S.J., Horn L., Lena H., Minenza E., Mennecier B., et al. Activity and safety of nivolumab, an anti-PD-1 immune checkpoint inhibitor, for patients with advanced, refractory squamous non-small-cell lung cancer (CheckMate 063): a phase 2, single-arm trial. Lancet Oncol. 2015;16:257–265. doi: 10.1016/S1470-2045(15)70054-9. - DOI - PMC - PubMed
    1. Hodi F.S., O'Day S.J., McDermott D.F., Weber R.W., Sosman J.A., Haanen J.B., Gonzalez R., Robert C., Schadendorf D., Hassel J.C., et al. Improved survival with ipilimumab in patients with metastatic melanoma. N. Engl. J. Med. 2010;363:711–723. - PMC - PubMed
    1. Postow M.A., Chesney J., Pavlick A.C., Robert C., Grossmann K., McDermott D., Linette G.P., Meyer N., Giguere J.K., Agarwala S.S., et al. Nivolumab and ipilimumab versus ipilimumab in untreated melanoma. N. Engl. J. Med. 2015;372:2006–2017. - PMC - PubMed
    1. Weber J.S., D'Angelo S.P., Minor D., Hodi F.S., Gutzmer R., Neyns B., Hoeller C., Khushalani N.I., Miller W.H., Jr., Lao C.D., et al. Nivolumab versus chemotherapy in patients with advanced melanoma who progressed after anti-CTLA-4 treatment (CheckMate 037): a randomised, controlled, open-label, phase 3 trial. Lancet Oncol. 2015;16:375–384. - PubMed

Publication types