. 2023 Jan:67:101654.
doi: 10.1016/j.molmet.2022.101654. Epub 2022 Dec 10.

The BBSome regulates mitochondria dynamics and function

Affiliations

The BBSome regulates mitochondria dynamics and function

Deng-Fu Guo et al. Mol Metab. 2023 Jan.

Erratum in

Abstract

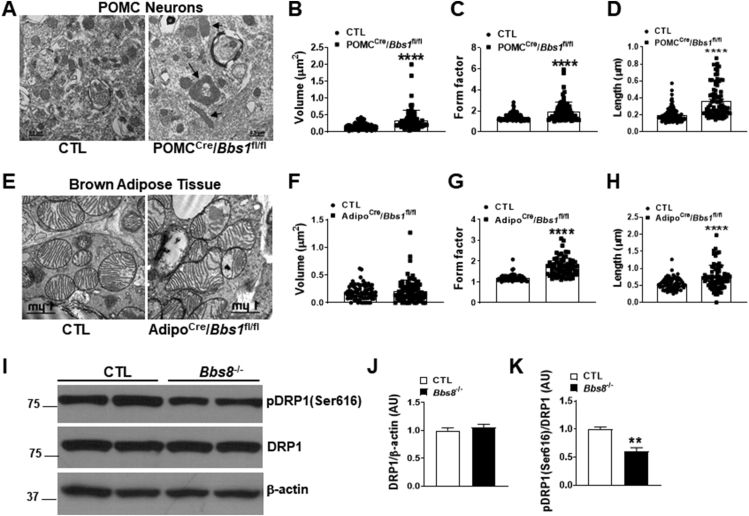
Objective: The essential role of mitochondria in regulation of metabolic function and other physiological processes has garnered enormous interest in understanding the mechanisms controlling the function of this organelle. We assessed the role of the BBSome, a protein complex composed of eight Bardet-Biedl syndrome (BBS) proteins, in the control of mitochondria dynamic and function.

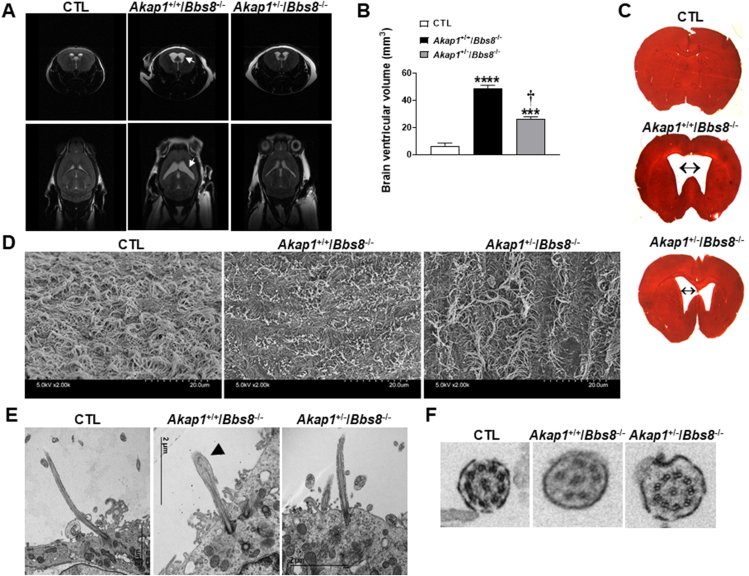
Methods: We used a multidisciplinary approach that include CRISPR/Cas9 technology-mediated generation of a stable Bbs1 gene knockout hypothalamic N39 neuronal cell line. We also analyzed the phenotype of BBSome deficient mice in presence or absence of the gene encoding A-kinase anchoring protein 1 (AKAP1).

Results: Our data show that the BBSome play an important role in the regulation of mitochondria dynamics and function. Disruption of the BBSome cause mitochondria hyperfusion in cell lines, fibroblasts derived from patients as well as in hypothalamic neurons and brown adipocytes of mice. The morphological changes in mitochondria translate into functional abnormalities as indicated by the reduced oxygen consumption rate and altered mitochondrial distribution and calcium handling. Mechanistically, we demonstrate that the BBSome modulates the activity of dynamin-like protein 1 (DRP1), a key regulator of mitochondrial fission, by regulating its phosphorylation and translocation to the mitochondria. Notably, rescuing the decrease in DRP1 activity through deletion of one copy of the gene encoding AKAP1 was effective to normalize the defects in mitochondrial morphology and activity induced by BBSome deficiency. Importantly, this was associated with improvement in several of the phenotypes caused by loss of the BBSome such as the neuroanatomical abnormalities, metabolic alterations and obesity highlighting the importance of mitochondria defects in the pathophysiology of BBS.

Conclusions: These findings demonstrate a critical role of the BBSome in the modulation of mitochondria function and point to mitochondrial defects as a key disease mechanism in BBS.

Keywords: Bardet-biedl syndrome proteins; Body weight; Leptin sensitivity; Mitochondria.


Figures

Figure 1
Figure 1
Mouse hypothalamic cells lacking the Bbs1 gene display elongated mitochondria. (A–D) Representative TEM images of mitochondria (A) and related quantification of mitochondrial area (B), form factor (C) and length (D) in N39 (WT) and N39-Bbs1KO (Bbs1KO) with or without FIV-DRP1S637A (n = 3, 16 images/group). (E–G) Representative images of mitochondria (E) and related quantification of the form factor (F) and mitochondria length (G) in cells infected with mito-GFP then serum starved or cultured with 10%FBS with or without PDGF-BB overnight (n = 3, 30 images/group). (H–I) Representative images of mito-chip assay (I) and related quantification of mitochondria distribution (J) in WT and Bbs1KO cells (n = 3, 16 images/group). (J–K) Cytosolic (J) and mitochondrial (K) Ca2+ induced by PDGF-BB in WT and Bbs1KO cells (n = 3, 24 cells/group). (L) Comparison of oxygen consumption rate (OCR) between WT and Bbs1KO cells (n = 7/group). OLIGO: Oligomycin, FCCP: Carbonyl cyanide 4-(trifluoromethoxy) phenylhydrazone, ROT/ANTA: Rotenone/Antimycin A. Data are mean ± SEM and were analyzed by one-way ANOVA except for L, analyzed with repeated measures (RM) two-way ANOVA, and J-K, analyzed by ttest. ∗∗P < 0.01, ∗∗∗P < 0.001 and ∗∗∗∗P < 0.0001 vs. WT (and vs Bbs1KO + DRP1S637A in B–C).
Figure 2
Figure 2
Role of DRP1 in mitochondria defects evoked by BBSome deficiency. (A–C) Representative Western blots (A) and related quantification of DRP1 (B) and pDRP1(Ser616) (C) in N39 (WT), N39-Bbs1KO (Bbs1KO) and N39-Bbs1KO infected with AAV-Bbs1 (n = 9/group). (D–F) Representative Western blots (D) and related quantification depicting the effect of PKA activator, forskolin (25 μM, 1h), on pDRP1(Ser637) (E) and pDRP1(Ser616) (F) in WT and Bbs1KO cells (n = 9/group). (G–H) Representative Western blots (G) and related quantification (H) of pDRP1(Ser616) in WT and Bbs1KO cells with or without FIV-DRP1S637A (n = 9/group). (I–K) Representative mitochondria (mito-GFP) images (I) and related quantification of the form factor (J) and mitochondria length (K) in WT and Bbs1KO cells with or without FIV-DRP1S637A (n = 3, 30 images/group). Data are mean ± SEM and were analyzed by one-way ANOVA except data in E analyzed by ttest. ∗∗P < 0.01, ∗∗∗P < 0.001, ∗∗∗∗P < 0.0001 vs WT group.
Figure 3
Figure 3
Interaction between the BBSome and mitochondria. (A) Representative Western blots of sucrose gradient showing partial co-localization of the endogenous CHC and DRP1 (fraction 7–9), CHC and BBS2 (fraction between 9 and 16) and BBS3 and MFN2 (fraction between 4 and 8) in human RPE1 cells (n = 3). (B) Representative images of co-localization of red fluorescent protein (RFP)-tagged BBS7 with mitochondria in N39 (WT) cells, but not in N39-Bbs1KO (Bbs1KO) cells (n = 3). (C–E) Representative Western blots (C) and related quantification (D–E) of BBS8, DRP1 and GRP75 (loading control) in purified mitochondria from WT and Bbs1KO cells (n = 8/group). Data are mean ± SEM and were analyzed by ttest. ∗∗P < 0.01 vs WT group.
Figure 4
Figure 4
BBSome deficiency affect mitochondria dynamics in vivo. (A–D) Representative TEM images of mitochondria (A) and related quantification of mitochondrial volume (B), form factor (C) and length (D) in POMC neurons of control (CTL) and POMCCre/Bbs1fl/fl mice. Arrows indicate defective mitochondria (n = 3, 12 images/group). (E–H) Representative mitochondrial TEM images (E) and related quantification of the mitochondrial area (F), form factor (G) and length (H) in brown adipocytes of CTL and AdipoCre/Bbs1fl/fl mice (n = 3, 12 images/group). (I–K) Representative Western blots (I) and quantitation of DRP1 (J) and pDRP1 (ser616) (K) in the hypothalamus of CTL and Bbs8−/− mice, (n = 4/group). Data are mean ± SEM and were analyzed by ttest. ∗∗P < 0.01 and ∗∗∗∗P < 0.0001 vs CTL.
Figure 5
Figure 5
Akap1 heterozygosity rescues mitochondria defects in BBSome deficient mice. (A–C) Representative Western blots (A) and quantitation of DRP1(Ser616) (B) and DRP1 (C) in the hypothalamus of control (CTL), Akap1+/+/Bbs8−/− and Akap1+/−/Bbs8−/− mice (n = 6/group). (D–G) Representative TEM images of mitochondria (D) and quantitation of mitochondrial volume (E), form factor (F) and length (G) in in the hypothalamus of control (CTL), Akap1+/−/Bbs8−/− and Akap1+/−/Bbs8−/− mice (n = 3, 16 images/group). Data are mean ± SEM and were analyzed by one-way ANOVA. ∗P < 0.05, ∗∗P < 0.01, ∗∗∗P < 0.001, and ∗∗∗∗P < 0.001 vs CTL; P < 0.0001 vs Akap1+/+/Bbs8−/− mice.
Figure 6
Figure 6
Rescuing the mitochondria defects partially reverses the hydrocephalus associated with BBSome deficiency. (A–B) Representative coronal and sagittal MRI images and quantification of brain ventricles of control (CTL), Akap1+/+/Bbs8−/− and Akap1+/−/Bbs8−/− mice (n = 4/group). The arrow points to the hydrocephalic region. (C) Representative image of neutral-red-stained coronal brain sections of CTL, Akap1+/+/Bbs8−/− and Akap1+/−/Bbs8−/− mice. Double head arrow indicates the enlarged lateral ventricles (n = 2/group). (D) Representative images of scanning electron microscopy of ependymal cell cilia of CTL, Akap1+/+/Bbs8−/− and Akap1+/−/Bbs8−/− mice (n = 3/group). (E) Representative TEM images of ependymal cell cilia of CTL, Akap1+/+/Bbs8−/− and Akap1+/−/Bbs8−/− mice. Arrowhead points to the abnormally swollen cilium. (F) Transverse TEM sections depicting the axonemal arrangement of ciliary microtubules in CTL, Akap1+/+/Bbs8−/− and Akap1+/−/Bbs8−/− mice (n = 3/group). Note, loss of 9 + 2 tubulin structure in Bbs8−/− mice was restored in Akap1+/−/Bbs8−/− mice. Data are mean ± SEM and were analyzed with one-way ANOVA. ∗∗∗P < 0.001, and ∗∗∗∗P < 0.0001 vs CTL; P < 0.0001 vs Akap1+/+/Bbs8−/− mice.
Figure 7
Figure 7
Rescuing the mitochondria defects improves the metabolic abnormalities evoked by BBSome deficiency. (A–D) Body weight and fat mass, obtained by NMR, of male (A, C) and female (B, D) control (CTL; n = 12 male, 13 female), Akap1+/+/Bbs8−/− (n = 14 male, 18 female) and Akap1+/−/Bbs8−/− mice (n = 20 male, 20 female). (E) Representative MRI images of male CTL, Akap1+/+/Bbs8−/− and Akap1+/−/Bbs8−/− mice (n = 3/group). (F–G) Representative images of HE stained white adipose tissue of male CTL, Akap1+/+/Bbs8−/− and Akap1+/−/Bbs8−/− mice (n = 3/group). (H–I) Cumulative food intake of 17 weeks old male (H) and female (I) CTL (n = 12 male, 13 female), Akap1+/+/Bbs8−/− (n = 14 male, 18 female) and Akap1+/−/Bbs8−/− mice (n = 20 male, 20 female). (J–M) Glucose tolerance test (J–K) and area under the curve (AUC, L-M) in male (J, L) and female (K, M) CTL, Bbs8−/− and Akap1+/−/Bbs8−/− mice (n = 12/group). (N–O) Representative images (N) and quantification (O) of pSTAT3 immunostaining in the hypothalamic arcuate nucleus in mice treated with vehicle or leptin (2 μg/g bw, IP) (n = 3, 12 images/group). Data are mean ± SEM and were analyzed with repeated measures one-or two-way ANOVA. ∗P < 0.05, ∗∗P < 0.01, ∗∗∗P < 0.001 and ∗∗∗∗P < 0.0001 vs CTL; P < 0.05 vs Akap1+/−/Bbs8−/− mice.

References

    1. Chaudhuri D., Sancak Y., Mootha V.K., Clapham D.E. MCU encodes the pore conducting mitochondrial calcium currents. Elife. 2013;2 - PMC - PubMed
    1. Shadel G.S., Horvath T.L. Mitochondrial ROS signaling in organismal homeostasis. Cell. 2015;163(3):560–569. - PMC - PubMed
    1. Liesa M., Shirihai O.S. Mitochondrial dynamics in the regulation of nutrient utilization and energy expenditure. Cell Metabol. 2013;17(4):491–506. - PMC - PubMed
    1. Norat P., Soldozy S., Sokolowski J.D., Gorick C.M., Kumar J.S., Chae Y., et al. Mitochondrial dysfunction in neurological disorders: exploring mitochondrial transplantation. NPJ Regen Med. 2020;5(1):22. - PMC - PubMed
    1. Zhou Z., Austin G.L., Young L.E.A., Johnson L.A., Sun R. Mitochondrial metabolism in major neurological diseases. Cells. 2018;7(12) - PMC - PubMed

Publication types