. 2023 Feb;14(1):464-478.
doi: 10.1002/jcsm.13148. Epub 2022 Dec 13.

AdipoRon enhances healthspan in middle-aged obese mice: striking alleviation of myosteatosis and muscle degenerative markers

Affiliations

AdipoRon enhances healthspan in middle-aged obese mice: striking alleviation of myosteatosis and muscle degenerative markers

Camille M Selvais et al. J Cachexia Sarcopenia Muscle. 2023 Feb.

Abstract

Background: Obesity among older adults has increased tremendously. Obesity accelerates ageing and predisposes to age-related conditions and diseases, such as loss of endurance capacity, insulin resistance and features of the metabolic syndrome. Namely, ectopic lipids play a key role in the development of nonalcoholic fatty liver disease (NAFLD) and myosteatosis, two severe burdens of ageing and metabolic diseases. Adiponectin (ApN) is a hormone, mainly secreted by adipocytes, which exerts insulin-sensitizing and fat-burning properties in several tissues including the liver and the muscle. Its overexpression also increases lifespan in mice. In this study, we investigated whether an ApN receptor agonist, AdipoRon (AR), could slow muscle dysfunction, myosteatosis and degenerative muscle markers in middle-aged obese mice. The effects on myosteatosis were compared with those on NAFLD.

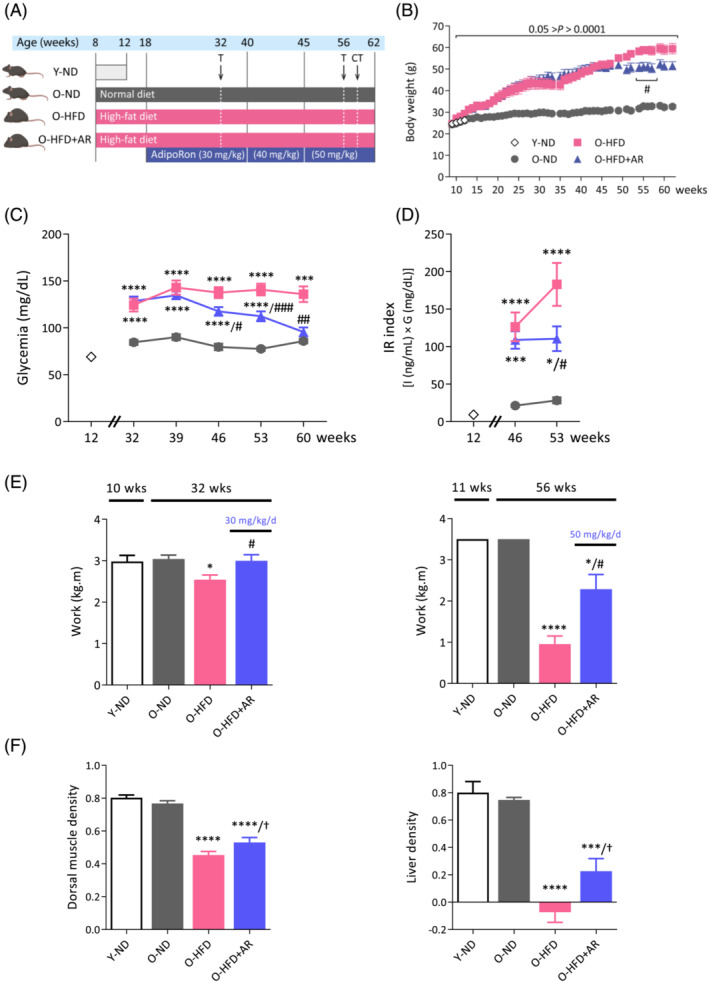
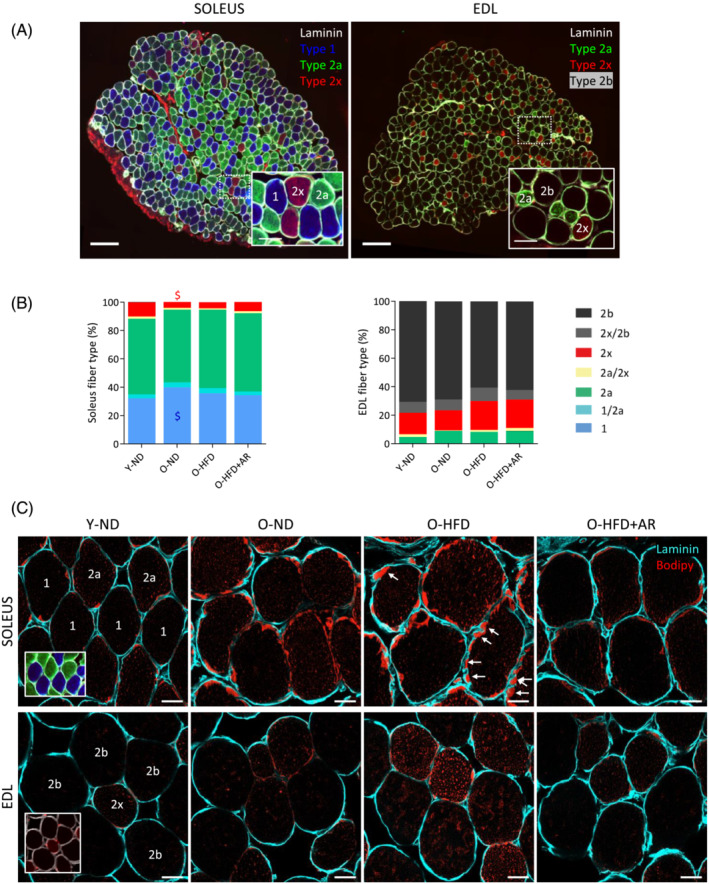
Methods: Three groups of mice were studied up to 62 weeks of age: One group received normal diet (ND), another, high-fat diet (HFD); and the last, HFD combined with AR given orally for almost 1 year. An additional group of young mice under an ND was used. Treadmill tests and micro-computed tomography (CT) were carried out in vivo. Histological, biochemical and molecular analyses were performed on tissues ex vivo. Bodipy staining was used to assess intramyocellular lipid (IMCL) and lipid droplet morphology.

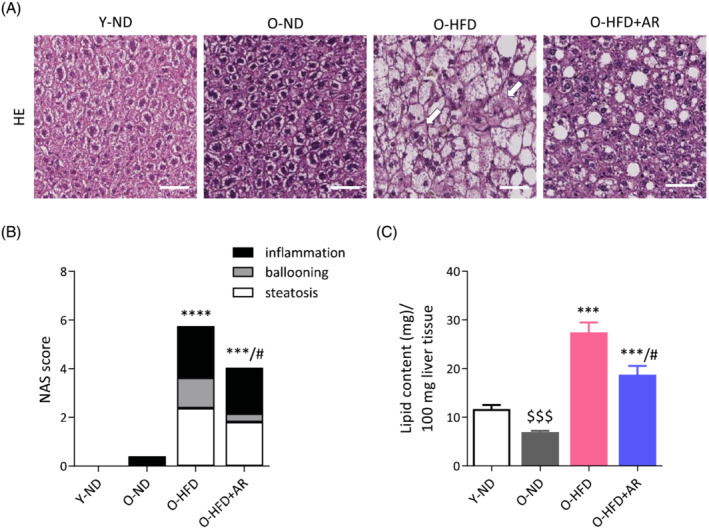
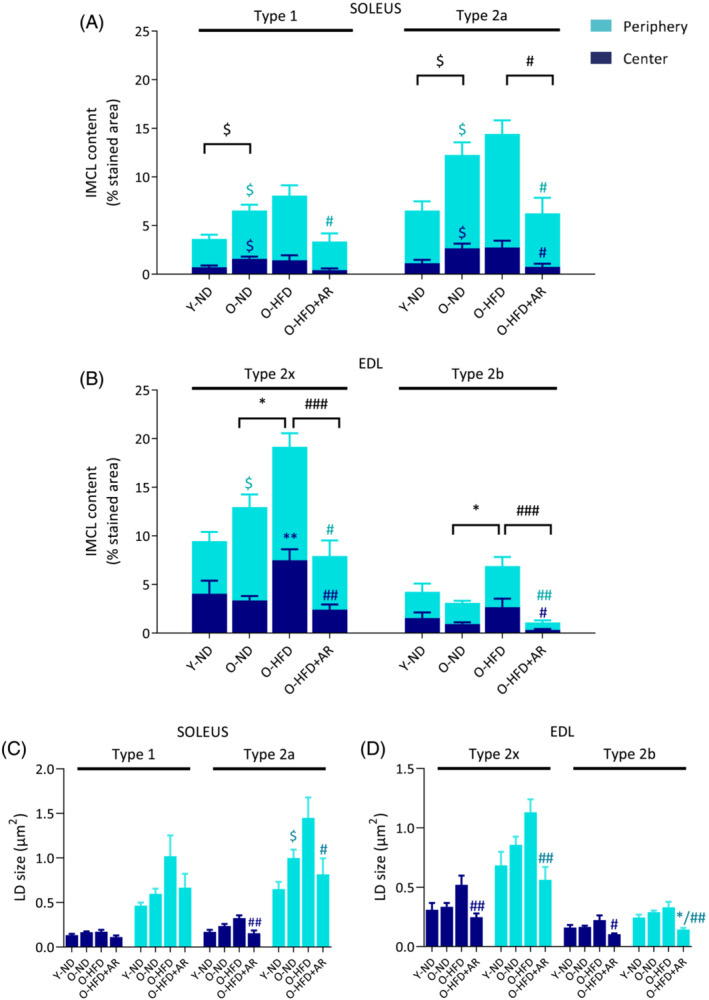
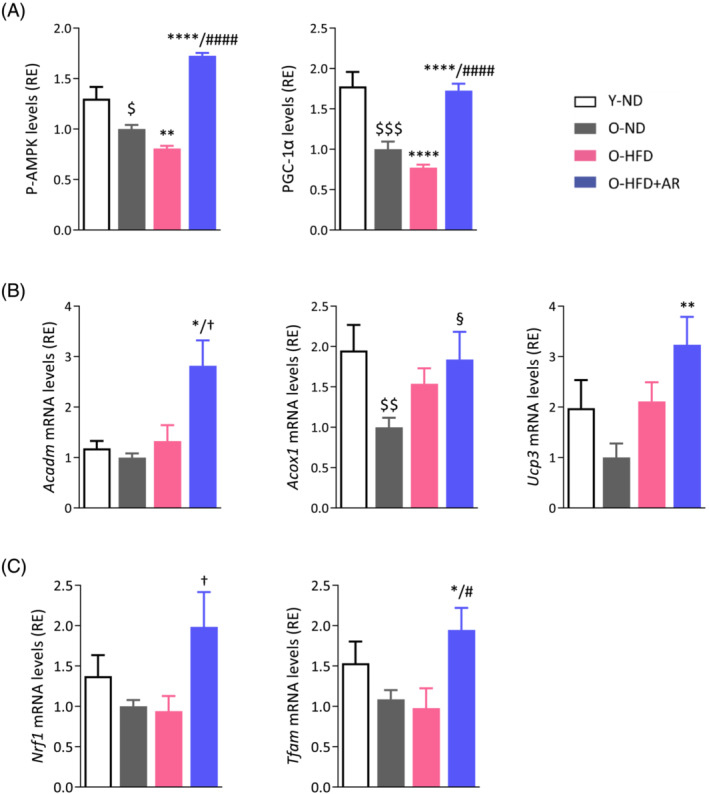
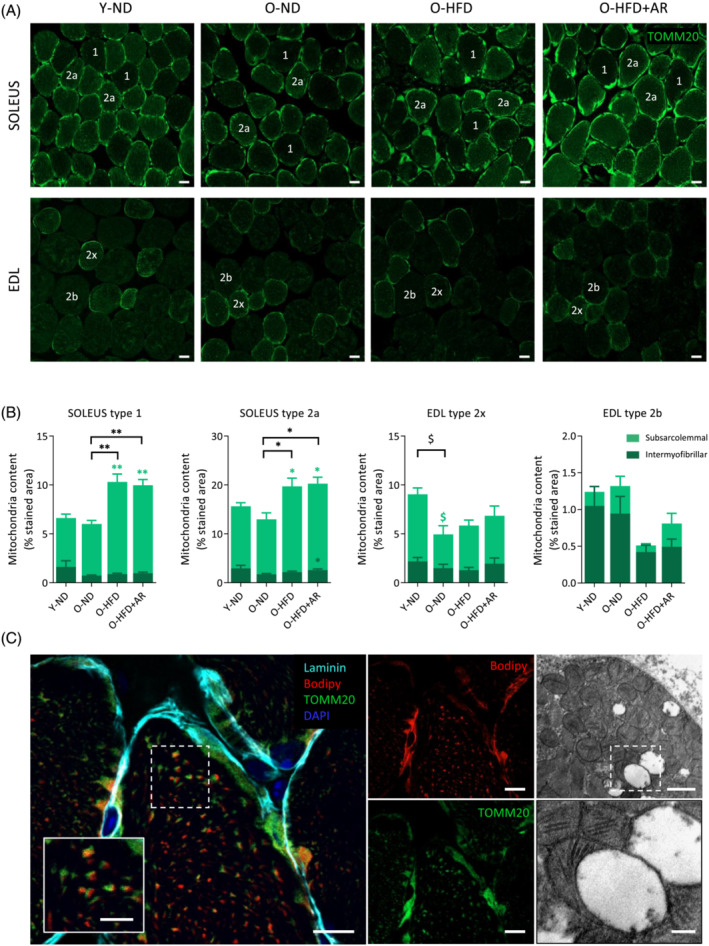
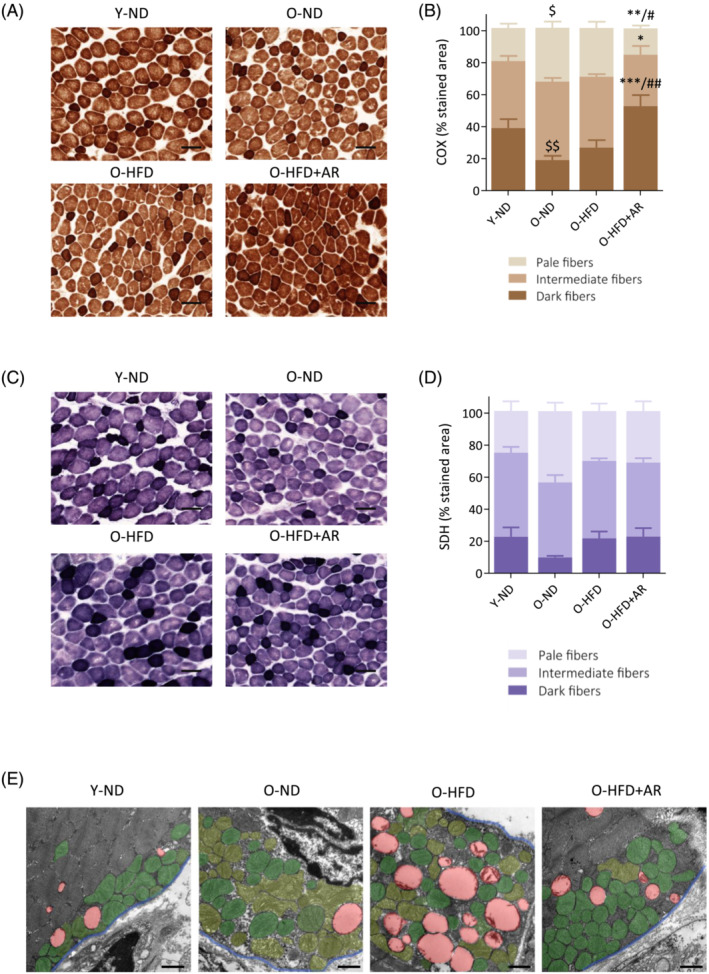
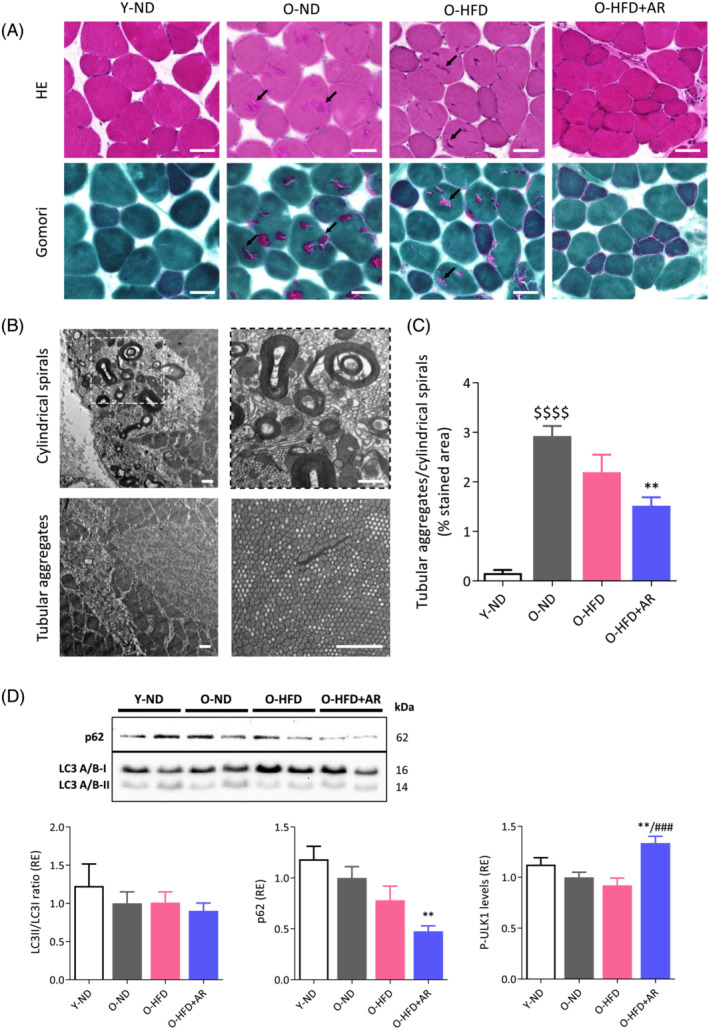
Results: AR did not markedly alter diet-induced obesity. Yet, this treatment rescued exercise endurance in obese mice (up to 2.4-fold, P < 0.05), an event that preceded the improvement of insulin sensitivity. Dorsal muscles and liver densities, measured by CT, were reduced in obese mice (-42% and -109%, respectively, P < 0.0001), suggesting fatty infiltration. This reduction tended to be attenuated by AR. Accordingly, AR significantly mitigated steatosis and cellular ballooning at liver histology, thereby decreasing the NALFD activity score (-30%, P < 0.05). AR also strikingly reversed IMCL accumulation either due to ageing in oxidative fibres (types 1/2a, soleus) or to HFD in glycolytic ones (types 2x/2b, extensor digitorum longus) (-50% to -85%, P < 0.05 or less). Size of subsarcolemmal lipid droplets, known to be associated with adverse metabolic outcomes, was reduced as well. Alleviation of myosteatosis resulted from improved mitochondrial function and lipid oxidation. Meanwhile, AR halved aged-related accumulation of dysfunctional proteins identified as tubular aggregates and cylindrical spirals by electron microscopy (P < 0.05).

Conclusions: Long-term AdipoRon treatment promotes 'healthy ageing' in obese middle-aged mice by enhancing endurance and protecting skeletal muscle and liver against the adverse metabolic and degenerative effects of ageing and caloric excess.

Keywords: adiponectin; ageing; endurance; intramyocellular lipids; myosteatosis; nonalcoholic fatty liver disease.


Conflict of interest statement

Authors declare that no conflict of interest exists.

Figures

Figure 1
Figure 1
Chronic administration of AdipoRon improves insulin sensitivity, endurance and enhances computed tomography (CT) scan muscle and liver densities in middle‐aged obese mice. (A) Experimental protocol. Four groups of mice were studied. Three groups were studied up to 62 weeks of age and are referred to as old (O) mice. Two of these groups received a high‐fat diet (HFD) from 8 weeks. One HFD group was orally treated with AdipoRon (AR), starting from 18 weeks (30 mg/kg/day scaled up to 50 mg/kg/day; O‐HFD + AR), while the other one was left untreated (O‐HFD). Both groups were compared with O mice kept on a normal diet (O‐ND). An additional group of young (12‐week‐old) mice under a normal diet (Y‐ND) was also used for comparison. At the indicated times, mice were submitted to treadmill exhaustion test (T) or micro‐CT. (B–D) Evolution of body weight, glycaemia and insulin resistance index during the study. (E) Mice were submitted to an uphill treadmill exhaustion test at different ages, with each time a protocol adapted to mice conditions. Endurance capacity was expressed as work to consider the differences in body weight (kg) over the distance covered (m). (F) Micro‐CT evaluation of dorsal muscle and liver density, a decrease in density reflecting fatty infiltration. Data are means ± SEM for 6 Y‐ND, and 9–12 mice in the other three groups. Statistical analysis was performed using a mixed‐effects analysis (B) or one‐way ANOVA followed by Tukey's test to compare the three groups of O mice (C–F). Comparisons between Y‐ND and O‐ND were carried out using unpaired two‐tailed t‐test. *P < 0.05, ***P < 0.001, ****P < 0.0001 versus O‐ND mice. P ≤ 0.07, # P < 0.05, ## P < 0.01, ### P < 0.001 versus O‐HFD mice.
Figure 2
Figure 2
Chronic administration of AdipoRon reduces the severity of nonalcoholic fatty liver disease (NAFLD) in middle‐aged obese mice. (A) Representative haematoxylin and eosin‐stained liver sections from the different groups of mice. Arrows indicate hepatocellular ballooning, scale bar = 50 μm. (B) Histological NAFLD activity score (NAS) calculated on sections like those shown in (A). (C) Lipid content in liver (biochemical measure). Data are means ± SEM for 6 Y‐ND, and 8–10 mice in the other three groups. Unless otherwise specified, statistical analysis was performed using one‐way ANOVA followed by Tukey's test (comparing three groups of O‐mice) or by unpaired two‐tailed t‐test (Y‐ND vs. O‐N). $$$ P < 0.001 versus Y‐ND mice. ***P < 0.001, ****P < 0.0001 versus O‐ND mice. # P < 0.05 versus O‐HFD mice.
Figure 3
Figure 3
Effects of AdipoRon on fibre type composition and lipid infiltration in soleus and EDL from middle‐aged obese mice. Fibre typing and Bodipy staining were performed on serial muscle cross‐sections in an oxidative (soleus) and a glycolytic (EDL) muscle. (A) Fibre typing was carried out by immunofluorescence staining of different myosin heavy chains isoforms (MyHCs). Type 1 fibres were labelled in blue, type 2a in green, 2x in red while 2b were nonlabelled (black). Laminin antibody was used to delineate basal membrane (white). Representative sections for each group are shown. Scale bar = 200 μm. Insets: Higher magnification of immunostaining images (scale bar = 50 μm). (B) Fibre type proportion for each muscle in the 4 groups of mice. Data are means for six mice per group. Statistical analysis was performed using one‐way ANOVA followed by Tukey's test (comparing three groups of O‐mice) or by unpaired two‐tailed t‐test (Y‐ND vs. O‐ND). $ P < 0.05 versus Y‐ND mice. (C) Bodipy staining of lipids (red) on muscle cross‐sections to quantify IMCL content on a fibre type specific‐basis. Laminin was coloured in cyan. Peripheral (subsarcolemmal, SS) lipid droplets (LDs) are usually more abundant than central ones. Arrows indicate scalloped edges of sarcolemma facing large SS LDs. Representative sections for six mice per group are shown. Scale bar = 20 μm.
Figure 4
Figure 4
AdipoRon drastically blunts diet‐ or age‐induced accumulation of intramyocellular lipids (IMCL) in middle‐aged obese mice. (A) IMCL content of soleus in peripheral and central subcellular regions in type 1 and 2a fibres stained by Bodipy and (B) IMCL content of EDL in subcellular regions in type 2x and 2b fibres. IMCL content in each region was expressed as the percentage of stained area normalized to total fibre area. Symbols for differences among central regions are in dark blue, among peripheral regions in turquoise blue, and those for the total content in black. (C) LD size in peripheral and central subcellular regions in type 1 and 2a fibres from soleus and (D) in type 2x and 2b fibres from EDL. Data are means ± SEM for five mice per group. Statistical analysis was performed using one‐way ANOVA followed by Tukey's test (comparing three groups of O‐mice) or by unpaired two‐tailed t‐test (Y‐ND vs. O‐ND). $ P < 0.05 versus Y‐ND mice. *P < 0.05, **P < 0.01 versus O‐ND mice. # P < 0.05, ## P < 0.01, ### P < 0.001 versus O‐HFD mice.
Figure 5
Figure 5
AdipoRon increases or tends to increase the expression of genes involved in fatty acid oxidation, mitochondrial biogenesis and function in soleus of middle‐aged obese mice. (A) AMPK activity and protein levels of PGC‐1α (gastrocnemius), early signalling events of the cascade leading to enhancing effects on mitochondria. (B) mRNA levels of medium‐chain acyl‐CoA dehydrogenase (Acadm) and acyl‐CoA oxidase 1 (Acox1) implicated in fatty acid oxidation and uncoupling protein 3 (Ucp3) in energy dissipation. (C) mRNA levels of nuclear respiratory factor‐1 (Nrf1), a target gene of PGC‐1α and of mitochondrial transcription factor A (Tfam). mRNA levels were normalized to cyclophilin, and the subsequent ratios presented as relative expression compared with O‐ND values. The active phosphorylated form of AMPKα (P‐AMPK) and PGC‐1α protein levels were quantified by ELISA, and absorbance data were presented as relative expression compared with O‐ND values. Data are means ± SEM for 6 Y‐ND, and 8–10 mice in the other three groups (A–C). Statistical analysis was performed by one‐way ANOVA followed by Tukey's test (comparing three groups of O‐mice) or by unpaired two‐tailed t‐test (Y‐ND vs. O‐ND). $ P < 0.05, $$ P < 0.01, $$$ P < 0.001 versus Y‐ND mice. § P = 0.059, *P < 0.05, **P < 0.01, ****P < 0.0001 versus O‐ND mice. P ≤ 0.08, # P < 0.05, #### P < 0.0001 versus O‐HFD mice.
Figure 6
Figure 6
Quantification of mitochondrial content in muscle of middle‐aged obese mice treated or not with AdipoRon. (A) Mitochondrial content was assessed by immunodetection of the translocase of outer mitochondrial membrane 20 (TOMM20) in soleus and EDL from the four groups of mice on a fibre dependent manner. Representative images for each group are shown. Scale bar = 20 μm. (B) Quantification of mitochondrial content in peripheral (subsarcolemmal) and central (intermyofibrillar) subcellular regions for each fibre type in soleus or EDL. Mitochondrial content in each region was expressed as the percentage of stained area normalized to total fibre area. Data are means ± SEM for 5–6 mice per group. Statistical analysis was performed by one‐way ANOVA (comparing three groups of O‐mice) or by unpaired two‐tailed t‐test (Y‐ND vs. O‐ND). $ P < 0.05 versus Y‐ND mice. *P < 0.05, **P < 0.01 versus O‐ND mice. Symbols for differences among central regions are in dark green, among peripheral regions in light green, and those for the total content in black. (C) Lipid droplet (LD)‐mitochondrion contacts. Left, confocal fluorescence micrographs of soleus from an O‐HFD mouse: LDs were stained with Bodipy in red, mitochondria with anti‐TOMM20 in green, the edge of the fibre with anti‐laminin in cyan and nuclei with DAPI in blue. Some mitochondria co‐localized with LDs when channels were merged. Scale bar = 10 μm. Inset: Higher magnification (scale bar = 5 μm). Right, transmission electron micrograph of rectus femoris from an O‐HFD + AR mouse illustrating LD‐mitochondrion contact. Scale bar = 1 μm (top right) and 0.25 μm (inset, bottom right).
Figure 7
Figure 7
Chronic administration of AdipoRon enhances mitochondrial function and protection in muscle of middle‐aged obese mice. (A,C) Histochemistry staining of COX and SDH activity in the rectus femoris of the four groups mice, the darkest colour being associated with the highest activity. Representative images of both stainings for each group are shown. Scale bar = 100 μm. (B,D) quantification of COX and SDH activity. Activity was expressed as the percentage of stained area normalized to the cross‐sectional area of the muscle, for each of the three staining intensities (set up as corresponding to pale, intermediate or dark colour). Data are means ± SEM for 4–6 mice per group. Statistical analysis was performed by one‐way ANOVA (comparing three groups of O‐mice) or by unpaired two‐tailed t‐test (Y‐ND vs. O‐ND). $ P < 0.05, $$ P < 0.01 versus Y‐ND mice. *P < 0.05, **P < 0.01, ***P < 0.001 versus O‐ND mice. # P < 0.05, ## P < 0.01 versus O‐HFD mice. (E) Transmission electron micrographs of mitochondria in the subsarcolemmal region of rectus femoris in the four groups of mice. For the sake of clarity, abnormal mitochondria are false‐coloured in pale green, while normal mitochondria are coloured in dark green, LDs in red and the blue line delimits the sarcolemma. Representative images of each group are shown. Scale bar = 1 μm.
Figure 8
Figure 8
Chronic administration of AdipoRon reduces aged‐related tubular aggregate (TAg) and cylindrical spiral (CS) formation in muscle of middle‐aged obese mice. (A) TAgs and CSs (indicated by arrows) appear in rectus femoris from the different groups of mice as pale or slightly basophilic inclusions with haematoxylin–eosin (HE) and bright red ones with Gomori Trichrome. Scale bars = 50 μm. (B) Confirmation of these structures by transmission electron microscopy. Scale bars = 1 μm. (C) Quantification of TAg/CS abundance expressed as the percentage of stained area (bright red inclusions) normalized to the cross‐sectional area of the muscle after Gomori trichrome. Data are means ± SEM for six mice per group. (d) Effects of AdipoRon on autophagy markers in muscle from the four groups of mice. LC3II/LC3I ratio and p62 were analysed by western blotting and the phosphorylated form (Ser555) of ULK1 by ELISA. p62 levels were normalized to Ponceau S staining (shown in Figure S4). Results were then presented as relative expression compared to O‐ND values. Data are means ± SEM for 6–10 mice per group. Statistical analysis was performed by one‐way ANOVA followed by Tukey's test (comparing three groups of O‐mice) or by unpaired two‐tailed t‐test (Y‐ND vs. O‐ND). $$$$ P < 0.0001 versus Y‐ND mice. **P < 0.01 versus O‐ND mice. ### P < 0.001 versus O‐HFD mice.

References

    1. Tieland M, Trouwborst I, Clark BC. Skeletal muscle performance and ageing. J Cachexia Sarcopenia Muscle 2018;9:3–19. - PMC - PubMed
    1. Fakhouri TH. Prevalence of obesity among older adults in the United States, 2007–2010. NCHS Data Brief 2012;106:1–8. - PubMed
    1. Tam BT, Morais JA, Santosa S. Obesity and ageing: two sides of the same coin. Obes Rev 2020;21:e12991. - PubMed
    1. Correa‐de‐Araujo R, Addison O, Miljkovic I, Goodpaster BH, Bergman BC, Clark RV, et al. Myosteatosis in the context of skeletal muscle function deficit: an Interdisciplinary Workshop at the National Institute on Aging. Front Physiol 2020;11:963. - PMC - PubMed
    1. Alqahtani SA, Schattenberg JM. NAFLD in the elderly. Clin Interv Aging 2021;16:1633–1649. - PMC - PubMed

Publication types