. 2022 Dec 13;13(1):7505.
doi: 10.1038/s41467-022-35100-z.

The sound of a Martian dust devil

Affiliations

The sound of a Martian dust devil

N Murdoch et al. Nat Commun. .

Abstract

Dust devils (convective vortices loaded with dust) are common at the surface of Mars, particularly at Jezero crater, the landing site of the Perseverance rover. They are indicators of atmospheric turbulence and are an important lifting mechanism for the Martian dust cycle. Improving our understanding of dust lifting and atmospheric transport is key for accurate simulation of the dust cycle and for the prediction of dust storms, in addition to being important for future space exploration as grain impacts are implicated in the degradation of hardware on the surface of Mars. Here we describe the sound of a Martian dust devil as recorded by the SuperCam instrument on the Perseverance rover. The dust devil encounter was also simultaneously imaged by the Perseverance rover's Navigation Camera and observed by several sensors in the Mars Environmental Dynamics Analyzer instrument. Combining these unique multi-sensorial data with modelling, we show that the dust devil was around 25 m large, at least 118 m tall, and passed directly over the rover travelling at approximately 5 m s-1. Acoustic signals of grain impacts recorded during the vortex encounter provide quantitative information about the number density of particles in the vortex. The sound of a Martian dust devil was inaccessible until SuperCam microphone recordings. This chance dust devil encounter demonstrates the potential of acoustic data for resolving the rapid wind structure of the Martian atmosphere and for directly quantifying wind-blown grain fluxes on Mars.


Conflict of interest statement

The authors declare no competing interests.

Figures

Fig. 1
Fig. 1. Acoustic data during a dusty vortex encounter.
a The pressure data during the dust devil encounter at 11.02 LTST on September 27, 2021 (Perseverance sol 215), b the SuperCam microphone sound amplitude as a function of time, c the normalised Root-Mean-Square (RMS) of the microphone signal in the 20–60 Hz bandwidth (the region containing the atmospheric signal,) calculated in 2-s windows, d the spectrogram of the microphone sound pressure level (calculated using a window size of 0.2 s in order to resolve the fine details in the acoustic data) showing the wind noise, the grain impacts and also the rover pump harmonic at 760 Hz, and the acoustic echo at ~6 kHz due to sound reflections from the base of the microphone. Source data are provided as a Source Data file.
Fig. 2
Fig. 2. Acoustic and multi-instrument recording of the direct dust devil encounter.
Data from the SuperCam microphone and the Mars Environmental Dynamics Analyzer (MEDA) instrument during the dust devil encounter. a The normalised microphone sound amplitude Root-Mean-Square (RMS) in the 20–60 Hz bandwidth calculated in 2-s windows, b the pressure data as measured by the MEDA barometer, c the atmospheric temperature at height (z) =  1.45 m as measured by the MEDA air temperature sensors (ATS) sensors, d the atmospheric temperature at the height of around 40 m as measured by the MEDA Thermal Infrared Sensor (TIRS), e the wind direction and f the wind speed as measured by the MEDA wind sensors, g the MEDA Radiation and Dust Sensor (RDS) TOP-7 sensor measurements, and h the MEDA RDS TOP-8 sensor measurements. In each of the panels, the data are shown in black and the modeling results are in red (see “Generating synthetic vortex data”), assuming the vortex parameters provided in Table 1. The time is indicated from the start of the SuperCam microphone recording. Source data are provided as a Source Data file.
Fig. 3
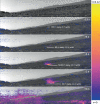
Fig. 3. The rover’s Navigation Camera (Navcam) observations of the direct dust devil encounter.
The Navcam scene (the average background image, top panel) and each dust devil image processed to dust amount (five lower panels), masking out only the truly indeterminate areas (grey). The colour scale ranges from optical depth, τ = 0 at the bottom (blue) to τ = 0.12 at the top (yellow), and is linear in between. The areas with low signal-to-noise ratio are masked out, and the images also show non-random noise (banding from instrument electronics during readout). The grid on the scene image (top panel) is 5 ° in local level azimuth and elevation; the darker grey contours are Elevation=0° and Azimuth=165°. The first dust devil image was taken at the rover spacecraft clock (SCLK) time of 686020326 s. The time indicated in the top right corners of the images is with respect to the start of the SuperCam microphone recording.
Fig. 4
Fig. 4. Dust devil trajectory.
The dust devil trajectory direction (blue dashed arrow) and size (white circles) with respect to the Perseverance rover and the local terrain at the time of the encounter. The dust devil has a trajectory coming from Azimuth (Az) = 164°, and the vortex diameter is estimated from combined data and modeling to be 25 m. The rover Navigation camera (Navcam) field of view is indicated by the pale triangle. At t1 Perseverance is in the leading vortex wall, at t2 Perseverance is inside the eye of the vortex, and at t3 Perseverance is in the tailing vortex wall. The vortex and the rover are drawn to scale. The orange arrows indicate the clockwise rotational direction of the vortex winds.
Fig. 5
Fig. 5. Identification and quantification of grain impacts.
a The pressure data during the dust devil encounter, b the spectrogram of the microphone sound amplitude calculated using a window size of 0.2 seconds in order to resolve the fine details in the acoustic data, c a histogram (gray) and cumulative histogram (orange) of the grain impacts as a function of time and, d the microphone sound amplitude time series zoomed in around 4.6 s to show the loud, very broadband, signal. Three bursts of grain impacts can be observed in both the spectrogram (b) and histogram (c). At t1 Perseverance is in the leading vortex wall, at t2 Perseverance is inside the eye of the vortex, and at t3 Perseverance is in the tailing vortex wall (see Fig. 4). Source data are provided as a Source Data file.

References

    1. Ringrose TJ, Towner MC, Zarnecki JC. Convective vortices on Mars: a reanalysis of Viking Lander 2 meteorological data, sols 1–60. Icarus. 2003;163:78–87. doi: 10.1016/S0019-1035(03)00073-3. - DOI
    1. Murphy JR, Nelli S. Mars Pathfinder convective vortices: frequency of occurrence. Geophys. Res. Lett. 2002;29:18–1-18–4. doi: 10.1029/2002GL015214. - DOI
    1. Greeley R, et al. Active dust devils in Gusev crater, Mars: observations from the Mars Exploration Rover Spirit. J. Geophys. Res. E: Planets. 2006;111:1–16. doi: 10.1029/2006JE002743. - DOI
    1. Ellehøj MD, et al. Convective vortices and dust devils at the Phoenix Mars mission landing site. J. Geophys. Res. 2010;115:E00E16.
    1. Steakley K, Murphy J. A year of convective vortex activity at Gale crater. Icarus. 2016;278:180–193. doi: 10.1016/j.icarus.2016.06.010. - DOI

Publication types