. 2022 Dec 13;13(1):7732.
doi: 10.1038/s41467-022-35461-5.

CENP-F-dependent DRP1 function regulates APC/C activity during oocyte meiosis I

Affiliations

CENP-F-dependent DRP1 function regulates APC/C activity during oocyte meiosis I

Cheng-Jie Zhou et al. Nat Commun. .

Abstract

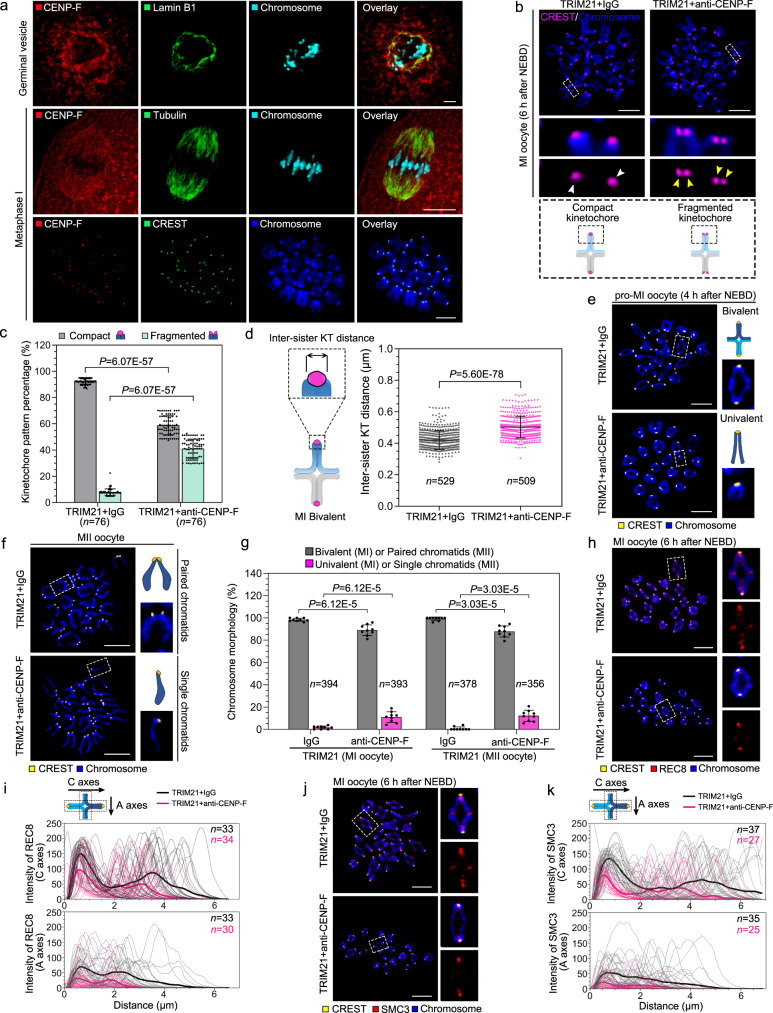
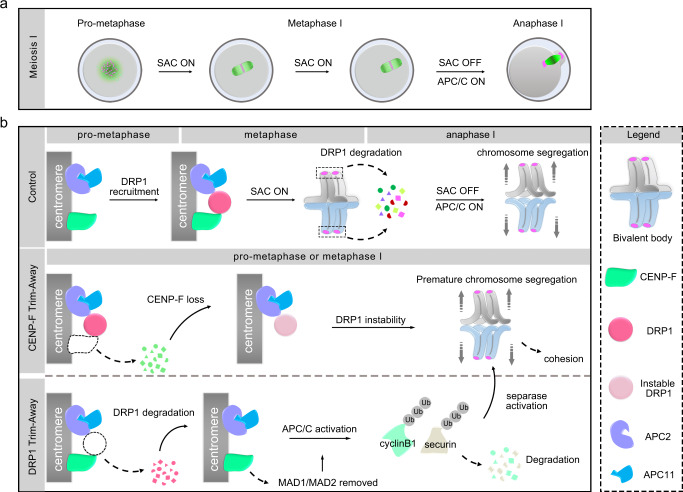
Chromosome segregation is initiated by cohesin degradation, which is driven by anaphase-promoting complex/cyclosome (APC/C). Chromosome cohesin is removed by activated separase, with the degradation of securin and cyclinB1. Dynamin-related protein 1 (DRP1), a component of the mitochondrial fission machinery, is related to cyclin dynamics in mitosis progression. Here, we show that DRP1 is recruited to the kinetochore by centromeric Centromere protein F (CENP-F) after nuclear envelope breakdown in mouse oocytes. Loss of DRP1 during prometaphase leads to premature cohesin degradation and chromosome segregation. Importantly, acute DRP1 depletion activates separase by initiating cyclinB1 and securin degradation during the metaphase-to-anaphase transition. Finally, we demonstrate that DRP1 is bound to APC2 to restrain the E3 ligase activity of APC/C. In conclusion, DRP1 is a CENP-F-dependent atypical spindle assembly checkpoint (SAC) protein that modulates metaphase-to-anaphase transition by controlling APC/C activity during meiosis I in oocytes.


Conflict of interest statement

The authors declare no competing interests.

Figures

Fig. 1
Fig. 1. CENP-F is required for the protection of chromosome cohesion during oocyte meiosis I.
a CENP-F localisation (red) during mouse oocyte meiosis. Antibodies against Lamin B1 (row 1, green) and Tubulin (row 2, green) were used to mark the nuclear envelope and spindle, respectively. bd Kinetochore configurations (b), percentages (c), and inter-sister kinetochore (KT) distance (d) in control or CENP-F-Trim MI stage oocytes. Enlarged images in (b) show representative compact (white arrows) or fragmented (yellow arrows) kinetochores. Five independent replicates were performed for (c, d). eg Chromosome configurations of pro-MI (e) and MII (f) oocyte and their occurrence after CENP-F Trim-Away (g). Enlarged images show representative bivalent or univalent chromosomes (e) or paired or single chromatids (f). Nine independent replicates were performed for (g). h MI stage oocytes were stained for REC8 (red) after CENP-F Trim-Away. Enlarged images show representative results. i Fluorescence intensity of REC8 on centromeric arms (C axes) and acentric arms (A axes) in (h) was measured. Three independent replicates were performed. j MI stage oocytes were stained for SMC3 (red) after CENP-F Trim-Away. Enlarged images show representative results. k Fluorescence intensity of SMC3 on centromeric arms (C axes) and acentric arms (A axes) in (j) was measured. Three independent replicates were performed. Chromosomes were stained with Hoechst 33342 (blue) in (a, b, e, f, h, j), and kinetochores were marked with CREST (green in (a), row 3, magenta in (b), and yellow in (e, f, h, j). Data are presented as the mean ± standard deviation (S.D.). P values were calculated based on nonparametric Kruskal–Wallis tests for (c, g), or unpaired Student’s t test (two-tailed) for (d). Black arrows in (i, k) show the measurement direction. n in graphs refers to the total number of oocytes in (c, g), kinetochores in (d), or chromosomes in (i, k), respectively. The white dotted frames in (b, e, f, h, j) indicate the region shown in detail. Scale bar, 5 μm. NEBD, nuclear envelope breakdown; MI, metaphase I; MII, metaphase II. Representative stainings from at least three independent repeats are shown. Source data are provided as a Source Data file. See also in Supplementary Fig. 1.
Fig. 2
Fig. 2. CENP-F recruits DRP1 to the kinetochores during oocyte meiosis I.
a Co-IP was performed to prove the interaction between CENP-F and DRP1. Per lysate containing 1000 oocytes was incubated with anti-CENP-F and anti-DRP1, respectively. IP eluates were used for immunoblot with anti-CENP-F and anti-DRP1, respectively. The black arrow shows the band of DRP1. b The expression plasmids of PCS2 + -eGFP-Cenp-fC, PCS2 + -eGFP-Cenp-fΔC/N or PCS2 + -eGFP-Cenp-fΔN were co-transfected with PCS2 + -cMyc-Drp1 to HEK-293 cells for 48 h, respectively. The lysates were incubated with anti-eGFP. IP eluates were used for immunoblot with anti-eGFP and anti-cMyc, respectively. One-tenth of the input cell lysates were used for immunoblot. c Co-localisation of CENP-F and DRP1 during meiosis I. Enlarged images show representative results. White arrows indicate the measurement direction of fluorescence intensity from the inner to the outer kinetochore. The distance is shown in pixel. Scale bar, 5 μm. d, e Frequency of CENP-F and DRP1 recruited to the kinetochores during meiosis I. White arrows show the measurement direction of the fluorescence intensity. If not defined, the measurement direction starts from the left of the kinetochore to the right in the enlarged images. Fluorescence intensities of CENP-F (green line), DRP1 (red line) and CREST (magenta line) are shown in line graph. The distance shows in pixel. Scale bar, 1 μm. K, kinetochores; C, CENP-F; D, DRP1. f CENP-F and DRP1 localisation on kinetochores after CENP-F or DRP1 Trim-Away. The amplified four images in row 1, row 2 and row 3 show CENP-F and DRP1 co-localised on kinetochores, CENP-F loss reduced DRP1 localisation, and unaffected CENP-F localisation after DRP1 loss, respectively. Scale bar, 5 μm. g Fluorescence intensities of DRP1 and CENPF in (f) were measured. The distance is shown in pixel. Chromosomes were stained with Hoechst 33342 (blue), and kinetochores were marked with CREST (magenta in c, d, f). n in the graphs refers to the number of kinetochores in (e, g). The white dotted frames in (c, d, f) indicate the region shown in detail. Three independent replicates were performed for (e, g). NEBD, nuclear envelope breakdown. Representative blots or stainings from at least three independent repeats are shown. Source data are provided as a Source Data file. See also in Supplementary Figs. 2–4.
Fig. 3
Fig. 3. DRP1 loss leads to SAC defects and premature chromosome separation.
a Kinetochore configurations in control or DRP1 null oocytes. White arrows indicate the compact kinetochores, and green arrows indicate the fragmented kinetochores. b The occurrence frequency of kinetochore morphology in (a) in three independent replicates. c Measurement of inter-sister kinetochore distance of MI bivalents in (a). Three independent replicates were performed. d Chromosome configurations of control or DRP1 null oocytes at MI and MII stages. Enlarged images show representative chromosomes. e The occurrence frequency of chromosome morphology in (d) in eight independent replicates. f MI stage oocyte microinjected with TRIM21 + IgG or TRIM21 + anti-DRP1 were stained for REC8 (red). Enlarged images show representative results. g Fluorescence intensity of REC8 on centromeric arms (C axes) and acentric arms (A axes) in (f) was measured, respectively. Three independent replicates were performed. h MI stage oocytes microinjected with TRIM21 + IgG or TRIM21 + anti-DRP1 were stained for SMC3 (red). Enlarged images show representative results. i Fluorescence intensity of SMC3 on centromeric arms (C axes) and acentric arms (A axes) in (h) was measured, respectively. Three independent replicates were performed. Chromosomes were stained with Hoechst 33342 (blue), and kinetochores were marked with CREST (magenta in a, d, and green in f, h). Data are presented as the mean ± standard deviation (S.D.). P values were calculated based on nonparametric Kruskal–Wallis tests for (b, e), and unpaired Student’s t test (two-tailed) for (c). Black arrows in (g, i) show the measurement direction. n in graphs refers to the number of oocytes in (b, e), kinetochores in (c) and chromosomes in (g, i), respectively. The white dotted frames in (a, d, f and h) indicate the region shown in detail. Scale bar, 5 μm. NEBD, nuclear envelope breakdown; MI, metaphase I; MII, metaphase II. Representative stainings from at least three independent repeats are shown. Source data are provided as a Source Data file.
Fig. 4
Fig. 4. DRP1 degradation is required for metaphase I to anaphase I transition.
a, b Expression (a) and intensities (b) of cell cycle related proteins during oocyte meiosis. β-Tubulin was used as the loading control. c Frequency of CENP-F and DRP1 disaggregation from the kinetochores after NEBD. Stages I–IV of anaphase were determined by the distance of homologous chromosomes after chromosome spreading. Fluorescence intensities of CENP-F (green line), DRP1 (red line) and CREST (magenta line) are shown in the line graph. Measurement direction starts from the left of the kinetochore to the right in the enlarged images. The distance is shown in pixel. d The occurrence of kinetochore types in (c) from three independent replicates. e PB1 extrusion rates in control and Drp1 mRNA injected oocytes at consecutive time points after NEBD. Drp1 mRNA was injected into oocytes 3 h after NEBD. Three independent replicates were performed. f, g PB1 extrusion rates in control, TRIM21 + IgG and TRIM21 + anti-DRP1 oocytes at consecutive time points after NEBD. The injection was performed at 2 h after NEBD (f) or at the GV stage (g). Three independent replicates were performed. hk Localisation and fluorescence intensity of MAD1 (h, i) and MAD2 (j, k) after DRP1-Trim-Away. Enlarged images show representative results. Three independent replicates were performed for (i, k). Chromosomes were stained with Hoechst 33342 (blue), and kinetochores were marked with CREST (magenta). Data are presented as the mean ± standard deviation (S.D.). P values were calculated based on nonparametric Kruskal–Wallis tests for (e, f and g), or unpaired Student’s t test (two-tailed) for (b, i and k). *P < 0.05, **P < 0.01, and ***P < 0.001. n in graphs refers to the total number of kinetochores in (d, i and k) or oocytes in (e, f and g), respectively. The white dotted frames in (c, h, and j) indicate the region shown in detail. Scale bar: 5 μm. NEBD, nuclear envelope breakdown; PB1, first polar body. Representative blots or stainings from at least three independent repeats are shown. The exact P values for (b, eg) are provided as a Source Data file. See also in Supplementary Figs. 5–7.
Fig. 5
Fig. 5. DRP1 loss leads to premature degradation of cyclinB1 and Securin.
a Premature degradation of cyclinB1 and Securin after DRP1 depletion in oocytes prior to MI stage. Per lysate contains 100 oocytes (NEBD + 6 h). β-Tubulin was used as the loading control. b, c Accumulation of cyclinB1 and Securin after DRP1 overexpression in GV stage (b) or pro-MI stage (c) oocytes. Per lysate contains 100 oocytes (NEBD + 7.5 h). β-Tubulin was used as the loading control. d, e Live-cell imaging of eGFP-cyclinB1 (d) and mCherry-Securin (e) in control or DRP1 null oocytes. Control and DRP1 null oocytes were injected with eGFP-cyclinB1 or mCherry-Securin mRNA, respectively. See also in Supplementary Movie 1–4. f, g Time-lapse fluorescence intensities of eGFP-cyclinB1 in (d) and mCherry-Securin in (e) were measured, respectively. Three independent replicates were performed. h, i Live-cell imaging of eGFP-cyclinB1 (h) and mCherry-Securin (i) in control or DRP1 overexpressed oocytes. Control and DRP1 overexpressed oocytes were injected with eGFP-cyclinB1 and mCherry-Securin mRNA, respectively. See also in Supplementary Movie 5–8. j, k Time-lapse fluorescence intensities of eGFP-cyclinB1 in (h) and mCherry-Securin in (i) were measured, respectively. Three independent replicates were performed. l, m Live-cell imaging of eGFP-cyclinB1 (l) and mCherry-Securin (m) in control or DRP1 null oocytes cultured with nocodazole. Oocytes were injected with eGFP-cyclinB1 or mCherry-Securin mRNA, and incubated in the medium containing milrinone for 2 h. Then the oocytes were released from milrinone for further maturation in the medium containing nocodazole. See also in Supplementary Movie 9–12. n, o Time-lapse fluorescence intensities of eGFP-cyclinB1 in (l) and mCherry-Securin in (m) were measured, respectively. Three independent replicates were performed. Time points after NEBD are indicated as hours: minutes in (d, e, h, i, l and m). Data are presented as the mean ± standard deviation (S.D.). n in graphs (f, g, j, k, n and o) refers to the total number of oocytes. Scale bar, 20 μm. NEBD, nuclear envelope breakdown; MI, metaphase I. Representative blots or captures from at least three independent repeats are shown. Source data are provided as a Source Data file. See also in Supplementary Fig. 8.
Fig. 6
Fig. 6. DRP1 inhibits APC/C activity by targeting APC2.
a Co-IP and immunofluorescence were performed to show the interaction between APC2 and DRP1. Chromosome spreads were stained with DRP1 (red) and APC2 (green). Chromosomes: Hoechst 33342 (blue), kinetochores: CREST (magenta). Enlarged images show representative results in the white dotted frames. Scale bar, 5 μm. b Inhibitory effect of the DRP1 on the ubiquitination mediated by APC2/11 and Ubc4 was confirmed with in vitro ubiquitination assay. Purified GST-DRP1 in dilutions of 0.0094, 0.0198, 0.0375, 0.0750, 0.1500, 0.3000 and 0.6000 μg/μl were used in the ubiquitination system. The blots were incubated with anti-FLAG (Ub) and anti-DRP1, respectively. c Inhibitory effect of the DRP1 on the ubiquitination mediated by APC2/11 and UbcH5 was confirmed with in vitro ubiquitination assay. Purified GST-DRP1 in dilutions of 0.0375, 0.0750, 0.1500, 0.3000 and 0.6000 μg/μl were used in the ubiquitination system. The blots were incubated with anti-FLAG (Ub) and anti-DRP1, respectively. d, e Live-cell imaging of eGFP-cyclinB1 and mCherry-Securin in oocytes injected with Apc2 mRNA or Apc2 + Drp1 mRNA. Control, APC2 or APC2 + DRP1 overexpressed oocytes were injected with eGFP-cyclinB1 (d) and mCherry-Securin (e) mRNA, respectively. Time points after NEBD are indicated as hours: minutes. Scale bar, 20 μm. See also in Supplementary Movie 13–18. f, g Time-lapse fluorescence intensities of eGFP-cyclinB1 (d) and mCherry-Securin (e) were measured, respectively. n refers to the number of oocytes from three independent replicates. Data are presented as the mean ± standard deviation (S.D.). h APC/C defects inhibit premature degradation of cyclinB1 and Securin in DRP1-depleted oocytes. Apc2 siRNA or proTAME was used to inhibit APC/C activity. Per lysate contains 150 oocytes (NEBD + 6 h). β-Tubulin was used as the loading control. i Ubiquitination levels in control, APC2 and APC2 + DRP1 overexpressed oocytes were detected with western blot. The blots were probed with anti-ubiquitin and anti-cMyc, respectively. β-Tubulin was used as the loading control. NEBD, nuclear envelope breakdown. Representative blots, stainings, or captures from at least three independent repeats are shown. Source data are provided as a Source Data file. See also in Supplementary Fig. 9.
Fig. 7
Fig. 7. Scheme showing DRP1 regulation of metaphase-to-anaphase transition during oocyte meiosis I.
a SAC and APC/C regulate mouse oocyte meiotic progression. b Centromeric DRP1 is a CENP-F-dependent key regulator in maintaining SAC activity by targeting APC2 to control anaphase entry.

References

    1. Mihajlovic AI, FitzHarris G. Segregating chromosomes in the mammalian oocyte. Curr. Biol. 2018;28:R895–R907. doi: 10.1016/j.cub.2018.06.057. - DOI - PubMed
    1. Sun SC, Kim NH. Spindle assembly checkpoint and its regulators in meiosis. Hum. Reprod. Update. 2012;18:60–72. doi: 10.1093/humupd/dmr044. - DOI - PubMed
    1. Lara-Gonzalez P, Westhorpe FG, Taylor SS. The spindle assembly checkpoint. Curr. Biol. 2012;22:R966–R980. doi: 10.1016/j.cub.2012.10.006. - DOI - PubMed
    1. Overlack K, et al. BubR1 promotes Bub3-dependent APC/C inhibition during spindle assembly checkpoint signaling. Curr. Biol. 2017;27:2915–2927 e2917. doi: 10.1016/j.cub.2017.08.033. - DOI - PMC - PubMed
    1. Kapanidou M, Curtis NL, Bolanos-Garcia VM. Cdc20: at the crossroads between chromosome segregation and mitotic exit. Trends Biochem. Sci. 2017;42:193–205. doi: 10.1016/j.tibs.2016.12.001. - DOI - PubMed

Publication types