. 2022 Dec 13;13(1):7729.
doi: 10.1038/s41467-022-35319-w.

Spatial transcriptomics landscape of lesions from non-communicable inflammatory skin diseases

Affiliations

Spatial transcriptomics landscape of lesions from non-communicable inflammatory skin diseases

A Schäbitz et al. Nat Commun. .

Abstract

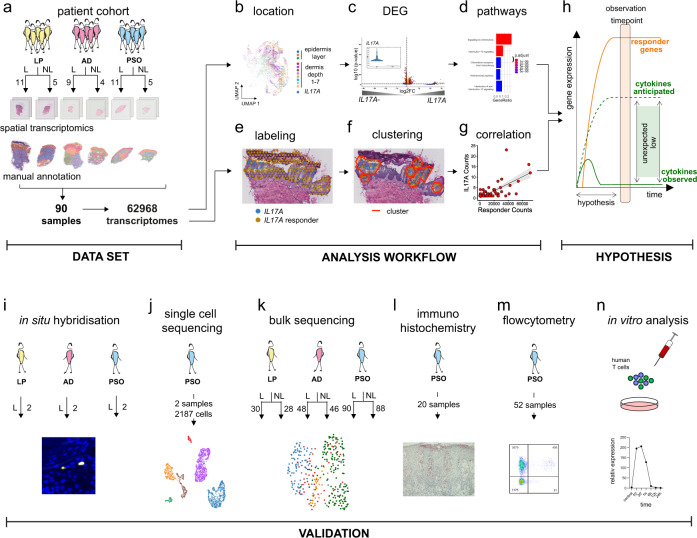
Abundant heterogeneous immune cells infiltrate lesions in chronic inflammatory diseases and characterization of these cells is needed to distinguish disease-promoting from bystander immune cells. Here, we investigate the landscape of non-communicable inflammatory skin diseases (ncISD) by spatial transcriptomics resulting in a large repository of 62,000 spatially defined human cutaneous transcriptomes from 31 patients. Despite the expected immune cell infiltration, we observe rather low numbers of pathogenic disease promoting cytokine transcripts (IFNG, IL13 and IL17A), i.e. >125 times less compared to the mean expression of all other genes over lesional skin sections. Nevertheless, cytokine expression is limited to lesional skin and presented in a disease-specific pattern. Leveraging a density-based spatial clustering method, we identify specific responder gene signatures in direct proximity of cytokines, and confirm that detected cytokine transcripts initiate amplification cascades of up to thousands of specific responder transcripts forming localized epidermal clusters. Thus, within the abundant and heterogeneous infiltrates of ncISD, only a low number of cytokine transcripts and their translated proteins promote disease by initiating an inflammatory amplification cascade in their local microenvironment.


Conflict of interest statement

The authors declare no competing interests.

Figures

Fig. 1
Fig. 1. The study design highlighting the spatial transcriptomic dataset, the analysis pipeline, and the validation cohorts and techniques.
a ST dataset consisting of 90 spatial samples (31 patients) 62 lesional samples, 28 non-lesional samples, and three ncISD (lichen planus (LP), atopic dermatitis (AD), psoriasis (Pso)) resulting in 62,968 transcriptomes. Within the analysis workflow, every spot in all samples was manually annotated according to tissue localization (basal-, middle-, upper epidermis, dermis depth 1-7). b Leukocyte-positive spots were defined by the expression of either CD2, CD3D, CD3E, CD3G, CD247 (CD3Z), or PTPRC (CD45) or combinations of markers and cytokine transcript-positive leukocytes were assigned to a tissue localization. c Differential gene expression (DEG) analysis was performed on cytokine transcript-positive versus cytokine transcript-negative leukocyte spots, followed by (d) pathway enrichment analysis. For spatial correlation of cytokine transcript-positive leukocyte spots with cytokine responder genes: (e) spots were labeled as cytokine or responder positive, (f) clusters of cytokines and responders were defined, and (g) correlation analysis was performed. h Hypothesis expecting higher cytokine mRNA counts than observed. General low expression of cytokine transcripts in ncISD was confirmed using (i) in situ hybridization, (j) single-cell sequencing, (k) bulk sequencing, (l) immunohistochemistry, (m) flow cytometry, and (n) in vitro stimulation of human T cells.
Fig. 2
Fig. 2. Low numbers of disease-driving cytokine transcripts are expressed in lesional skin of ncISD.
a Representative ST sections for psoriasis with IL17A-, AD with IL13, and LP with IFNG transcript-positive spots (Ø55µM). b, d UMI-counts of IFNG (white), IL13 (dark grey) and IL17A (black) expressed in the manually annotated tissue layers ‘upper, middle, and basal epidermis’ and ‘dermis depth 1-7’ in non-lesional (b) and lesional skin (d) of all investigated samples (n = 82). GAPDH serves as a housekeeping gene (HkG) (light grey). c, e Total cytokine (IFNG (white), IL13 (dark grey) and IL17A (black)) and GAPDH (light grey) UMI counts in all non-lesional (c) and lesional (e) skin sections. f In situ hybridization for IFNG, IL13 and IL17A in representative stainings of LP (upper left panel), AD (upper right panel) and psoriasis (lower panel). Scale bar indicates 500 µm; red circles represent the size of a spot (Ø 55 µm) and indicate the positivity for cytokine mRNA. g Quantification of cytokine-positive cells per in situ section. Given are IFNG transcript-positive cells in LP (n = 5), IL13 transcript-positive cells in AD (n = 3) and IL17A transcript-positive cells in psoriasis (n = 5). hj scRNA-seq analysis of psoriasis biopsies (n = 2, 2187 cells) indicating the UMI count of IFNG (178 cells), IL13 (9 cells), and IL17A (61 cells) per cell in CD4 or CD8 co-expressing cells. km Bulk sequencing analysis of non-lesional and lesional LP (n = 30) (IFNG), AD (n = 48) (IL13), and psoriasis (n = 90) (IL17A) biopsies indicating the total UMI counts for IFNG, IL13, and IL17A, respectively, in each biopsy. np UMI counts for IFNG, IL13, and IL17A in ST sections separated by disease (each dot represents one section) (LP n = 22, AD n = 18, Pso n = 18). Statistical significance was determined using One-Way Anova and Turkey’s multiple comparisons test without FDR correction. **<0.01, ***<0.001. q Percentage of disease relevant cytokines in LP, AD, and psoriasis normalised to 100%. LP lichen planus, AD atopic dermatitis.
Fig. 3
Fig. 3. IL17A transcript-positive leukocyte spots are characterized by Th17 markers and IL17A tissue response genes.
a UMAP (Uniform Manifold Approximation and Projection) plot showing the distribution of spots within the analyzed diseases AD, LP and Pso and non-lesional (NL) skin. b ST spots expressing IL17A transcripts and leukocyte marker genes and their location in epidermis or dermis. IL17A-positive spots are highlighted in blue. c Volcano plot analysing the gene expression profile of IL17A transcript-positive leukocyte (IL17A+) versus IL17 transcript-negative leukocyte (IL17A-) spots. Coordinates for IL17A (38.4/168.3) are not shown. Benjamini–Hochberg was used to determine statistical significance. d Violin plots of selected genes in IL17A transcript-positive leukocyte (IL17A+) and IL-17A transcript-negative leukocyte (IL17A-) spots indicate the expression of gold standard genes. e Pathway enrichment analysis of genes co-expressed with IL17A in spatial spots. LP lichen planus, AD atopic dermatitis, Pso psoriasis, ST spatial transcriptomics.
Fig. 4
Fig. 4. Cytokine transcript-positive single cells express immune cell derived genes, but no tissue markers.
a UMAP (Uniform Manifold Approximation and Projection) plot indicating the composition of cellular clusters in the single-cell (sc) RNASeq dataset derived from psoriasis patients. b scRNA-seq analysis of psoriasis skin highlighting IL17A expression in lymphocytes (blue) in a UMAP plot. c Volcano plot analysing differentially expressed genes (DEG) in IL17A positive (IL17A+) versus IL17A negative (IL17A-) leukocytes in the scRNASeq dataset of psoriasis. Benjamini–Hochberg was used to determine statistical significance.
Fig. 5
Fig. 5. Immune response is spatially correlated with cytokine transcript number.
AC Weighted Spearman correlation between overall cytokine transcripts and responder transcripts per whole tissue slice in the epidermis. Each point in the plot represents the sum of all cytokine- and responder transcripts in a tissue sample. The size of the points represents the number of observed cytokines on a tissue slice. D Representative tissue slice of psoriasis showing IL17A expression in relation to its responder signature and different radiuses around the IL17A-positive leukocyte spot (Ø55µM). The filling of each circle represents the UMI counts according to the scale on the right capped at 800 UMI-counts for either responder genes (yellow circle) or cytokine transcripts (blue circle for IL17A). Red lines connect neighboring IL17A transcript-positive spots that together with the surrounding responder gene positive spots create a cluster highlighted by a black line. E Weighted Spearman correlation values for IFNG (orange), IL13 (red), and IL17A (blue) depending on the radius from the cytokine transcript-positive leukocyte spot. Strongest correlations for each cytokine are indicated with a circle. Triangles and circles indicate correlations with p-values smaller and larger than 0.05, respectively. FH Spatial weighted Spearman correlation incorporating the spatial relation of cytokines and their response located in the epidermis. Shown is the radius for each cytokine with the highest correlation value. This is radius of 4 for IFNG, radius of 3 for IL13 and radius of 0 for IL17A. Each point in the plots represents the sum of the counts of each cytokine and its responders in a cluster and the size of each point represents the number of cytokine transcripts in a cluster. The color of each spot is associated with the corresponding epidermis layer. Significance in AC and FH was determined by two-sided p-value, the line was calculated using the ordinary least square model, the shaded area indicates the 95% confidence interval.

References

    1. Eyerich K, Eyerich S. Immune response patterns in non-communicable inflammatory skin diseases. J. Eur. Acad. Dermatol Venereol. 2018;32:692–703. doi: 10.1111/jdv.14673. - DOI - PMC - PubMed
    1. Gudjonsson JE, Kabashima K, Eyerich K. Mechanisms of skin autoimmunity: cellular and soluble immune components of the skin. J. Allergy Clin. Immunol. 2020;146:8–16. doi: 10.1016/j.jaci.2020.05.009. - DOI - PubMed
    1. Boehncke WH, Schon MP. Psoriasis. Lancet. 2015;386:983–994. doi: 10.1016/S0140-6736(14)61909-7. - DOI - PubMed
    1. Eyerich S, et al. Mutual antagonism of T cells causing psoriasis and atopic eczema. N. Engl. J. Med. 2011;365:231–238. doi: 10.1056/NEJMoa1104200. - DOI - PubMed
    1. Langan SM, Irvine AD, Weidinger S. Atopic dermatitis. Lancet. 2020;396:345–360. doi: 10.1016/S0140-6736(20)31286-1. - DOI - PubMed

Publication types