. 2022 Dec 13;13(1):7722.
doi: 10.1038/s41467-022-35370-7.

Condensates formed by prion-like low-complexity domains have small-world network structures and interfaces defined by expanded conformations

Affiliations

Condensates formed by prion-like low-complexity domains have small-world network structures and interfaces defined by expanded conformations

Mina Farag et al. Nat Commun. .

Abstract

Biomolecular condensates form via coupled associative and segregative phase transitions of multivalent associative macromolecules. Phase separation coupled to percolation is one example of such transitions. Here, we characterize molecular and mesoscale structural descriptions of condensates formed by intrinsically disordered prion-like low complexity domains (PLCDs). These systems conform to sticker-and-spacers architectures. Stickers are cohesive motifs that drive associative interactions through reversible crosslinking and spacers affect the cooperativity of crosslinking and overall macromolecular solubility. Our computations reproduce experimentally measured sequence-specific phase behaviors of PLCDs. Within simulated condensates, networks of reversible inter-sticker crosslinks organize PLCDs into small-world topologies. The overall dimensions of PLCDs vary with spatial location, being most expanded at and preferring to be oriented perpendicular to the interface. Our results demonstrate that even simple condensates with one type of macromolecule feature inhomogeneous spatial organizations of molecules and interfacial features that likely prime them for biochemical activity.


Conflict of interest statement

R.V.P. is a member of the Scientific Advisory Board of Dewpoint Therapeutics. The work reported here was not influenced by this affiliation. The remaining authors declare no competing interests.

Figures
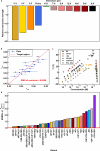
Fig. 1
Fig. 1. Setup and assessment of the computational model.
a Pairwise interaction strengths used in the computational model. Amino acids are referred to by single-letter codes. “X” is used to indicate any amino acid for which a specific interaction is not defined. “Aro” is used to indicate either tyrosine or phenylalanine. Contact energies for Y-Y, Y-F, F-F, R-Aro, K-X, and X-X were parameterized using Gaussian process Bayesian optimization (GPBO; see supplemental material and Supplementary Fig. 1). All other energies were parameterized by matching experimental and computational phase diagrams of “spacer” variants (see Supplementary Methods). b Rg values scale with chain length according to the relation Rg ~ Nν. Here, ν is actually an apparent scaling exponent νapp, that is sequence specific, and is extracted from SEC-SAXS data using the approach developed by Riback et al.. We compare values of ν obtained by fitting SEC-SAXS data to a molecular form factor (νexp) to those obtained from single-chain LaSSI simulations (νsim) and use GPBO to parameterize a computational model. Each data point corresponds to a unique A1-LCD variant. The red dashed line represents the regime where νexp = νsim, and the root mean squared error is calculated using the residuals from this line. Vertical error bars representing the standard error about the mean across five replicates are smaller than the markers. Horizontal error bars represent the uncertainty from fitting the SAXS data to molecular form factors. c Calculated coexistence curves or binodals (solid markers) of various A1-LCD variants plotted alongside experimentally derived binodals (open markers). Temperature and concentration are converted from simulation units to Kelvin and molar units, respectively, using the scaling factors of Martin et al.. Error bars represent standard errors from the mean across 3 replicates. d ERMSL (see Supplementary Methods) comparing experimentally measured (csat,exp) and computationally derived (csat,sim) saturation concentrations. Source data are provided as a Source Data file.
Fig. 2
Fig. 2. Comparison of conformations within dense vs. dilute phases.
a Rg of chains in the dilute (blue) and dense phase (red) derived from condensates of the wild-type A1-LCD plotted against the width of the two-phase regime (see text). b A schematic depicting how intramolecular sticker-sticker interactions promote chain compaction in the dilute phase, whereas distinct intermolecular sticker-sticker interactions promote chain expansion in the dense phase. Here, each chain is depicted as a flexible tail of distinct color. c Swelling ratio, which quantifies the degree of expansion of chains in the dense phase relative to the dilute phase, is plotted against the width of the two-phase regime for all A1-LCD variants in this study. The datapoints collapse onto a single exponential curve (solid red curve; see Methods for fitting model and parameters). Error bars represent standard errors about the mean across 3 replicates. l.u. is lattice units. Source data are provided as a Source Data file.
Fig. 3
Fig. 3. The interiors of condensates form small-world network structures.
a, b Representative graphs for the largest connected cluster at the largest (a) and smallest (b) absolute value of ω (as defined in Fig. 2). As ω approaches zero, the system approaches the critical point. Results are shown here from analyses of simulations for the wild-type A1-LCD. The nodes represent individual molecules and are colored according to their betweenness centralities as defined in Eq. (2). Two chains are connected by an undirected edge if any two stickers between them are within 3units on the cubic lattice. c The betweenness centrality distribution for chains with degree 24 at the lowest value of ω, −4.5, for the WT A1-LCD. 920 samples were used to generate the distribution. d The pairwise distance distributions of the 5% of chains with the highest betweenness centralities at various ω values for the WT A1-LCD. In each violin plot, the tails extend to the minimum and maximum values, and the median is annotated. Each violin plot is created using 1.35 × 105 data points. e, f the average path length, L (e), and the average clustering coefficient, C (f), for a diverse set of 7 constructs, including the WT A1-LCD. The values shown here are normalized by the corresponding Erdős-Rényi values for random graphs. The dashed horizontal line represents the values that would be expected assuming an Erdős-Rényi model. The error bars represent the standard deviation about the mean across 10 replicates for the WT, 5 replicates for the FUS-LCD, and 3 replicates for all other sequences. Source data are provided as a Source Data file.
Fig. 4
Fig. 4. Interfaces of condensates have distinctive conformational characteristics.
a A representative radial density plot of a simulation of the wild-type A1-LCD at ω = −3.38. The solid red curve corresponds to a logistic fit to the data (see Methods). b The width of the condensate interface versus temperature for simulations of homopolymers at different lengths. c Average number of sticker-sticker crosslinks per sticker plotted against the distance from the condensate center-of-mass for wild-type A1-LCD at ω = −3.38. Depicted are the total number of crosslinks (blue), the number of intramolecular crosslinks (orange), and the number of intermolecular crosslinks (green). d Average Rg of a chain plotted against the distance from the condensate center-of-mass for the wild-type A1-LCD at ω  = −3.38. e Average distance between residues on the same chain that are separated by exactly five residues plotted against the distance from the condensate center-of-mass of one of the residues for the wild-type A1-LCD at ω = −3.38. f Average asphericity of chains plotted against the distance from the condensate center-of-mass for the wild-type A1-LCD at ω = −3.38. Values of asphericity that are larger than 0.4 point to cigar-shaped conformations, at least on the local level. The distinction of chain dimensions across the dilute, dense, and interfacial regions disappears as the critical temperature is approached. In panels a, c, d, e, and f, the translucent green rectangles represent the interfacial region as determined by the logistic fit and the error bars signify standard errors about the mean across 3 replicates. In panel b, error bars represent standard errors about the mean across 10 replicates. l.u. is lattice units. Source data are provided as a Source Data file.
Fig. 5
Fig. 5. At the interface, molecules have non-random, perpendicular orientations.
a A diagram depicting how distinct chains per residue is calculated. The region enclosed by the dashed red curves indicates the radial shell of interest. Any chains that contain beads within the radial shell are colored blue. Any beads that are within the radial shell are colored orange. All other chains are colored black. To calculate the distinct chains per residue, the number of blue chains is divided by the number of orange beads, in this case 8 and 24, giving a parameter value of 0.33. This parameter can vary between 0 and 1. Lower values suggest that chains are wrapped around a radial shell, whereas higher values suggests that chains are oriented perpendicular to a radial shell. b Average distinct chains per residue plotted against the distance from the condensate center-of-mass for the wild-type A1-LCD at ω = −3.38. c A diagram depicting how the parameter cos2θ is calculated. Here, θ is defined as the angle swept out by a line segment (translucent dashed red line) between the first and last beads of a chain and a line segment (opaque dashed red line) between one of the beads and the condensate center. Chain 1 (blue polymer) is oriented more perpendicular to the condensate interface. Therefore, θ1 is close to 180° and cos2θ1 ≈ 1. Conversely, chain 2 (orange polymer) is tangential to the interface, such that θ2 is close to 90°, and cos2θ2 ≈ 0. In general, lower values of cos2θ suggest that chains are wrapped around a radial shell, whereas higher values suggest that chains are oriented perpendicular to a radial shell. d Average cos2θ plotted against the distance from the condensate center-of-mass for the wild-type A1-LCD at ω=−3.38. As the critical temperature is approached, the orientational differences across distinct regions vanish. Translucent green rectangles in b and d represent the interfacial region determined by the logistic fit in Fig. 4a. Error bars signify standard errors about the mean across three replicates and l.u. is lattice units. Source data are provided as a Source Data file.
Fig. 6
Fig. 6. Molecular properties of interfaces are distinct from dilute and dense phases.
Diagram summarizing our findings concerning condensate organization. Region I is the dilute phase, Region II is the condensate interface, and Region III is the interior of a condensate. Region I is characterized by relatively compact chains that form few intermolecular contacts. Region II is characterized by relatively expanded chains that are oriented perpendicular to the interface and form the fewest number of total sticker crosslinks. Region III is characterized by chains that are less compact than those in Region I and less expanded than those in Region II. These chains form numerous intermolecular sticker crosslinks, giving rise to a small-world percolated network.

References

    1. Banani, S. F., Lee, H. O., Hyman, A. A. & Rosen, M. K. Biomolecular condensates: organizers of cellular biochemistry. Nat. Rev. Mol. cell Biol.18, 285–298 (2017). - PMC - PubMed
    1. Shin, Y. & Brangwynne, C. P. Liquid phase condensation in cell physiology and disease. Science357, eaaf4382 (2017). - PubMed
    1. Brangwynne, C. P. et al. Germline P granules are liquid droplets that localize by controlled dissolution/condensation. Science324, 1729–1732 (2009). - PubMed
    1. Li, P. et al. Phase transitions in the assembly of multivalent signalling proteins. Nature483, 336–340 (2012). - PMC - PubMed
    1. Choi, J.-M., Holehouse, A. S. & Pappu, R. V. Physical principles underlying the complex biology of intracellular phase transitions. Annu. Rev. Biophysics49, 107–133 (2020). - PMC - PubMed

Publication types