. 2022 Dec 13;12(1):21527.
doi: 10.1038/s41598-022-25722-0.

Ocular surface microbiome in diabetes mellitus

Affiliations

Ocular surface microbiome in diabetes mellitus

Orathai Suwajanakorn et al. Sci Rep. .

Abstract

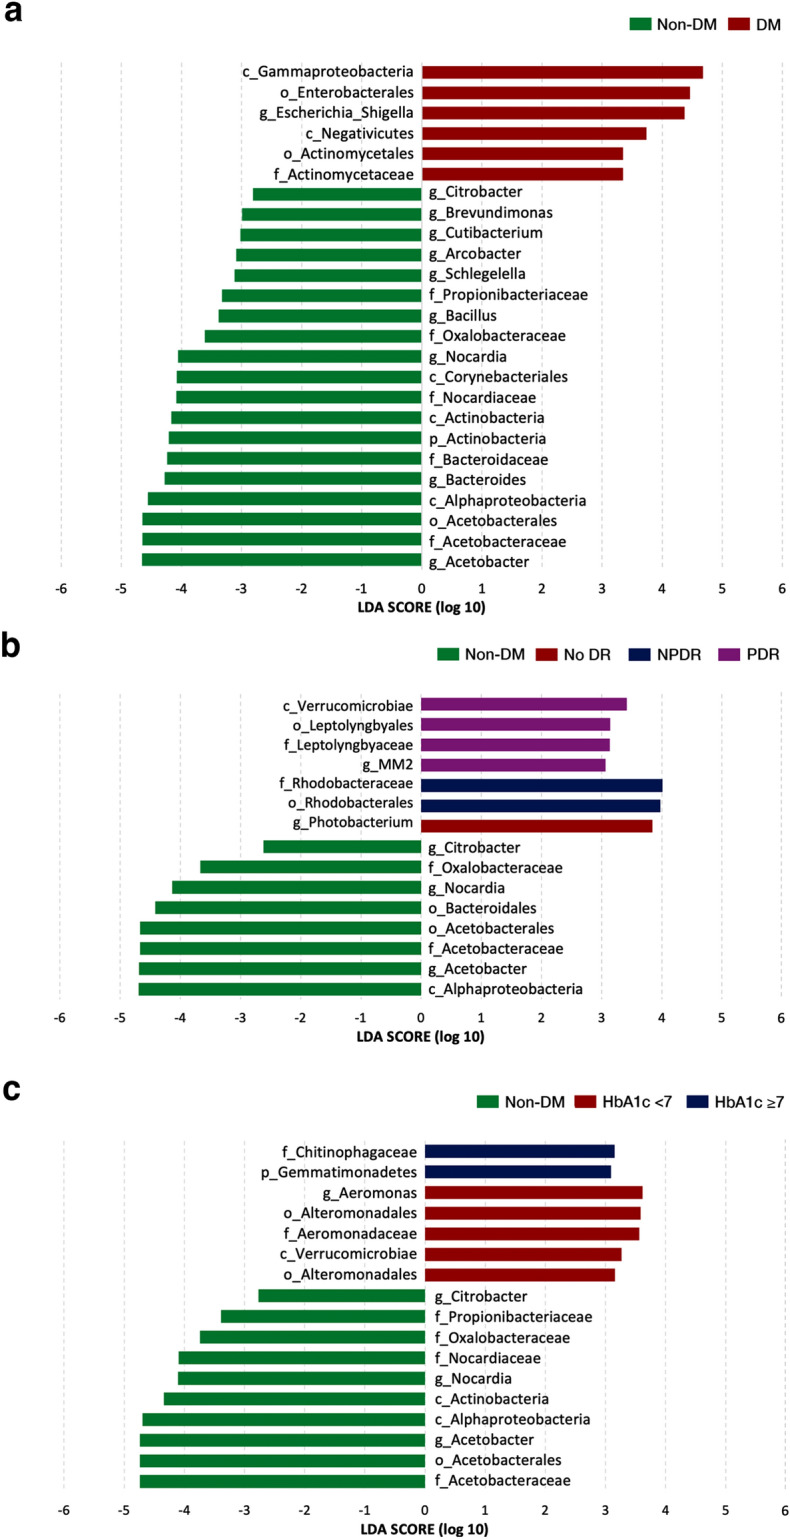
This cross-sectional, age- and gender-matched study included 20 eyes of non-diabetic subjects (non-DM group) and 60 eyes of type 2 diabetes mellitus (DM group). Subgroups of DM were classified by diabetic retinopathy (DR) staging into no DR (DM-no DR), non-proliferative DR (DM-NPDR), proliferative DR (DM-PDR), and by glycemic control (well-controlled DM; HbA1c < 7%, poorly controlled DM; HbA1c ≥ 7%). Conjunctival swabs were performed for ocular surface microbiome analysis using conventional culture and next-generation sequencing analysis (NGS). A higher culture-positive rate was found in DM (15%) than in non-DM group (5%) (p value = 0.437). Pathogenic organisms and antibiotic-resistant strains were detected in the DR groups (DM-NPDR and DM-PDR). The NGS analysis showed that potentially pathogenic bacteria such as Enterobacteriaceae, Neisseriaceae, Escherichia-Shigella, and Pseudomonas predominated in DM, especially in DR. There was dissimilarity in the ocular surface microbiome between DM and non-DM groups. The subgroup analysis showed that the DR group had significantly different microbial community from DM-no DR and non-DM groups (p value < 0.05). The microbial community in the poorly controlled DM was also significantly different from well-controlled DM and non-DM groups (p < 0.001). Using the NGS method, our study is the first to signify the importance of DR and glycemic control status, which affect the changes in the ocular surface microbiome.


Conflict of interest statement

The authors declare no competing interests.

Figures

Figure 1
Figure 1
Taxonomic composition (a) Top 15 bacteria in phylum and genus levels of the ocular surface microbiome in the non-DM and DM groups. (b) Comparison of top 5 phyla between the non-DM and DM groups. (c) Comparison of top 10 genera between the non-DM and DM groups, (d) between the non-DM and DM subgroups classified by DR staging, and (e) between the non-DM and DM subgroups classified by glycemic control. *p value < 0.05; **p value < 0.001. (Abbreviations: DM diabetes mellitus, Non-DM non-diabetes mellitus, No DR  no diabetic retinopathy, NPDR non-proliferative diabetic retinopathy, PDR  proliferative diabetic retinopathy, HbA1c hemoglobin A1c).
Figure 2
Figure 2
Linear discriminant analysis effect size (LEfSe) represents the significant difference in bacterial distribution between groups. Bacterial taxa with LDA scores greater than 2 were considered significant. (a) Comparison of taxa lists between the non-DM and DM groups. (b) Comparison of taxa lists between the non-DM and DM subgroups classified by DR staging. (c) Comparison of taxa lists between the non-DM and DM subgroups classified by glycemic control. (Abbreviations: p phylum, c class, o order, f family, and g genus, DM diabetes mellitus, Non-DM non-diabetes mellitus, No DR no diabetic retinopathy, NPDR non-proliferative diabetic retinopathy, PDR proliferative diabetic retinopathy, HbA1c hemoglobin A1c).
Figure 3
Figure 3
This figure represents beta-diversity between groups by principal coordinate analysis (PCoA) plot based on unweighted UniFrac distance and comparison of ocular surface microbiome between groups (box plot): (a) between the non-DM (green-dotted circle) and DM groups (red-dotted circle); (b) between the non-DM (green-dotted circle) and DM subgroups classified by the DR staging (no DR: red-dotted circle, NPDR: blue-dotted circle, and PDR: purple-dotted circle); and (c) between the non-DM (green-dotted circle) and DM subgroups classified by the glycemic control (HbA1c < 7%: red-dotted circle, HbA1c ≥ 7%: blue-dotted circle) (*p value < 0.05; **p value < 0.001). (Abbreviations: DM diabetes mellitus, Non-DM non-diabetes mellitus, No DR no diabetic retinopathy, NPDR non-proliferative diabetic retinopathy, PDR proliferative diabetic retinopathy, HbA1c hemoglobin A1c).

References

    1. Saeedi P, et al. Global and regional diabetes prevalence estimates for 2019 and projections for 2030 and 2045: Results from the International Diabetes Federation Diabetes Atlas, 9(th) edition. Diabetes Res. Clin. Pract. 2019;157:107843. doi: 10.1016/j.diabres.2019.107843. - DOI - PubMed
    1. Aguirre, F., Brown, A., Cho, N. H., Dahlquist, G., Dodd, S., Dunning, T. et al. IDF Diabetes Atlas: Sixth edition. Sixth ed. IDF, 160 p (2013).
    1. Gao Y, et al. Ocular surface changes in type II diabetic patients with proliferative diabetic retinopathy. Int. J. Ophthalmol. 2015;8:358–364. doi: 10.3980/j.issn.2222-3959.2015.02.26. - DOI - PMC - PubMed
    1. Vieira-Potter VJ, Karamichos D, Lee DJ. Ocular complications of diabetes and therapeutic approaches. Biomed. Res. Int. 2016;2016:3801570. doi: 10.1155/2016/3801570. - DOI - PMC - PubMed
    1. Richdale K, Chao C, Hamilton M. Eye care providers' emerging roles in early detection of diabetes and management of diabetic changes to the ocular surface: A review. BMJ Open Diabetes Res Care. 2020 doi: 10.1136/bmjdrc-2019-001094. - DOI - PMC - PubMed

Publication types

Substances