. 2023 Jan;20(1):94-109.
doi: 10.1038/s41423-022-00959-x. Epub 2022 Dec 14.

RANKL-responsive epigenetic mechanism reprograms macrophages into bone-resorbing osteoclasts

Affiliations

RANKL-responsive epigenetic mechanism reprograms macrophages into bone-resorbing osteoclasts

Seyeon Bae et al. Cell Mol Immunol. 2023 Jan.

Abstract

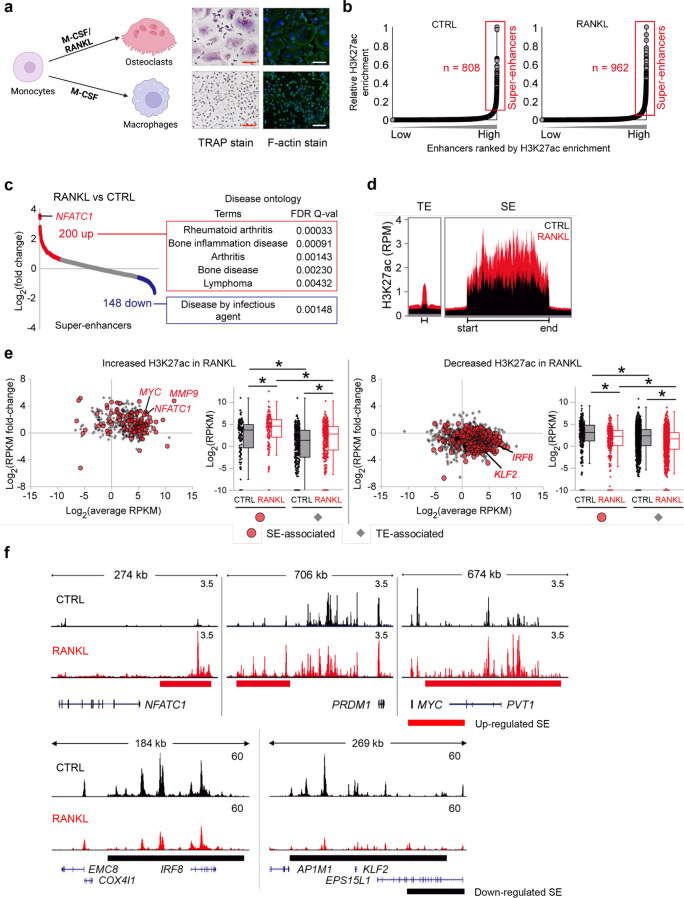
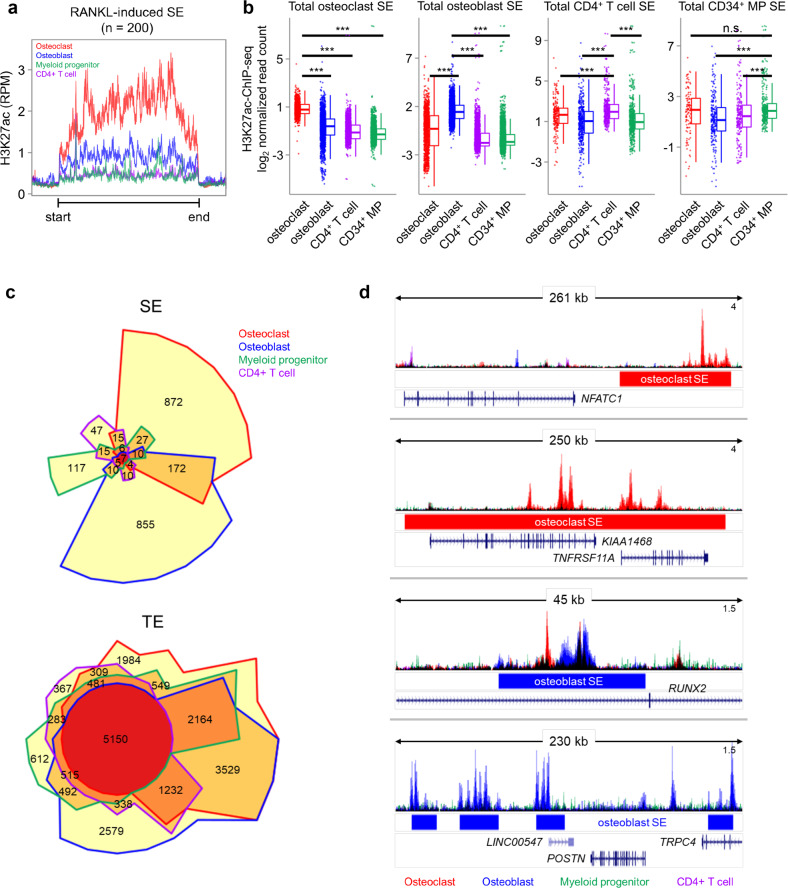
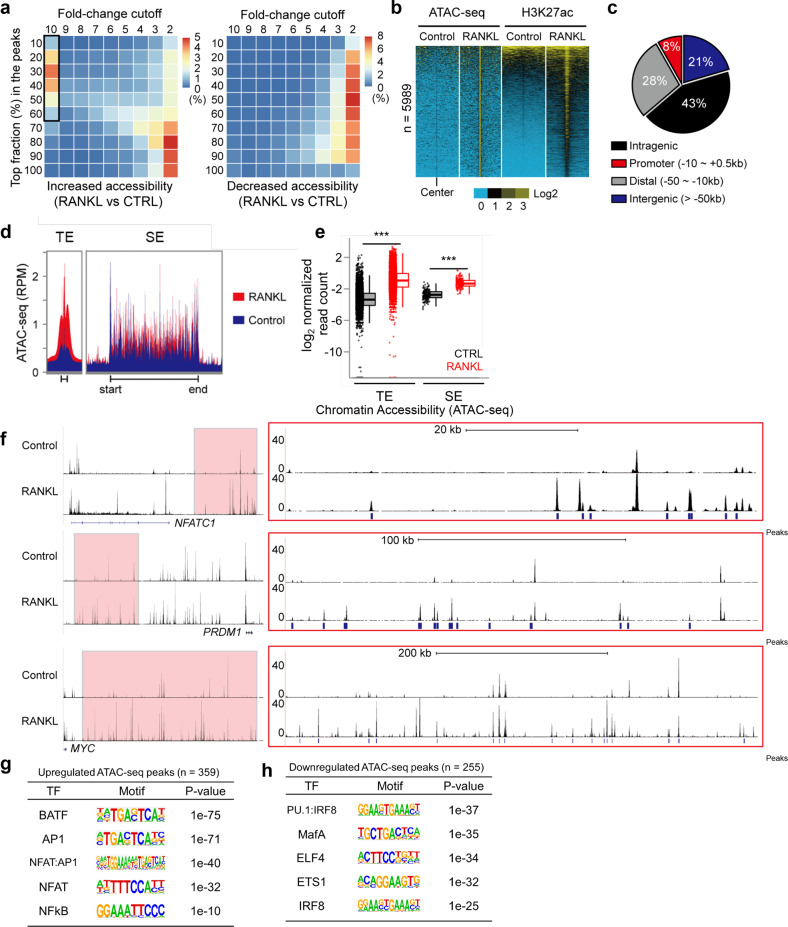
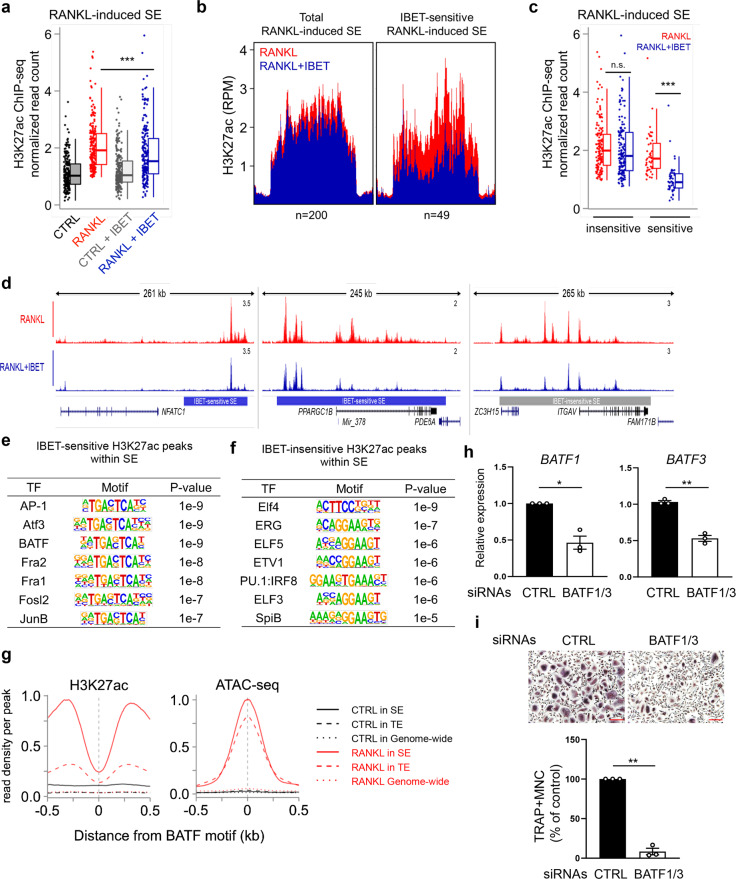
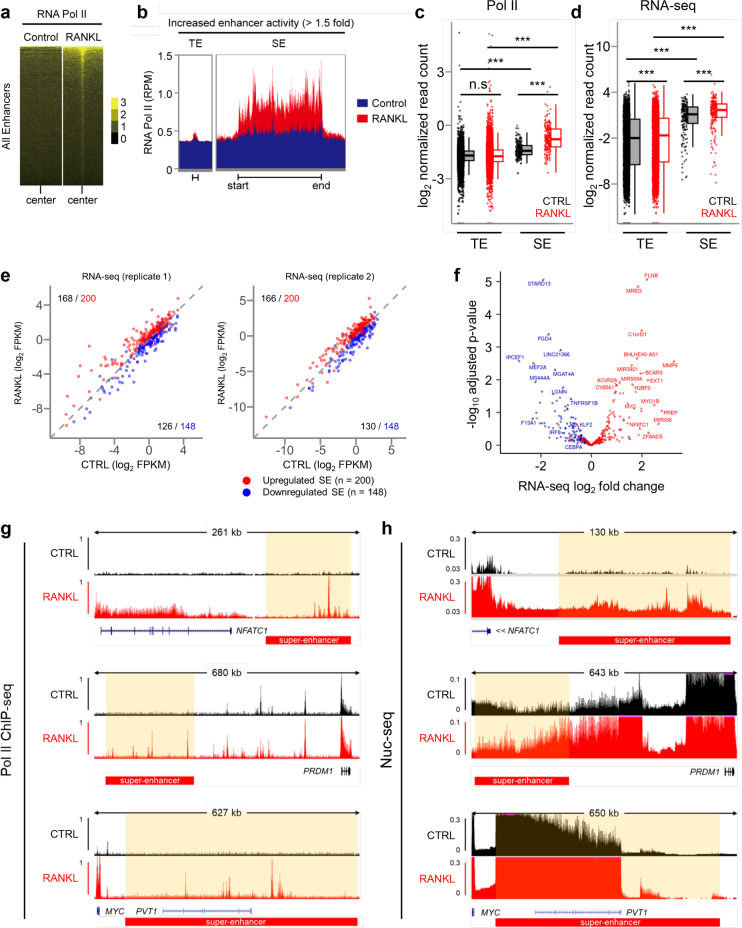
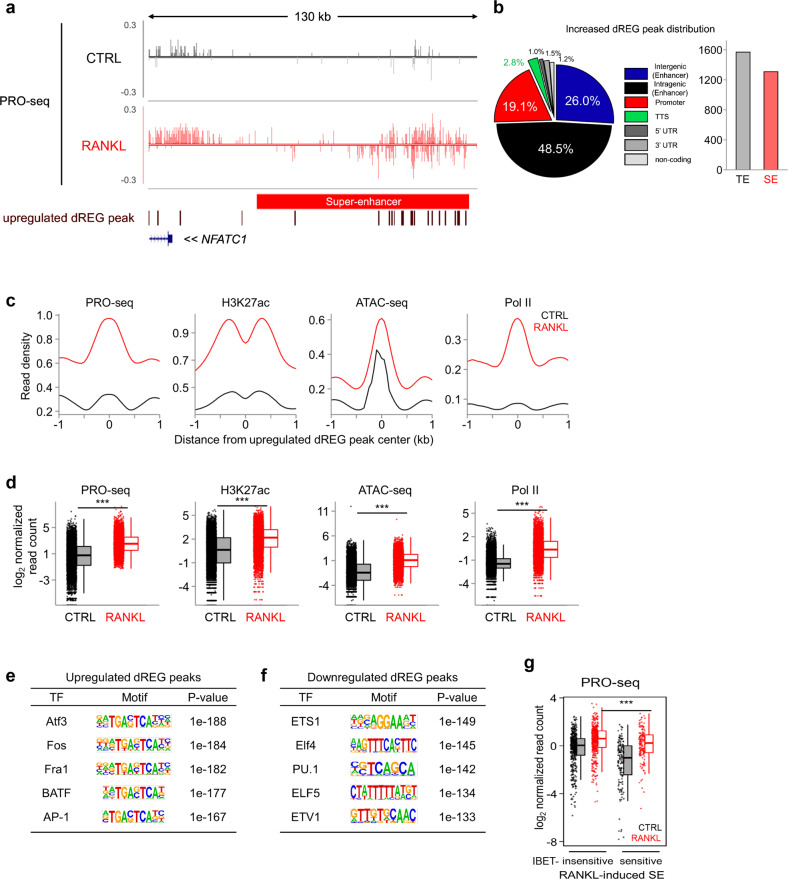
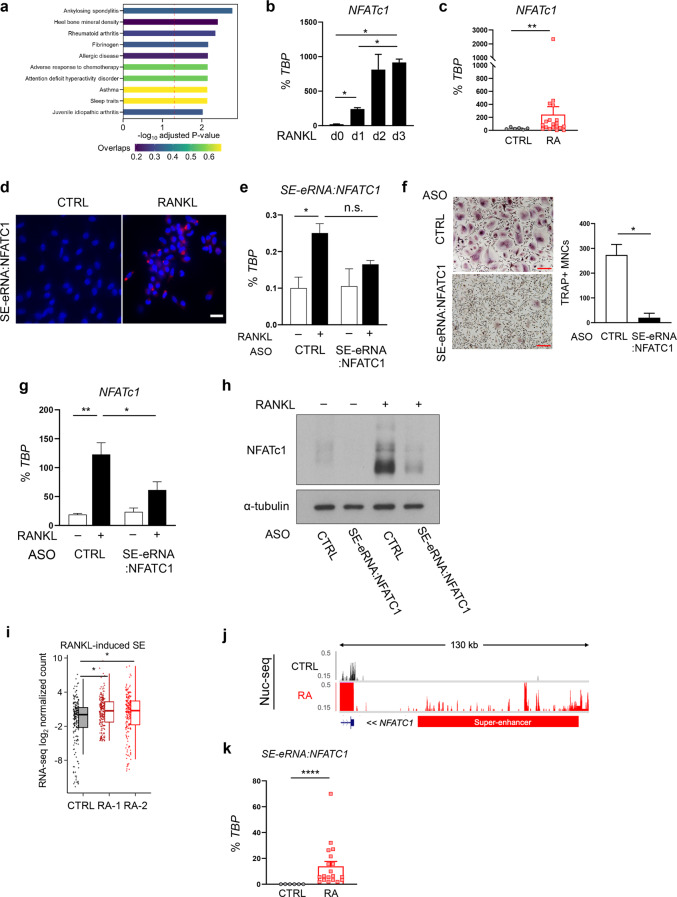
Monocyte/macrophage lineage cells are highly plastic and can differentiate into various cells under different environmental stimuli. Bone-resorbing osteoclasts are derived from the monocyte/macrophage lineage in response to receptor activator of NF-κB ligand (RANKL). However, the epigenetic signature contributing to the fate commitment of monocyte/macrophage lineage differentiation into human osteoclasts is largely unknown. In this study, we identified RANKL-responsive human osteoclast-specific superenhancers (SEs) and SE-associated enhancer RNAs (SE-eRNAs) by integrating data obtained from ChIP-seq, ATAC-seq, nuclear RNA-seq and PRO-seq analyses. RANKL induced the formation of 200 SEs, which are large clusters of enhancers, while suppressing 148 SEs in macrophages. RANKL-responsive SEs were strongly correlated with genes in the osteoclastogenic program and were selectively increased in human osteoclasts but marginally presented in osteoblasts, CD4+ T cells, and CD34+ cells. In addition to the major transcription factors identified in osteoclasts, we found that BATF binding motifs were highly enriched in RANKL-responsive SEs. The depletion of BATF1/3 inhibited RANKL-induced osteoclast differentiation. Furthermore, we found increased chromatin accessibility in SE regions, where RNA polymerase II was significantly recruited to induce the extragenic transcription of SE-eRNAs, in human osteoclasts. Knocking down SE-eRNAs in the vicinity of the NFATc1 gene diminished the expression of NFATc1, a major regulator of osteoclasts, and osteoclast differentiation. Inhibiting BET proteins suppressed the formation of some RANKL-responsive SEs and NFATc1-associated SEs, and the expression of SE-eRNA:NFATc1. Moreover, SE-eRNA:NFATc1 was highly expressed in the synovial macrophages of rheumatoid arthritis patients exhibiting high-osteoclastogenic potential. Our genome-wide analysis revealed RANKL-inducible SEs and SE-eRNAs as osteoclast-specific signatures, which may contribute to the development of osteoclast-specific therapeutic interventions.

Keywords: Osteoclasts; Rheumatoid arthritis; enhancer RNAs; super-enhancers.


Conflict of interest statement

The authors declare no competing interests.

Figures

Fig. 1
Fig. 1
Identification of RANKL-sensitive super enhancers (SEs) in human osteoclasts. Human CD14+ monocytes were cultured overnight with M-CSF (20 ng ml−1) and then treated with M-CSF (CTRL) or M-CSF with RANKL (40 ng ml−1, RANKL) for three days (a) or one day (bf). a Left panel: Schematic showing the differentiation of osteoclasts. Middle panel: osteoclasts were identified as TRAP-positive multinuclear cells (>3 nuclei). Right panel: Phalloidin staining showing actin ring formation in osteoclasts. bf ChIP-seq of H3K27ac was performed. b Distribution of H3K27ac ChIP-seq enrichment scores under the indicated conditions. Enhancer regions are plotted in increasing order based on their input-normalized H3K27ac ChIP-seq signal intensity. SEs are defined as the population of enhancers above the inflection point of the curve. c A RANKL-sensitive SE was characterized by a >1.5-fold change in H3K27ac read density induced by RANKL (left panel). Disease ontology for RANKL-sensitive SE-associated genes with corresponding q-values (right panel). d Read density plot of H3K27ac ChIP-seq across typical enhancer (TE) and SE domains. e Graphs showing the differential H3K27ac ChIP-seq signals among enhancer domains between RANKL and CTRL groups. Increased (left) or decreased (right) H3K27ac ChIP-seq signals after RANKL treatment are shown. Red dots indicate the signals from SE regions, and gray dots indicate the signals from TE regions. Boxplots showing the changes in H3K27ac ChIP-seq signal intensity under the indicated conditions. *p < 0.01 by Kruskal‒Wallis test with Bonferroni correction. Representative SEs are highlighted with their associated genes. f Representative tracks of H3K27ac ChIP-seq at NFATc1, PRDM1, MYC, IRF8, and KLF2 loci under the indicated conditions. Red and black bars indicate upregulated and downregulated SEs, respectively
Fig. 2
Fig. 2
RANKL-sensitive SEs exhibit osteoclast specificity. a H3K27ac ChIP-seq distribution for osteoclasts, osteoblasts, CD34+ progenitors and CD4+ T cells within RANKL-induced osteoclast SEs. Each color indicates a different cell type. b Box plots showing H3K27ac ChIP-seq signal intensities among SE domains in the indicated cell type. ***p < 0.001, n.s., not significant, as determined by Kruskal‒Wallis test with Bonferroni correction. c Chow–Ruskey diagram showing SE- and TE-associated genes in osteoclasts (red border), osteoblasts (blue border), CD34+ progenitors (green border) and CD4+ T cells (purple border). The color of the borders around each intersection corresponds to the cell types with overlapping genes. The red circle in the middle represents the overlap of all four cell types. Lighter shades of red, orange, and yellow represent the overlap of fewer cell types. The area of each intersection is proportional to the number of genes within the intersection. d Representative tracks of H3K27ac ChIP-seq data in the vicinity of SEs in the indicated cell types: osteoclasts (red bar), osteoblasts (blue bar), CD34+ progenitors (green bar) or CD4+ T cells (purple bar). Track colors represent the cell types
Fig. 3
Fig. 3
Dynamic chromatin accessibility at RANKL-sensitive SEs. a Heatmaps showing differential chromatin accessibility (ATAC-seq) after RANKL (40 ng ml−1) treatment; left panel: increased density of ATAC-seq peaks in RANKL (the black box indicates highly inducible ATAC-seq peaks); right panel: decreased density of ATAC-seq peaks in RANKL. b Heatmaps showing read density determined by ATAC-seq and H3K27ac ChIP-seq in areas ± 2 kb peak centers in RANKL-inducible ATAC-seq peaks (n = 5989, a box from A) in human OCPs treated with or without RANKL (40 ng ml−1). c Pie chart showing the genomic location of RANKL-inducible ATAC-seq peaks. d Read density plot based on ATAC-seq across TE and SE domains under the indicated conditions. e Box plots showing ATAC-seq read densities at TEs and SEs under the indicated conditions. ***p < 0.01 by Kruskal‒Wallis test with Bonferroni correction. f Representative tracks based on ATAC-seq data obtained for the regions in proximity of NFATc1, PRDM1 and MYC loci. Red boxes indicate RANKL-induced SE regions (left). Enlarged ATAC-seq tracks and peaks at SE domains (right). g, h Motif analysis of RANKL-regulated ATAC-seq peaks within SE regions
Fig. 4
Fig. 4
Sensitivity to iBET leads to differential regulation of SE-eRNA expression. a Box plot displaying read densities of H3K27ac ChIP-seq in RANKL-sensitive SE domains in the presence or absence of I-BET151 (500 nM). b Distribution of H3K27ac ChIP-seq signals in all RANKL-induced SEs (left, n = 200) and I-BET151-sensitive SEs with 1.5-fold H3K27ac abundance changes at 200 RANKL-sensitive SEs (right, n = 49). c Box plots showing H3K27ac ChIP-seq signals among SE domains under the indicated conditions. d Representative tracks of IBET-sensitive or -insensitive SEs under the indicated conditions. The normalized read counts of H3K27ac obtained by ChIP-seq are shown. e, f Motif enrichment analysis of I-BET151-sensitive or I-BET151-insensitive SEs. g Overall sequencing coverage of H3K27ac and ATAC-seq around BATF-binding motifs. The dotted line, dashed line, and solid lines represent coverage around motifs in the genome, motifs in TEs, and motifs in SEs, respectively. The black line represents the control group (CTRL), and the red line represents the RANKL-treated group. h, i Osteoclastogenesis assay with human OCPs transfected with control or BATF1-/3-specific siRNA and treated with RANKL (40 ng ml−1) (n = 3). Scale bar: 200 µm. h BATF1/3 knockdown efficiency in human OCPs was measured by RT‒qPCR. i The left panel shows representative images of TRAP+ osteoclasts. The right panel shows the percentage of TRAP+ multinuclear cells (MNCs: more than three nuclei) per control, normalized relative to the number of osteoclasts differentiated under control siRNA conditions. Scale bar: 100 µm. ***p < 0.001, **p < 0.01, or *p < 0.05 by Kruskal‒Wallis test with Bonferroni correction (c) or Student’s t test (h, i)
Fig. 5
Fig. 5
Active RNA Pol II recruitment and transcription in RANKL-sensitive superenhancers in human osteoclasts. a Heatmaps showing the enrichment of RNA Pol II ChIP-seq signals in RANKL-sensitive enhancer regions. b Distribution of RNA Pol II ChIP-seq signals across RANKL-sensitive TE and SE domains under the indicated conditions. c Box plots depict the quantitated normalized tag counts of RNA pol II ChIP-seq signals in TE and SE domains under the indicated conditions. d Box plots depicting the quantitated nascent transcripts of nuclear RNA-seq signals in TE and SE domains under the indicated conditions. e Scatter plot showing the transcript levels of genes associated with RANKL-sensitive SEs, depending on whether they are upregulated or downregulated. Red dots indicate the genes related to RANKL-induced SEs, and blue dots indicate the genes related to RANKL-suppressed SEs. f Volcano plot showing the RNA-seq analysis of differentially expressed SE-associated genes. Red dots show genes associated with upregulated SEs, and blue dots show genes associated with downregulated SEs. g, h Representative tracks of RNA Pol II ChIP-seq (g) and RNA-seq (h) in the proximity of NFATc1, PRDM1, and MYC loci under the indicated conditions. Red boxes depict the RANKL-sensitive SE region. ***p < 0.001, n.s., not significant as determined by Kruskal‒Wallis test with Bonferroni correction (c, d)
Fig. 6
Fig. 6
Identification of dREG peaks in human osteoclasts. a Representative tracks of PRO-seq at the NFATc1-associated SE domain under the indicated conditions (CTRL: control, and RANKL: RANKL treatment). An increase in the number of dREG peaks in PRO-seq (brown). b Pie chart showing the genomic location of RANKL-inducible dREG peaks obtained from the PRO-seq data. A bar graph shows the number of dREG peaks in TE and SE domains. c Aggregate plots showing the mean Pro-seq, H3K27ac, Pol II ChIP-seq, and ATAC-seq signals centered on an increased number of dREG peaks under the indicated conditions. d Box plots showing PRO-seq, H3K27ac, Pol II ChIP-seq, and ATAC-seq signals centered on an increased number of dREG peaks under the indicated conditions. ***p < 0.001 by Kruskal‒Wallis test with Bonferroni correction. Motif analysis of RANKL-induced (e) and RANKL-suppressed (f) dREG peaks. g Box plots showing PRO-seq signals among RANKL-induced SE domains under the indicated conditions
Fig. 7
Fig. 7
RANKL-induced SE-eRNAs are enriched in synovial CD14+ cells from RA patients. a Disease ontology for dREG peak-associated genes with corresponding adjusted p values. RT‒qPCR analysis of NFATc1 expression during osteoclastogenesis (b) and in RA synovial CD14+ cells (c), normalized to the expression of TBP mRNA. d Fluorescence in situ hybridization (FISH) with human osteoclasts. DAPI is shown in blue, and signals for SE-eRNA:NFATc1 are shown in red. Scale bar: 50 μm. eh The expression of SE-eRNA:NFATc1 was knocked down by electroporation with antisense-LNA GapmeR in human OCPs. e The expression of SE-eRNA:NFATc1 was measured by RT‒qPCR under the indicated conditions. f Osteoclastogenesis assay. Cells were subsequently cultured with M-CSF and RANKL for three days. The left panel shows representative images of TRAP-stained cells. The right panel shows the percentage of TRAP+ multinuclear cells (MNCs: more than three nuclei) per control. Scale bar: 200 µm. g NFATc1 mRNA was measured by RT‒qPCR under the indicated conditions. h Immunoblot analysis of NFATc1 expression in human CD14+ cells transfected with control or SE-eRNA:NFATc1-specific siRNA and treated for 24 h with RANKL. α-Tubulin was the loading control. i Box plots showing PRO-seq signals in RANKL-induced SEs in 2 different RA synovial CD14+ cell types (RA-1, RA-2) and CD14+ cells from healthy controls (CTRL). j Representative tracks showing the nuclear seq data of RA synovial CD14+ cells in the proximity of NFATc1 (RA: RA synovial OCPs, CTRL: disease control). k SE-eRNA:NFATc1 was measured via RT‒qPCR (see Methods). The data are shown as the means ± SEMs. *p < 0.05, **p < 0.01, ****p < 0.0001, n.s., not significant, as determined by one-way ANOVA (b, e, g), Student’s t test (c, f, k), or Kruskal‒Wallis test with Bonferroni correction (i)

References

    1. Tsukasaki M, Takayanagi H. Osteoimmunology: evolving concepts in bone-immune interactions in health and disease. Nat Rev Immunol. 2019;19:626–42. doi: 10.1038/s41577-019-0178-8. - DOI - PubMed
    1. Park-Min KH. Mechanisms involved in normal and pathological osteoclastogenesis. Cell Mol life Sci: CMLS. 2018;75:2519–28. doi: 10.1007/s00018-018-2817-9. - DOI - PMC - PubMed
    1. Novack DV, Teitelbaum SL. The osteoclast: friend or foe? Annu Rev Pathol. 2008;3:457–84. doi: 10.1146/annurev.pathmechdis.3.121806.151431. - DOI - PubMed
    1. Goldring SR. Pathogenesis of bone and cartilage destruction in rheumatoid arthritis. Rheumatol (Oxf) 2003;42(Suppl 2):ii11–16. doi: 10.1093/rheumatology/keg327. - DOI - PubMed
    1. Sato K, Takayanagi H. Osteoclasts, rheumatoid arthritis, and osteoimmunology. Curr Opin Rheumatol. 2006;18:419–26. doi: 10.1097/01.bor.0000231912.24740.a5. - DOI - PubMed

Publication types