. 2022 Dec 13;20(1):530.
doi: 10.1186/s12951-022-01693-2.

Antenna-enhanced mid-infrared detection of extracellular vesicles derived from human cancer cell cultures

Affiliations

Antenna-enhanced mid-infrared detection of extracellular vesicles derived from human cancer cell cultures

Maria Eleonora Temperini et al. J Nanobiotechnology. .

Abstract

Background: Extracellular Vesicles (EVs) are sub-micrometer lipid-bound particles released by most cell types. They are considered a promising source of cancer biomarkers for liquid biopsy and personalized medicine due to their specific molecular cargo, which provides biochemical information on the state of parent cells. Despite this potential, EVs translation process in the diagnostic practice is still at its birth, and the development of novel medical devices for their detection and characterization is highly required.

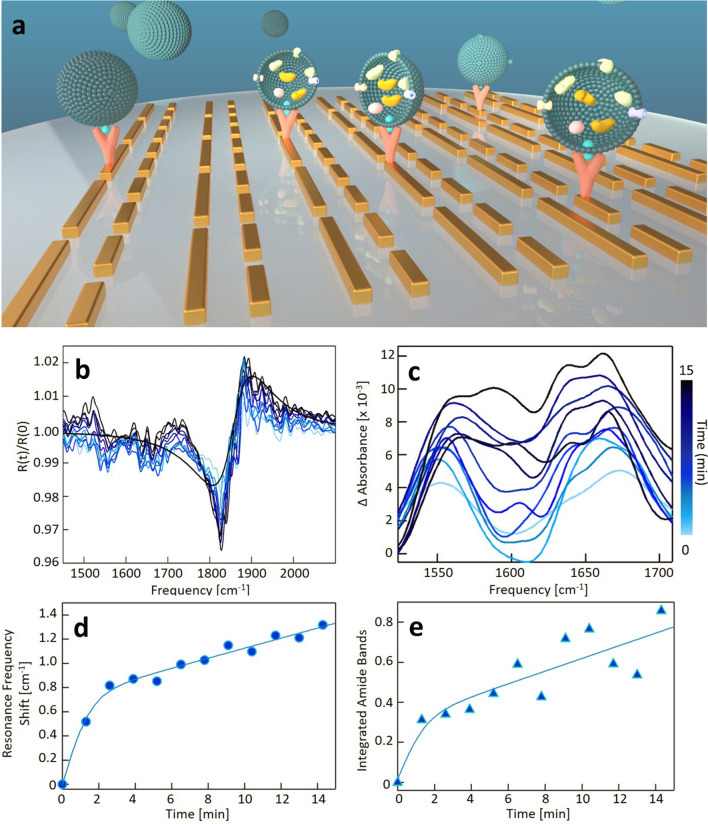
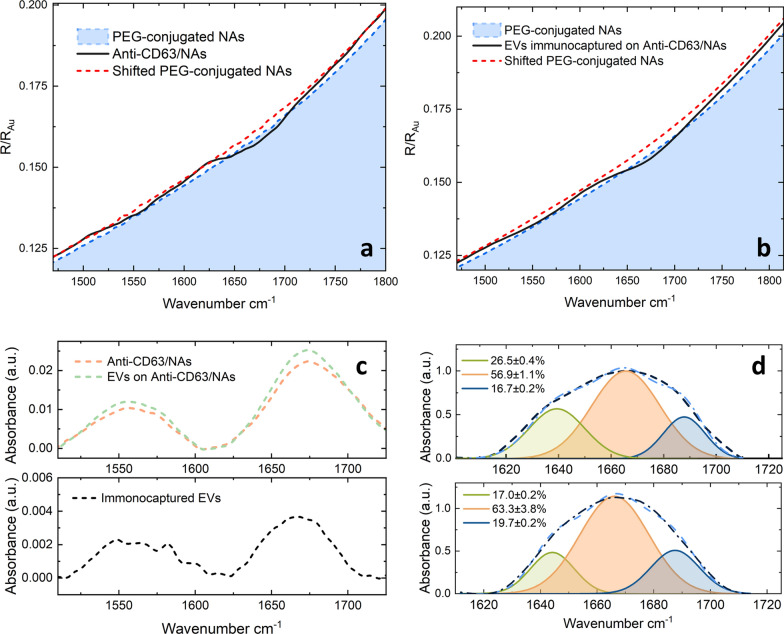
Results: In this study, we demonstrate mid-infrared plasmonic nanoantenna arrays designed to detect, in the liquid and dry phase, the specific vibrational absorption signal of EVs simultaneously with the unspecific refractive index sensing signal. For this purpose, EVs are immobilized on the gold nanoantenna surface by immunocapture, allowing us to select specific EV sub-populations and get rid of contaminants. A wet sample-handling technique relying on hydrophobicity contrast enables effortless reflectance measurements with a Fourier-transform infrared (FTIR) spectro-microscope in the wavelength range between 10 and 3 µm. In a proof-of-principle experiment carried out on EVs released from human colorectal adenocarcinoma (CRC) cells, the protein absorption bands (amide-I and amide-II between 5.9 and 6.4 µm) increase sharply within minutes when the EV solution is introduced in the fluidic chamber, indicating sensitivity to the EV proteins. A refractive index sensing curve is simultaneously provided by our sensor in the form of the redshift of a sharp spectral edge at wavelengths around 5 µm, where no vibrational absorption of organic molecules takes place: this permits to extract of the dynamics of EV capture by antibodies from the overall molecular layer deposition dynamics, which is typically measured by commercial surface plasmon resonance sensors. Additionally, the described metasurface is exploited to compare the spectral response of EVs derived from cancer cells with increasing invasiveness and metastatic potential, suggesting that the average secondary structure content in EVs can be correlated with cell malignancy.

Conclusions: Thanks to the high protein sensitivity and the possibility to work with small sample volumes-two key features for ultrasensitive detection of extracellular vesicles- our lab-on-chip can positively impact the development of novel laboratory medicine methods for the molecular characterization of EVs.

Keywords: Biosensors; Extracellular Vesicles; IR spectroscopy; Nanomaterials; Plasmonics; SEIRA.


Conflict of interest statement

The authors have no competing interests to declare.

Figures

Fig. 1
Fig. 1
a Schematic view of the fluidic-plasmonic device. b SEM micrograph of representative double resonant nanoantenna array. c Schematic view of the optical setup. d Schematic view of the deposition of the 10 μl droplet solution into the fluidic device
Fig. 2
Fig. 2
a Reflectance spectra of the metasurface as a function of the frequency for different values of the lattice constant. b Effect of the incident field polarization. c Resonance wavelength as a function of L1. d Reflectance spectra of a representative nanoantenna array in air and liquid environment
Fig. 3
Fig. 3
a 3D sketch of the nanoantenna array functionalization for EV immunocapture. b Schematic representation of the gold-conjugated molecules. c The ratio between reflectance spectra R(t), taken at time t after antibody exposure at t = 0, and R(0). The colors, from light green to black represent the increasing t from 0 to 32 min with 2-min steps, as shown in the colorbar on the right. The grey line is a representative S-shaped fitting curve used to evaluate the SPR frequency shift. d Detailed view of the different absorption signals in the region of the amide bands (1500–1700 cm−1), with the same color legend of the panel c. e SPR frequency shift vs. time obtained by the fitting procedure of the data in panel c in the 1800–2100 cm−1 range. The solid green line represents the sigmoidal fitting curve. f Integral of the difference in absorption signal in the amide band region vs. t and the related sigmoidal fitting curve
Fig.4
Fig.4
Characterization of the EVs isolated from HT-29 cells. a Representative AFM topography of purified EVs together with a selected line profile. (scale bar 300 nm). b, c Representative TEM images of purified EVs. Scale bars 80 nm (b), and 50 nm (a). d Nanoparticle tracking analysis of EVs isolated from HT-29, size distribution with a video frame. E Western blot analysis of EVs markers (Alix, CD63) and non-EVs marker (Cytochrome C) in HT29 cell-derived EVs and whole-cell lysates
Fig.5
Fig.5
a 3D sketch of the small extracellular vesicles immunocapture on the functionalized nanoantenna array. b Ratio between reflectance spectra R(t), taken at time t after EVs exposure at t = 0, and R(0). The increasing blue color intensity represents the increasing t from 0 to 14 min with 1.3-min steps. The black line is a representative S-shaped fitting curve used to evaluate the SPR frequency shift. c Detailed view of the difference absorption signal in the region of the amide bands (1500–1700 cm−1), same color legend of panel b. d SPR frequency shift vs time obtained by the fitting procedure of the data in panel b in the 1700–2000 cm−1 range. The solid blue line represents the sigmoidal fitting curve. e Integral of the difference absorption signal in the amide band region vs t and the related sigmoidal fitting curve
Fig. 6
Fig. 6
Representative CFM images of untreated (a) and NAC-treated (b) Caco2 cancer cells. Scale bar 10 µm. c comparative analysis of E-cadherin expression in the two sample types obtained by computing the average green fluorescence intensities on cell-to-cell profiles using tens of CFM images. Representative 3D reconstructions from confocal image stacks for untreated (d) and treated (e) cells, respectively. Representative SEM micrographs of the cell surface for untreated (f) and treated (g) cells. Scale bar 2 μm
Fig. 7
Fig. 7
a Enlarged detail of the reflectance of our PEG-conjugated metasurface in the 1430–1800 cm−1, spectral range measured in a dry environment (blue dashed line), together with the spectral response of the same sample after Neutravidin and Anti-CD63 functionalization (black solid line) and the red-shift compensated reflectance of the PEG conjugated metasurface. b enlarged detail of the reflectance of our PEG-conjugated metasurface in the 1430–1800 cm−1environment (blue dashed line), together with the spectral response of the same device after EV immunocapture and the red-shift compensated reflectance of the PEG conjugated metasurface. c Absorbance in the Amide I/II region of Anti-CD63 and Neutrovidin molecules with (green dashed line) and without (orange dashed line) immunocaptured EVs. d Enlarged detail of the Amide I region for EVs extracted from the Caco2 cells in the Epithelial Phenotype (upper panel) and the mesenchymal Phenotype (lower panel). A peak deconvolutional analysis with gaussian fits is superimposed on each plot

References

    1. Giannopoulou L, Zavridou M, Kasimir-Bauer S, Lianidou ES. Liquid biopsy in ovarian cancer: the potential of circulating miRNAs and exosomes. Transl Res. 2019;205:77–91. - PubMed
    1. Li S, Yi M, Dong B, Tan X, Luo S, Wu K. The role of exosomes in liquid biopsy for cancer diagnosis and prognosis prediction. Int J Cancer. 2020 doi: 10.1002/ijc.33386. - DOI - PMC - PubMed
    1. Chun-Yan L, Zi-Yi Z, Tian-Lin Y, Yi-Li W, Bao L, Jiao L, et al. Liquid biopsy biomarkers of renal interstitial fibrosis based on urinary exosome. Exp Mol Pathol. 2018;105(2):223–228. - PubMed
    1. Li G, Tang W, Yang F. Cancer liquid biopsy using integrated microfluidic exosome analysis platforms. Biotechnol J. 2020;15(5):1900225. - PubMed
    1. Cui S, Cheng Z, Qin W, Jiang L. Exosomes as a liquid biopsy for lung cancer. Lung Cancer. 2018;116:46–54. - PubMed