. 2022 Dec 13;23(1):255.
doi: 10.1186/s13059-022-02816-6.

Structural variant analysis of a cancer reference cell line sample using multiple sequencing technologies

Affiliations

Structural variant analysis of a cancer reference cell line sample using multiple sequencing technologies

Keyur Talsania et al. Genome Biol. .

Abstract

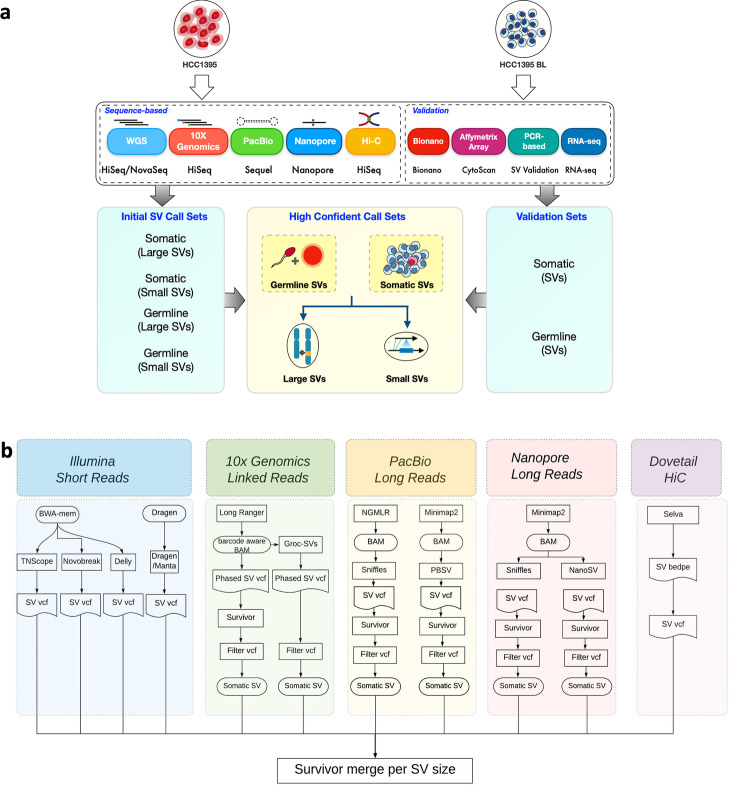
Background: The cancer genome is commonly altered with thousands of structural rearrangements including insertions, deletions, translocation, inversions, duplications, and copy number variations. Thus, structural variant (SV) characterization plays a paramount role in cancer target identification, oncology diagnostics, and personalized medicine. As part of the SEQC2 Consortium effort, the present study established and evaluated a consensus SV call set using a breast cancer reference cell line and matched normal control derived from the same donor, which were used in our companion benchmarking studies as reference samples.

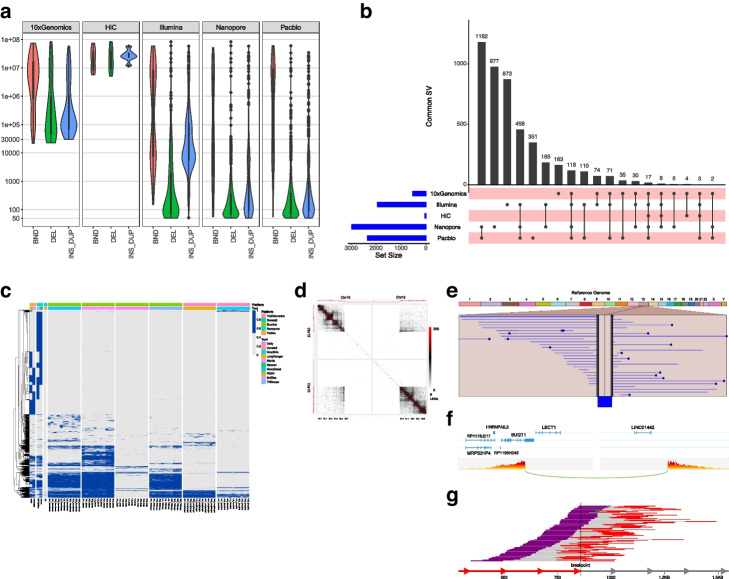
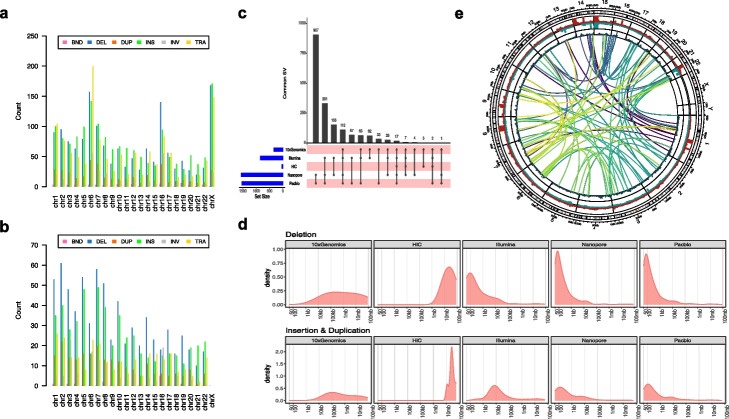
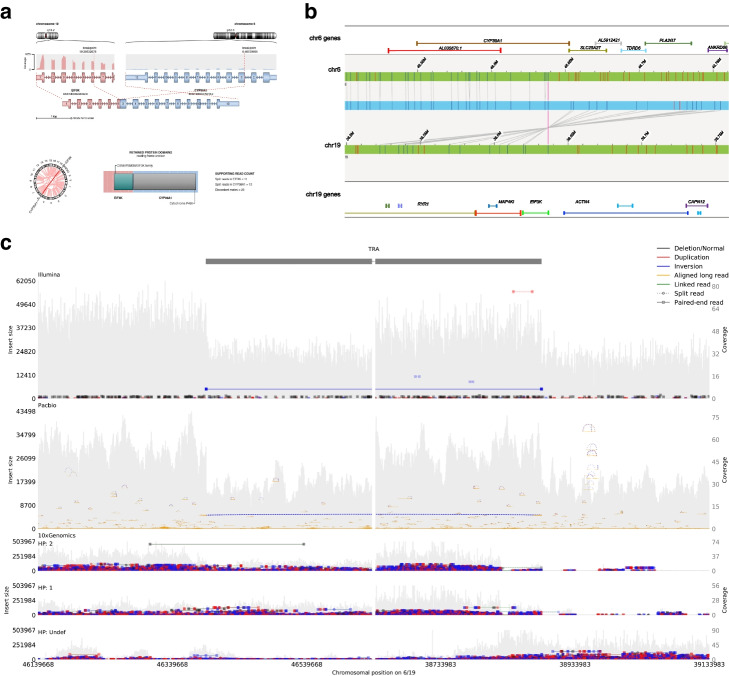
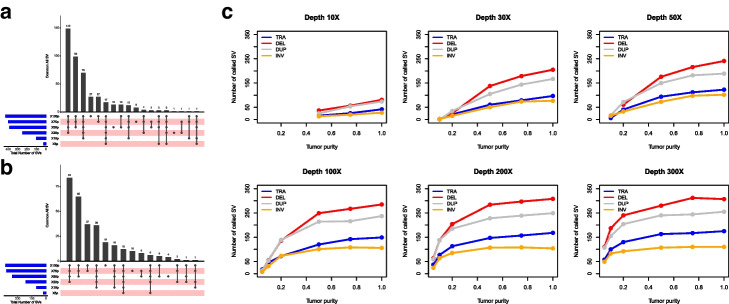
Results: We systematically investigated somatic SVs in the reference cancer cell line by comparing to a matched normal cell line using multiple NGS platforms including Illumina short-read, 10X Genomics linked reads, PacBio long reads, Oxford Nanopore long reads, and high-throughput chromosome conformation capture (Hi-C). We established a consensus SV call set of a total of 1788 SVs including 717 deletions, 230 duplications, 551 insertions, 133 inversions, 146 translocations, and 11 breakends for the reference cancer cell line. To independently evaluate and cross-validate the accuracy of our consensus SV call set, we used orthogonal methods including PCR-based validation, Affymetrix arrays, Bionano optical mapping, and identification of fusion genes detected from RNA-seq. We evaluated the strengths and weaknesses of each NGS technology for SV determination, and our findings provide an actionable guide to improve cancer genome SV detection sensitivity and accuracy.

Conclusions: A high-confidence consensus SV call set was established for the reference cancer cell line. A large subset of the variants identified was validated by multiple orthogonal methods.

Keywords: Cancer; Multiple platforms; Next-generation sequencing technology; Reference call set; Structural variant calling algorithm; Structural variation.


Conflict of interest statement

EJ, AN, AM, AG, TT, and RB are employees of Illumina Inc. ZL is currently an employee of Sentienon Inc. RK is an employee of Immuneering Corporation. MA. AP, BK, KH, and AH are employees of Bionano Genomics, and LTF is an employee of Roche Sequencing Solutions Inc. AA is an employee of DNAnexus. VM is an employee of Dovetail Genomics. All other authors declare that they have no competing interests.

Figures

Fig. 1
Fig. 1
Study design and bioinformatics workflow for SV detection and integration. a Schematic overview of the study design. Two well-characterized reference cell lines (HCC1395 and HCC1395BL) were used to generate whole-genome sequencing data across five platforms (Illumina short reads, 10X Genomics linked reads, PacBio long reads, Oxford Nanopore long reads, and Dovetail Hi-C proximity ligation). Initial SV call sets were identified from each platform and combined together to identify high-confidence call sets. The SVs from high-confidence call sets were selected for PCR-based validation for deletion, insertion, intra-chromosomal inversion and inter-chromosomal translocation; copy number changes were validated by Affymetrix array. Large SVs (≥20kb) were validated using Bionano optical mapping. RNA-seq was used to validate the fusion gene and translocation events. b Schematic overview of the bioinformatics analysis workflow. Each platform’s data was processed by the aligner and SV caller specific to that platform. The tumor-only or somatic SV calls were selected by Survivor. The final call sets from each platform were integrated together using the Survivor software tool based a window-size approach and SV types
Fig. 2
Fig. 2
SV detection comparison across different NGS technologies and Software Tools in HCC1395 cancer cell Line. a Violin plot shows the SV detection size ranges for all of SVs called by each NGS platform. The y-axis denotes the SV size in bp, the x-axis denotes the SV types detected by each platform. b Comparison of SVs called by different NGS platform among 10X Chromium linked reads, Illumina short reads, Hi-C, Nanopore, and PacBio call sets. The blue horizontal bars on the left side show the total number of SVs in the specific sequencing platform, black dots on the pink bars denote total SVs called in each sequencing platform. The top black vertical bars display the total concordance calls among the different sequencing platforms. c The heatmap denotes the SV frequencies detected by each tool and technology were generated based on SV location on genome, SV type, and SV frequency which was calculated based on the section “Calculating SV calling frequency and select high-confidence call set”. The platforms include 10X Genomics, Dovetail Hi-C, Illumina, Nanopore, and PacBio. Software tools in the plots include Dell, GrocSVs, Hi-C (Selva), Long Ranger, Manta, Nanosv, NovoBreak, PBSV, Sniffles Nanopore, Sniffles PacBio, and TNscope. The heatmap color denotes the SV frequencies detected by each tool and technology, the dendrograms along the side of the heatmap show similarity and variability how the SVs are clustered. d-e Cross-platform detection of a deletion between 52 and 60Mb region of the chromosome 13. The deletion event was identified by all the replicates and software tools. d Hi-C detection of the deletion event. The outer blackline (outside of the contact matrix) suggests the average read coverage across the entire genome. Red line is raw reads coverage per position. Top left and bottom right part of the contact matrix showing the common contact with 2158 total spanning reads. e Deletion from PacBio data using Ribbon software. The data mapped by minimap2 caller and SV event called by PBSV and Sniffles. The deletion is shown in the middle. The dots in the plot suggest the indeletion events. There are a total 29 reads showing deletion from the PacBio data. f 10X Genomics detected deletion event: Image is generated using loupe browser. The image is showing the barcode interaction between the two coordinates of the chr13 location suggesting deletion. The slope suggests the total number of shared barcodes between two locations. The data was mapped using lariat (Long Ranger) and events called by Long Ranger (SV) and Groc_SVs. g The visualization is generated using SVVIZ from Illumina data. Reads aligning better to the alternate allele than the reference allele will be shown in the set of tracks. Line indicates the break point across 79 reads. The data was mapped using BWA, and SV events were called by Delly, Manta, Novobreak, and TNScope
Fig. 3
Fig. 3
Structural variant initial and high-confidence call set. a Bar chart plot displays BNDs, DELs, DUPs, INSs, INVs, and TRA on all chromosomes from initial call set. b Bar chart plot displays BNDs, DELs, DUPs, INSs, INVs, and TRA on all chromosomes from high-confidence call set. c Upset plot to display the number of SV overlap between the different NGS platforms. The blue horizontal bars on the left side show the total number of SVs in the specific NGS platform, black dots on the pink bars denote total SVs called in each platform. The top black vertical bars display the total concordance calls among the different platforms. d Density plot for SV size distributions for Deletion events (top panel) and Duplication events (bottom panel). The y-axis denotes log10 scale of number of SVs; the x-axis denotes the SV size bin from 50bp to 20Mb. e Circos plot visualization of results from the HATCHet + RCK analysis from the matched tumor/normal (HCC1395 and HCC1395BL) WGS analysis. The amplification track (CN > 1, red) and deletion track (CN < 1, blue) show the fraction of the amplified or deleted regions as reported by RCK. The breakpoint bar plot shows the number of novel adjacency (structural variant) breakpoints that start or end within a chromosomal region (max = 128). The center chord diagram shows the start and end points for all inter-chromosomal transversion events (n = 122). All structural variants shown are present in the consensus call set. Chromosomal regions for the amplification, deletion, and structural variant breakpoint tracks are binned into 5 megabase windows
Fig. 4
Fig. 4
The inter-chromosomal translocation event for fusion gene EIF3K–CYP39A1 detected and validated by multiple technologies. a CYP39A1 gene on chromosome 6 is translocated and inverted to make a fusion transcript with EIF3K gene on chromosome 19. The fusion transcript was detected from RNA-seq data. b EIF3K–CYP39A1 translocation and inversion event detected from Bionano optical mapping. The blue bar in the middle denotes the reference genome, the green bars denote the optical mappings and the vertical lines between the blue and green bars represent the mapping between reference and maps. Top green bar shows maps on chromosome 6 and the bottom green bar shows maps on chromosome 19. c EIF3K–CYP39A1 translocation and inversion event are detected from NGS technologies from Illumina (top), PacBio (middle), and 10X Genomics linked reads (bottom). The visualization is generated using SVVIZ
Fig. 5
Fig. 5
Effect of tumor purity and sequencing depth for SV detection. a Comparing small SV (50bp–30kb size range) detection sensitivities in different tumor purities in 5, 10, 20, 50, 75, and 100% tumor purity with 100x sequencing coverage. b Comparing large SV (>30kb) detection sensitivities in different tumor purities in 5, 10, 20, 50, 75, and 100% tumor purity at 100x sequencing coverage. The blue horizontal bars on the left show the total number of SVs in the specific tumor purity, pink bar with black dots denote number of SVs called in each tumor purity data. The top black vertical bars display the total concordance calls among the different tumor purities. c Line charts display SV detection sensitivity among different sequencing depth (10X, 30X, 50X, 100X, 200X, 300X) and different tumor purities (5%, 10%, 20%, 50%, 100%). The reference call set was built with consensus methodology and used the SVs from our consensus call set. The recalled SVs were separated into TRA (Translocation), DEL (Deletion), DUP (Duplication), and INV (Inversion)

References

    1. Hanahan D, Weinberg RA. The hallmarks of cancer. Cell. 2000;100:57–70. - PubMed
    1. Alioto TS, Buchhalter I, Derdak S, Hutter B, Eldridge MD, Hovig E, et al. A comprehensive assessment of somatic mutation detection in cancer using whole-genome sequencing. Nat Commun. 2015;6:10001. - PMC - PubMed
    1. Albertson DG, Ylstra B, Segraves R, Collins C, Dairkee SH, Kowbel D, et al. Quantitative mapping of amplicon structure by array CGH identifies CYP24 as a candidate oncogene. Nat Genet. 2000;25:144. - PubMed
    1. Liggett WH, Sidransky D. Role of the p16 tumor suppressor gene in cancer. J Clin Oncol. 1998;16:1197–1206. - PubMed
    1. Korbel JO, Urban AE, Affourtit JP, Godwin B, Grubert F, Simons JF, et al. Paired-end mapping reveals extensive structural variation in the human genome. Science. 2007;318:420–426. - PMC - PubMed

Publication types