. 2022 Nov 2:21:21-33.
doi: 10.1016/j.csbj.2022.10.040. eCollection 2023.

A novel Boolean network inference strategy to model early hematopoiesis aging

Affiliations

A novel Boolean network inference strategy to model early hematopoiesis aging

Léonard Hérault et al. Comput Struct Biotechnol J. .

Abstract

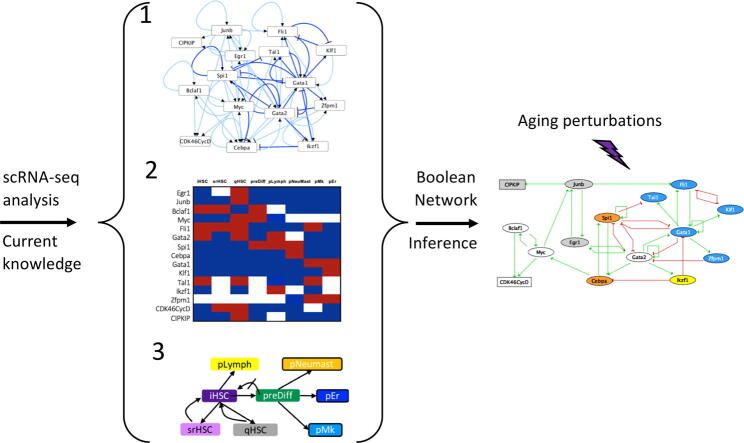
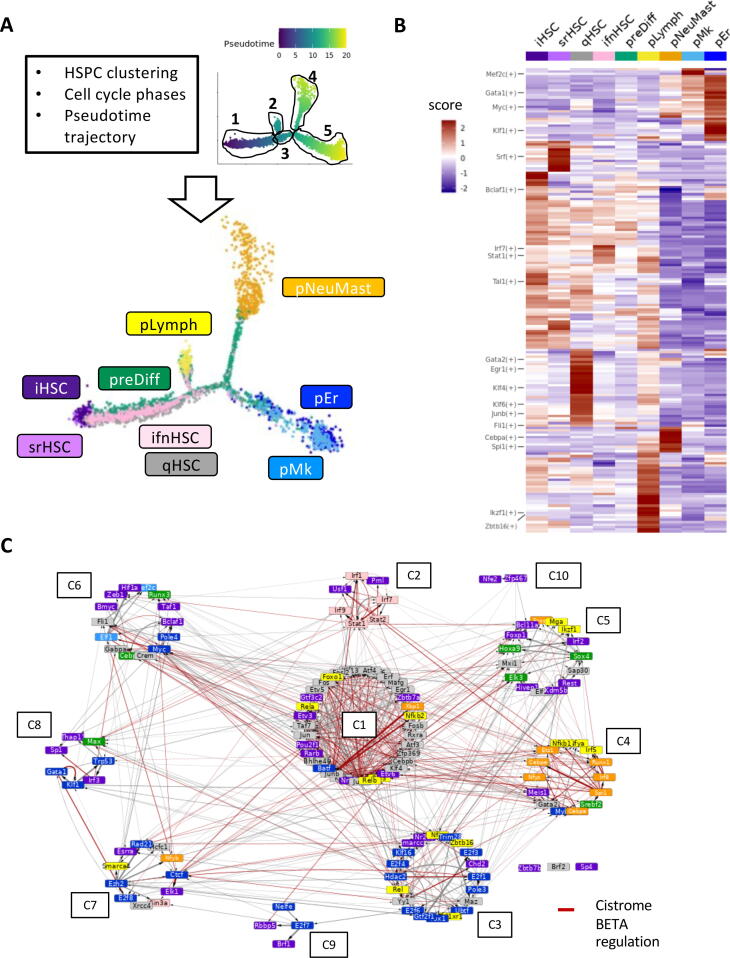
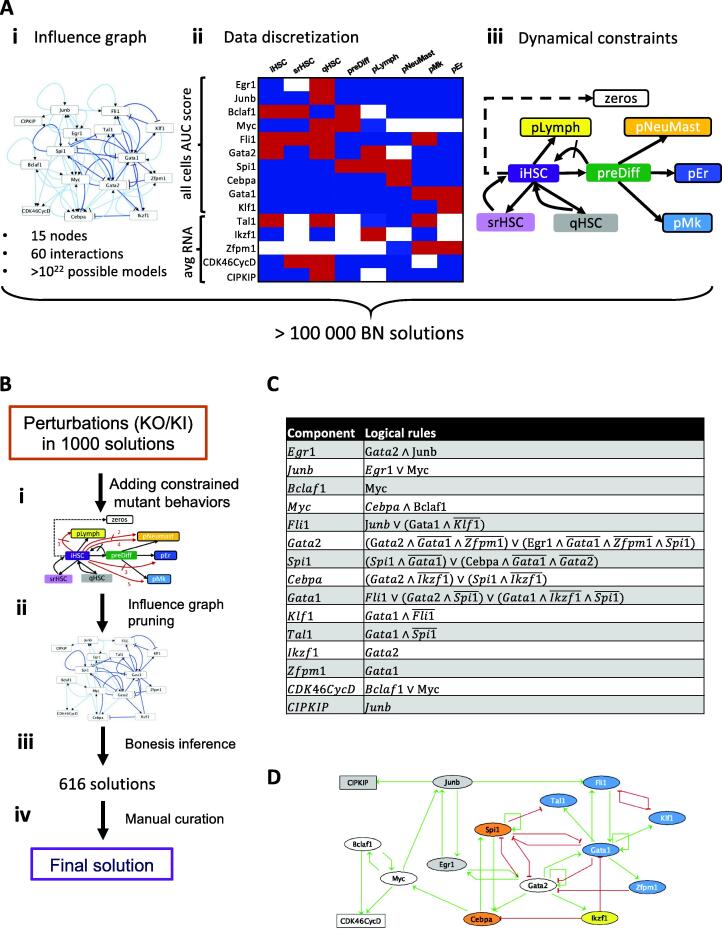
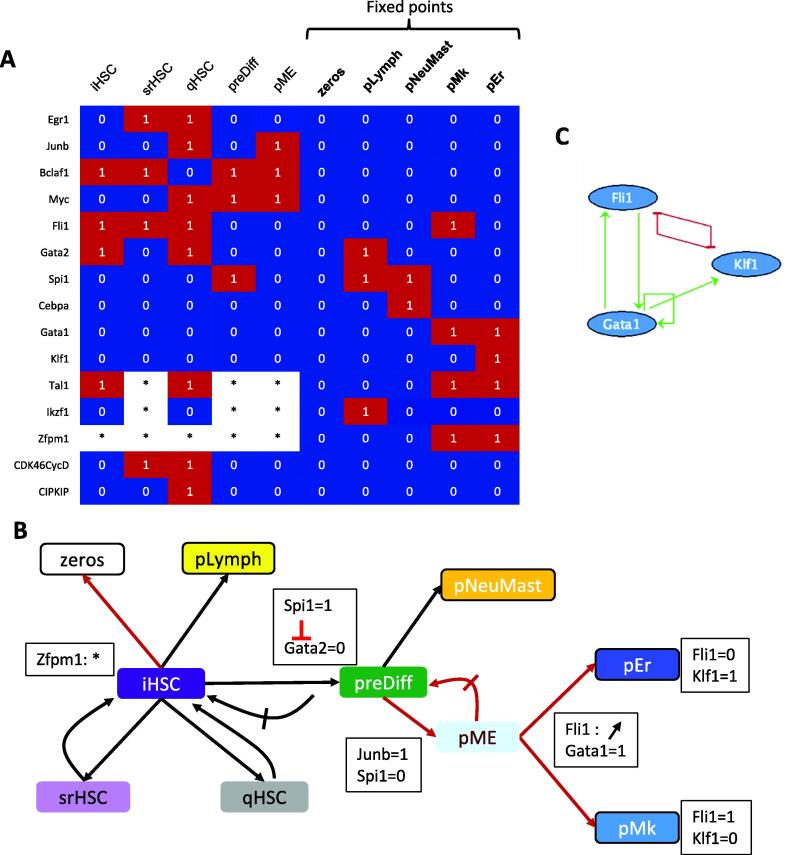
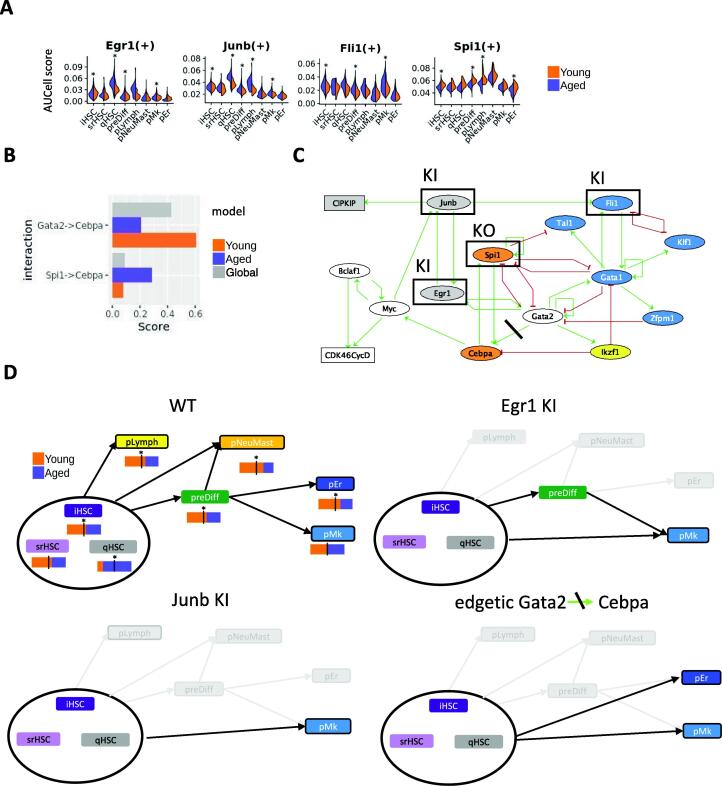
Hematopoietic stem cell (HSC) aging is a multifactorial event leading to changes in HSC properties and functions, which are intrinsically coordinated and affect the early hematopoiesis. To better understand the mechanisms and factors controlling these changes, we developed an original strategy to construct a Boolean model of HSC differentiation. Based on our previous scRNA-seq data, we exhaustively characterized active transcription modules or regulons along the differentiation trajectory and constructed an influence graph between 15 selected components involved in the dynamics of the process. Then we defined dynamical constraints between observed cellular states along the trajectory and using answer set programming with in silico perturbation analysis, we obtained a Boolean model explaining the early priming of HSCs. Finally, perturbations of the model based on age-related changes revealed important deregulations, such as the overactivation of Egr1 and Junb or the loss of Cebpa activation by Gata2. These new regulatory mechanisms were found to be relevant for the myeloid bias of aged HSC and explain the decreased transcriptional priming of HSCs to all mature cell types except megakaryocytes.

Keywords: Aging; Boolean modelling; Gene regulatory network Inference; Hematopoietic stem cells; Single-cell RNA seq.


Conflict of interest statement

The authors declare that they have no known competing financial interests or personal relationships that could have appeared to influence the work reported in this paper.

Figures

None
From single cell RNA-seq (scRNA-seq) data and current knowledge in early hematopoiesis (literature and biological database investigation), 3 inputs were obtained to define the Boolean network synthesis of this process as a Boolean satisfiability problem depending on observations of states in the differentiation process: 1. Influence graph between selected components. 2. Discretized component activity levels in the considered states (blue: 0/inactive, white: */unknown or free, red: 1/active). 3. Dynamic relations (stable states, (non) reachability) between the considered states. After the solving, a Boolean model of early hematopoiesis is obtained. This model is altered according to the characteristics of aging observed in our scRNA-seq data, in order to identify the main molecular actors and mechanisms of aging.
Fig. 1
Fig. 1
Regulon analysis identified distinct HSPC states with specific transcription factor activities and interactions. A Upper panel: HSPC states are defined according to results of cell clustering, cell cycle phase assignment and pseudotime trajectory analysis of scRNA-seq data10. On the right, cells are ordered on the pseudotime trajectory and are coloured according to their pseudotime value. The 5 branches of the trajectory are circled. Lower panel: pseudotime trajectory where cells are colored according to their HSPC state: initial HSCs (iHSC, dark violet); self-renewal (scHSC, violet); quiescent (qHSC, gray); interferon (ifnHSC, pink); differentiation (preDiff, green). And the primed states: lymphoid (pLymph, yellow); neutrophils and mastocytes (pNeuMast, orange); erythrocytes (pEr, dark blue) and megakaryocytes (pMk, blue). B Heatmap of the average AUCell scores of the regulon activity in each HSPC state. The scores were standardized and used to cluster regulons hierarchically. C Transcriptional regulation network of the regulon markers of the HSPC states. Regulons were clustered in 10 communities (from C1 to C10) plus 3 isolated nodes with Louvain graph clustering. Node color highlights the states where the regulon is the most active (same color code as in Fig. 1A). Red (resp. grey) edges indicate transcriptional regulations that are (resp. are not) supported by peak analysis in the Cistrome database. Edge thickness represents the normalized interaction score (NIS) obtained from SCENIC. (For interpretation of the references to color in this figure legend, the reader is referred to the web version of this article.)
Fig. 2
Fig. 2
Inference of a gene Boolean network to model HSC priming. A Inference steps performed with wild-type constraints. (i) A first influence graph is retained taking into account the possible interactions of the components deduced from the literature and the SCENIC results. Interactions with a high (low) confidence level are in dark (pale) blue. (ii) Table representing the discretisation of the 15 components in the 9 configurations. Blue indicated active, red inactive and white free state. Red (resp. blue) hatched cases mark node activities freed from 1 (resp 0) to * in the final configuration settings compared to the discretized data. (iii) Graph representation of the dynamical constraint imposed between the configurations (nodes). Arrows (resp. crossed out arrows) indicate reachability (resp. unreachability) between source and target configurations. Framed configurations are constrained as fixpoints. Dashed line highlights the reachability of the fixpoint with all node activities at 0 from iHSC. B Workflow of the strategy used to refine the search of solution and obtain a final solution. (i) Updating of the influence graph after the consideration of constraints coming from mutant behaviors. For the updated constraints see supplementary Fig. 3A. (ii) Pruning of the influence graph through maximization of high-confident interactions and minimization of others. (iii) As a last inference step, we forced the use of all remaining edges, this provided 616 possible solutions (iv). A manual curation is necessary to obtain the final model. C Logical rules of the Boolean model. D Gene regulatory network of the Boolean model. Nodes, rectangular for cell cycle complexes and ellipse for TFs, are colored according to the HSPC states in which they are highly active according to our regulon analysis: gray for qHSC, yellow for pLymph, orange for pNeuMast, blue for pMk and pEr, white for the nodes highly active in several HSPC states. (For interpretation of the references to color in this figure legend, the reader is referred to the web version of this article.)
Fig. 3
Fig. 3
Analyses of the Boolean model evidence a sequence of transcriptional events to prime HSCs. A Table describing the configurations of the model matching the HSPC states (column: HSPC states, lines: components of the model). Colors represent the activation levels of the nodes (blue: inactive; red: active, white: free). The five last columns are the fixed points of the model. pME configuration (5th column) results from the analysis of the model. B Graph representation of the (non)reachabilities between the configurations. Framed configurations represent fixed points, arrows (resp. crossed arrows) indicate reachability (resp. unreachability) from their source to their target configurations. Black arrows are constrained dynamic properties whereas the red ones result from the dynamic study of the model. The annotations in black boxes represent TF activities read in the dynamics, Zfpm1: * highlights the two possible values of this node in iHSC. Irreversible inactivation of Gata2 by Spi1 in the preDiff non-return configuration. necessary update of Junb (=1) and Spi1 (=0) to reach the configuration pME from preDiff. In MP semantics, from pME an increasing activity of Fli1() can first activate Gata1 and then inhibit Klf1. Thus, depending on whether Gata1 activates Klf1 before it is inhibited by Fli1, pEr is reached rather than pMk. C Regulatory motif involving Gata1, Fli1 and Klf1 of the BN with a cross-inhibitory circuit between Klf1 and Fli1 maintaining HSC priming to pMk or pEr. (For interpretation of the references to color in this figure legend, the reader is referred to the web version of this article.)
Fig. 4
Fig. 4
Perturbations of the early hematopoiesis model explain some HSC aging features. A Combined violin plots of most altered TF (of the model) activities upon aging in young (orange) and aged (purple) cells from the different HSPC states. Stars show significant differences of activity score between young and aged cells (average difference > 0.001 and p value <10−3). B Normalized interaction scores of Cebpa activation by Spi1 and Gata2 from SCENIC multiple runs on all cells (grey), young cells (orange) and aged cells (purple). C Aging perturbations of the Boolean gene network. Rectangular nodes are cell cycle complexes and ellipse nodes TFs. Nodes are colored according to the HSPC states in which they are highly active according to our single cell analysis: gray for qHSC, yellow for pL, orange for pNeuMast, blue for pMk and pEr, white for the nodes highly active in several HSPC states. Framed nodes highlight the 4 TF significantly altered with aging and crossed out activation of Cebpa by Spi1 illustrates its edgetic mutation. D Reachability of HSCP states from any initial configuration from iHSC, srHSC or qHSC for WT and 3 altered dynamics of the model: WT case (top left) Young (orange) and aged (purple) cell proportion is given below each HSPC state node. A star highlights a significant shift from the global young/aged cell proportions in the single cell data (hypergeometric test p value < 0.05). Egr1 KI perturbation (top right); Junb KI perturbation(bottom left); Cebpa edgetic mutation (bottom right). In each graph, black arrows represent the reachabilities between configurations; pale gray represent the WT reachabilities lost with the mutation. (For interpretation of the references to color in this figure legend, the reader is referred to the web version of this article.)

References

    1. Laiosa C.V., Stadtfeld M., Graf T. Determinants of lymphoid-myeloid lineage diversification. Annu Rev Immunol. 2006;24:705–738. doi: 10.1146/annurev.immunol.24.021605.090742. - DOI - PubMed
    1. Mercer E.M., Lin Y.C., Murre C. Factors and networks that underpin early hematopoiesis. Semin Immunol. 2011;23:317–325. doi: 10.1016/j.smim.2011.08.004. - DOI - PMC - PubMed
    1. Murre C. Developmental trajectories in early hematopoiesis. Genes Dev. 2009;23:2366–2370. doi: 10.1101/gad.1861709. - DOI - PMC - PubMed
    1. Svendsen A.F., Yang D., Kim K.M., Lazare S.S., Skinder N., Zwart E., et al. A comprehensive transcriptome signature of murine hematopoietic stem cell aging. Blood. 2021 doi: 10.1182/blood.2020009729. - DOI - PubMed
    1. Poplineau M., Vernerey J., Platet N., N’guyen L, Hérault L, Esposito M,, et al. PLZF limits enhancer activity during hematopoietic progenitor aging. Nucleic Acids Res. 2019;47:4509–4520. doi: 10.1093/nar/gkz174. - DOI - PMC - PubMed