

Ultrasound reference values for peripheral nerve cross-sectional areas and indices in a sample of healthy individuals in Brazil
- PMID: 36514679
- PMCID: PMC9743255
- DOI: 10.1590/0100-3984.2022.0020
Ultrasound reference values for peripheral nerve cross-sectional areas and indices in a sample of healthy individuals in Brazil
Abstract
Objective: To establish peripheral nerve cross-sectional area (CSA) reference values (absolute values, measures of asymmetry, and measures of focality) for healthy individuals in Brazil.
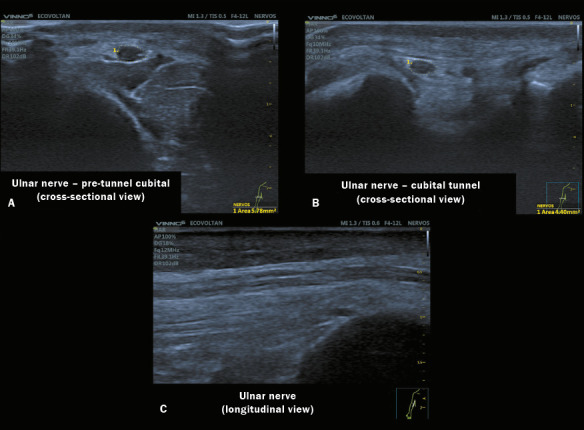
Materials and methods: Sixty-six healthy volunteers underwent high-resolution ultrasound of the peripheral nerves. We obtained CSA measurements for three peripheral nerves, at specific locations: the median nerve, in the carpal tunnel (MT); the ulnar nerve, at the cubital tunnel site (UT) and at the pre-tunnel site (UPT); and the common fibular nerve, near the fibular head (FH). We calculated the CSA indices between the same sites on different sides (ΔCSAs) and between the ulnar nerve tunnel and pre-tunnel sites on the same side (ΔTPT).
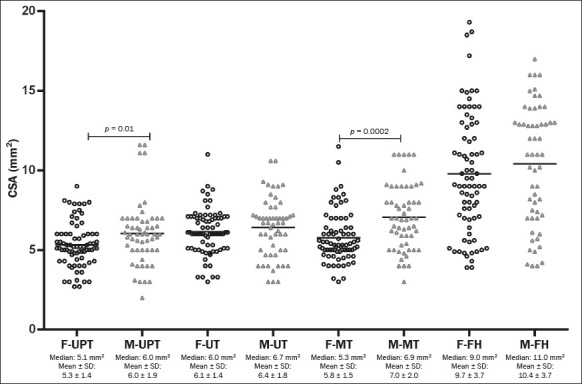
Results: A total of 132 neural sites were analyzed, and the following CSA values (mean ± SD, median) were obtained: MT (6.3 ± 1.9 mm2, 6.0 mm2); UT (6.2 ± 1.6 mm2, 6.1 mm2); UPT (5.6 ± 1.7 mm2, 5.4 mm2); and FH (10.0 ± 3.7 mm2, 9.9 mm2). The ΔCSA values (mean ± SD, median) were as follows: MT (0.85 ± 0.7 mm2, 0.95); UT (0.81 ± 0.62 mm2, 0.95); UPT (0.61 ± 0.51 mm2, 0.5); and FH (1.0 ± 0.77 mm2, 1.0). The ΔTPT (mean ± SD, median) was (1.0 ± 0.8 mm2, 1.0).
Conclusion: Among individuals in Brazil, peripheral nerve CSA values tend to be higher among males and to increase with aging. However, the same does not appear to hold true for the ΔCSA or the ΔTPT, the exception being the difference between the right and left UT. Differences in CSA values greater than 2.5 mm2 between sides or between sites along the same nerve can indicate asymmetry or focal thickening in neuropathy, respectively.
Objetivo: Estabelecer valores de referência da área de secção transversa (AST) dos nervos periféricos (valores absolutos e medidas de assimetria e de espessamento focal) para amostra de indivíduos brasileiros saudáveis.
Materiais e métodos: Sessenta e seis voluntários brasileiros saudáveis foram submetidos a ultrassonografia de alta resolução de nervos periféricos. As medidas da AST dos seguintes nervos periféricos foram obtidas em: mediano no túnel do carpo (MT), ulnar no túnel cubital (UT), pré-túnel ulnar (UPT) e fibular comum na cabeça da fíbula (FH). Os índices CSA foram obtidos entre os mesmos sítios em lados diferentes (ΔCSA) e entre os sítios distal e proximal do nervo ulnar (ΔTPT).
Resultados: As seguintes médias ± desvio-padrão e mediana da AST foram obtidas para os 132 sítios dos nervos periféricos analisados: MT (6,3 ± 1,9 mm2; 6,0 mm2), UT (6,2 ± 1,6 mm2; 6,1 mm2), UPT (5,6 ± 1,7 mm2; 5,4 mm2) e FH (10,0 ± 3,7 mm2; 9,9 mm2). A média ± desvio-padrão e as respectivas medianas do ΔCSA em mm2 foram: 0,85 ± 0,7 [0,95] para MT, 0,81 ± 0,62 [0,95] para UT, 0,61 ± 0,51 [0,5] para UPT, 1,0 ± 0,77 [1] para FH, e 1,0 ± 0,8 [1,0] para ΔTPT.
Conclusão: Os valores de AST tendem a ser maiores no sexo masculino, aumentando os valores absolutos das medianas das ASTs com o envelhecimento, mas não nos seus índices, ΔCSA e ΔTPT, exceto a diferença entre a AST dos nervos ulnares nos lados direito e esquerdo. Diferenças de valores de AST entre lados ou pontos no mesmo nervo maior que 2,5 mm2 podem significar neuropatia com assimetria e espessamento focal.
Keywords: Peripheral nerves/diagnostic imaging; Reference values; Ultrasonography/methods.
Figures
References
-
- Qrimli M, Ebadi H, Breiner A, et al. Reference values for ultrasonography of peripheral nerves. Muscle Nerve. 2016;53:538–544. - PubMed
-
- Peer S, Gruber H. Atlas of peripheral nerve ultrasound. Berlin Heidelberg: Springer; 2013.
-
- Beekman R, Visser LH. High-resolution sonography of the peripheral nervous system – a review of the literature. Eur J Neurol. 2004;11:305–314. - PubMed
-
- Tagliafico A, Martinoli C. Reliability of side-to-side sonographic cross-sectional area measurements of upper extremity nerves in healthy volunteers. J Ultrasound Med. 2013;32:457–462. - PubMed
LinkOut - more resources
Full Text Sources
Miscellaneous