

Role of PCIF1-mediated 5'-cap N6-methyladeonsine mRNA methylation in colorectal cancer and anti-PD-1 immunotherapy
- PMID: 36514940
- PMCID: PMC9841328
- DOI: 10.15252/embj.2022111673
Role of PCIF1-mediated 5'-cap N6-methyladeonsine mRNA methylation in colorectal cancer and anti-PD-1 immunotherapy
Abstract
Adenosine N6-methylation (m6A) and N6,2'-O-dimethylation (m6Am) are regulatory modifications of eukaryotic mRNAs. m6Am formation is catalyzed by the methyl transferase phosphorylated CTD-interacting factor 1 (PCIF1); however, the pathophysiological functions of this RNA modification and PCIF1 in cancers are unclear. Here, we show that PCIF1 expression is upregulated in colorectal cancer (CRC) and negatively correlates with patient survival. CRISPR/Cas9-mediated depletion of PCIF1 in human CRC cells leads to loss of cell migration, invasion, and colony formation in vitro and loss of tumor growth in athymic mice. Pcif1 knockout in murine CRC cells inhibits tumor growth in immunocompetent mice and enhances the effects of anti-PD-1 antibody treatment by decreasing intratumoral TGF-β levels and increasing intratumoral IFN-γ, TNF-α levels, and tumor-infiltrating natural killer cells. We further show that PCIF1 modulates CRC growth and response to anti-PD-1 in a context-dependent mechanism with PCIF1 directly targeting FOS, IFITM3, and STAT1 via m6Am modifications. PCIF1 stabilizes FOS mRNA, which in turn leads to FOS-dependent TGF-β regulation and tumor growth. While during immunotherapy, Pcif1-Fos-TGF-β, as well as Pcif1-Stat1/Ifitm3-IFN-γ axes, contributes to the resistance of anti-PD-1 therapy. Collectively, our findings reveal a role of PCIF1 in promoting CRC tumorigenesis and resistance to anti-PD-1 therapy, supporting that the combination of PCIF1 inhibition with anti-PD-1 treatment is a potential therapeutic strategy to enhance CRC response to immunotherapy. Finally, we developed a lipid nanoparticles (LNPs) and chemically modified small interfering RNAs (CMsiRNAs)-based strategy to silence PCIF1 in vivo and found that this treatment significantly reduced tumor growth in mice. Our results therefore provide a proof-of-concept for tumor growth suppression using LNP-CMsiRNA to silence target genes in cancer.
Keywords: NK cells; PCIF1; anti-PD-1 treatment; colorectal carcinoma; m6Am methylation.
© 2022 The Authors. Published under the terms of the CC BY NC ND 4.0 license.
Figures
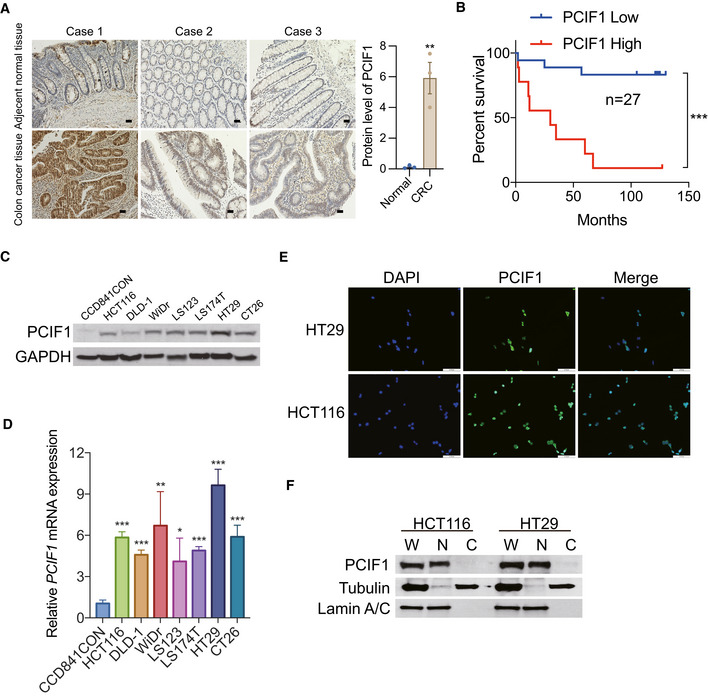
Representative images of IHC staining of PCIF1 in three CRC tissues and adjacent noncancerous tissues. Scale bar, 50 μm (left). Analysis of the PCIF1 protein expression in normal and CRC tissues. Each dot represents one sample (right). Data are the mean ± SEM. **P < 0.01, by Student's t‐test.
Kaplan–Meier plots of overall survival of 27 CRC patients with low tumor PCIF1 expression (0–4.5 staining score, n = 18) or high tumor PCIF1 expression (4.6–9.0 staining score, n = 9). Data are the mean ± SEM. ***P < 0.001 by Student's t‐test.
Western blot analysis of PCIF1 in normal colon cells (CCD841CON) and various CRC cell lines. GAPDH served as a loading control.
qRT‐PCR analysis of PCIF1 mRNA in the indicated cell lines. Levels were normalized to GAPDH expression. Data are the mean ± SD of n = 3 biological replicates. *P < 0.05, **P < 0.01, ***P < 0.001 by Student's t‐test.
Representative immunofluorescence images of HT29 and HCT116 cells stained for endogenous PCIF1 protein (green). Nuclei were stained with DAPI (blue). Scale bar, 30 μm.
Western blot analysis of PCIF1 in whole extract (W), cytosolic (C), and nuclear (N) fractions of HCT116 and HT29 cells. Tubulin and lamin A/C served as cytosolic and nuclear markers, respectively.
- A
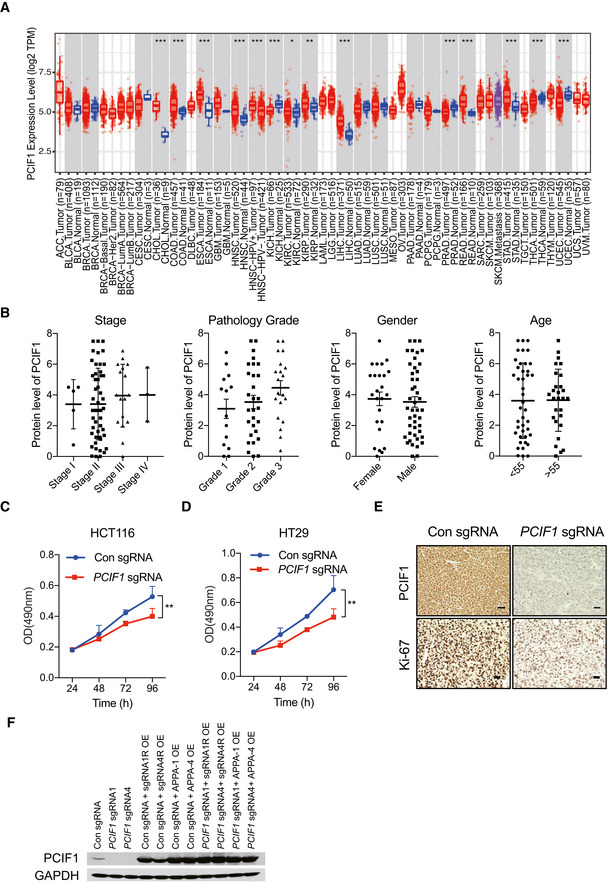
PCIF1 mRNA expression in multiple tumor tissues and adjacent normal tissues in datasets analyzed with TIMER2.0. Distributions of PCIF1 gene expression levels are displayed through boxplots. A box was draw from the first to the third quartile and the median is shown as a central band of the box. The whiskers go from each quartile to the minimum or maximum value. *P < 0.05; **P < 0.01; ***P < 0.001 computed by the Wilcoxon test.
- B
Analysis of correlations between PCIF1 expression with stage, pathology grade, gender, or age in 70 patients with CRC using IHC staining. Each dot presents one patient. Data are the mean ± SEM of the number of patients/group as indicated.
- C, D
MTS cellular proliferation assay of control and PCIF1‐depleted HCT116 and HT29 cells. Data are mean ± SD of n = 3 biological replicates. **P < 0.01 by Student's t‐tests.
- E
Representative IHC staining of PCIF1 and Ki‐67 protein in control and PCIF1‐depleted tumors. n = 3 mice/group. Scale bars, 50 μm.
- F
Western blot analysis of PCIF1 in HCT116 cells overexpressing either sgRNA resistant (sgRNA1R and sgRNA4R) wild‐type PCIF1 or catalytically inactive PCIF1 (APPA‐1 and APPA‐4) in the control and PCIF1 knockout cells.
- A
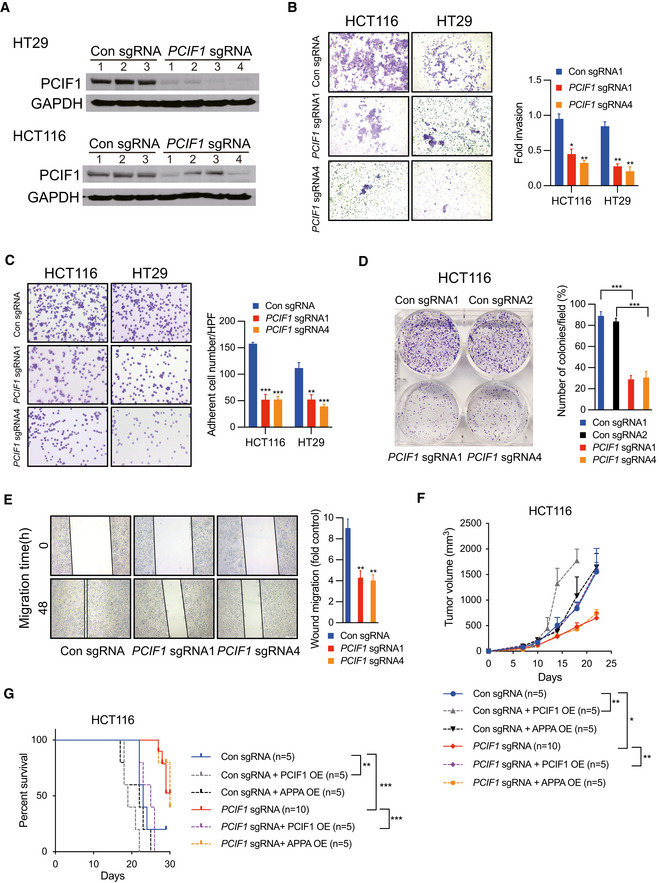
Western blot analysis of PCIF1 in HT29 and HCT116 cells depleted of PCIF1 using four different sgRNAs. GAPDH served as a loading control.
- B–E
Matrigel invasion assay (B), fibronectin adhesion assay (C), colony formation assay (D), and wound healing migration assay (E) of the indicated control and PCIF1‐depleted CRC cell lines. Representative images and quantification of cells are shown at the left and right, respectively, of each panel. Data are the mean ± SD of n = 3 replicates/condition. *P < 0.05, **P < 0.01, ***P < 0.001 by Student's t‐test.
- F
Growth of the indicated HCT116 tumors after subcutaneous injection into athymic nude mice. Tumor volume was recorded on the indicated days. Data are the mean ± SEM of the number of mice/group indicated on each panel. n, the numbers of mice. *P < 0.05, **P < 0.01 by Student's t‐test.
- G
Survival analysis of mice injected bearing the indicated HCT116 tumors. Data are the mean ± SEM of the number of mice/group indicated on each panel. n, the numbers of mice. **P < 0.01, ***P < 0.001 by Student's t‐test.
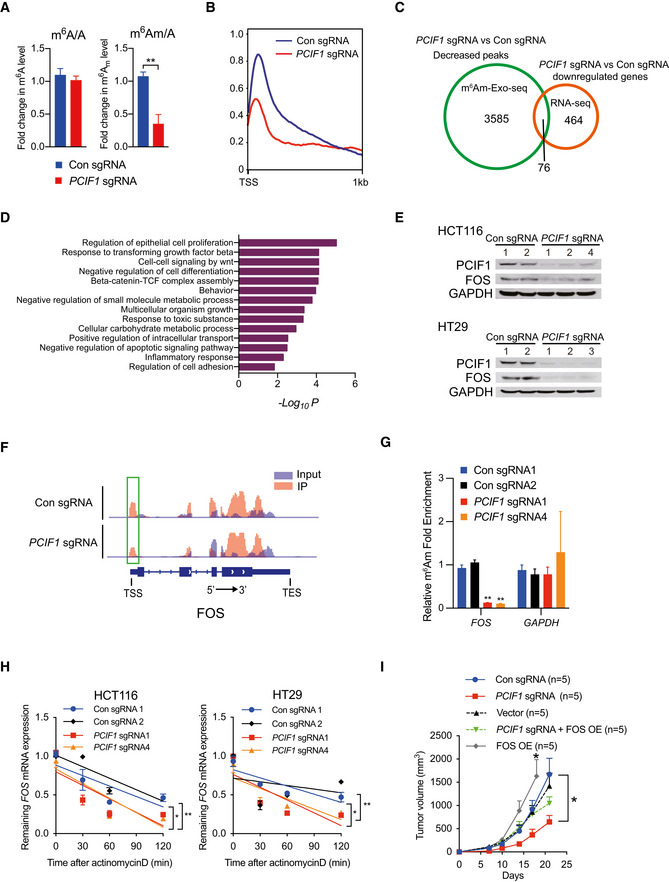
LC–MS/MS quantification of m6Am or m6A levels in mRNA from control and PCIF1‐depleted HCT116 cells. Data are presented as the enrichment of methylated vs unmethylated mRNA. Data are the mean ± SD of n = 3 biological replicates. **P < 0.01 by Student's t‐test.
Metagene plots analysis of m6Am enrichment around the transcription start site (TSS) of all expressed genes in control and PCIF1‐depleted HCT116 cells.
Venn diagram of PCIF1 peaks number, downstream genes, and identified genes from m6Am‐exo‐seq and RNA‐seq.
Meta‐enrichment analysis summary for the 76 genes identified as PCIF1 targets in HCT116 cells.
Western blot analysis of FOS and PCIF1 in control and PCIF1‐depleted HCT116 and HT29 cells. GAPDH served as a loading control.
Genome browser views of FOS with m6Am sites. Read coverage of input sample and IP sample are shown in blue and red, respectively, and green rectangle indicates the m6Am peaks located near the TSS.
m6Am‐exo‐qPCR analysis of m6Am enrichment in FOS mRNAs from the indicated HCT116 cells. GAPDH served as a negative control. Data are the mean ± SD of n = 3 biological replicates. **P < 0.01 by Student's t‐test.
qRT‐PCR analysis of FOS mRNA stability in control and PCIF1‐depleted HCT116 and HT29 cells treated with actinomycin D for the indicated times. Data are the mean ± SD of n = 3 biological replicates. *P < 0.05, **P < 0.01 by Student's t‐test.
Growth of tumors after subcutaneous injection of the indicated HCT116 cells into athymic nude mice. Tumor volumes were recorded on the indicated days. Data are the mean ± SEM of n = 5. *P < 0.05 by Student's t‐test.
- A
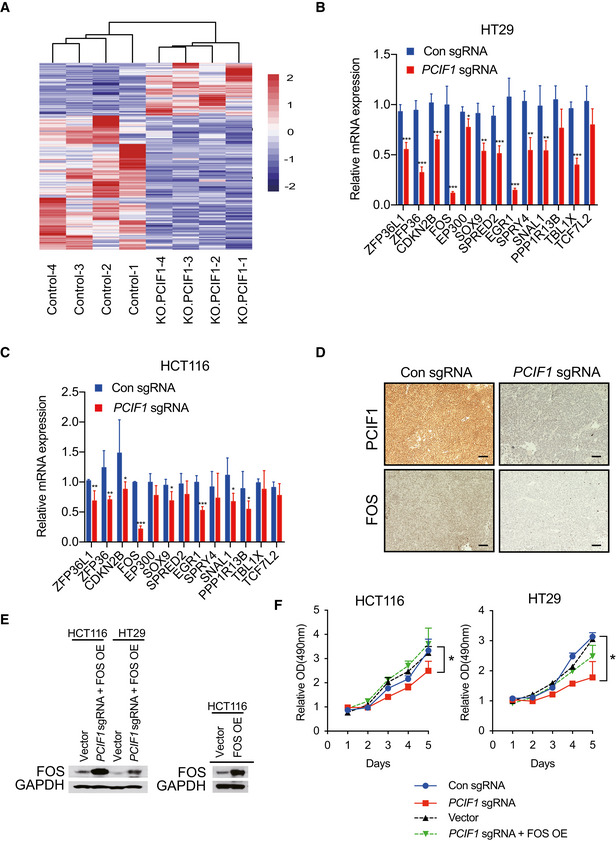
Heat map representation of differentially expressed genes in control and PCIF1‐depleted HCT116 cells analyzed by RNA‐seq. Purple and red indicate genes downregulated and upregulated, respectively, upon PCIF1 depletion.
- B, C
qRT‐PCR analysis of the indicated TGFβ pathway‐related genes (identified from Fig 3D) in control and PCIF1‐depleted HCT116 and HT29 cells. Mean ± SD of n = 3 biological replicates. *P < 0.05, **P < 0.01, ***P < 0.001 by Student's t‐test.
- D
Representative IHC staining of PCIF1 and FOS protein expression in control and PCIF1‐deficient HCT116 tumors excised from athymic nude mice. n = 3 mice/group. Scale bars, 25 μm.
- E
Western blot analysis of FOS expression in the indicated HCT116 and HT29 cells transfected with empty vector or a FOS overexpression vector. GAPDH served as a loading control.
- F
MTS proliferation assay of control and PCIF1‐depleted HCT116 and HT29 cells expressing control sgRNA, PCIF1 sgRNA, empty vector, or PCIF1 sgRNA plus FOS overexpression vector. Mean ± SD of n = 3 biological replicates. *P < 0.05 by Student's t‐test.
- A
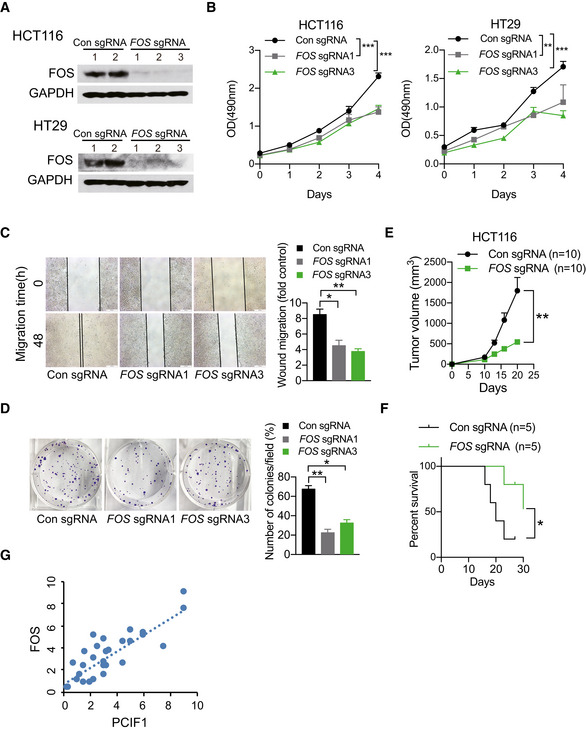
Western blot analysis of FOS in control and FOS‐depleted HCT116 and HT29 cells. GAPDH served as a loading control.
- B–D
MTS cell proliferation assay (B), wound healing migration assay (C), and colony formation assay (D) of control and FOS‐depleted HCT116 cells. Representative images and quantification of colonies are shown to the left and right, respectively. Data are the mean ± SD of n = 3 biological replicates. *P < 0.05, **P < 0.01, ***P < 0.001 by Student's t‐test.
- E
Growth of control and FOS‐depleted HCT116 tumors after subcutaneous injection into athymic nude mice. Tumor volume was recorded on the indicated days. Data are the mean ± SEM of n = 10 mice/group. **P < 0.01 by Student's t‐test.
- F
Survival analysis of mice bearing control and FOS‐depleted HCT116 tumors. Data are the mean ± SEM of n = 5 mice/group. *P < 0.05 by Student's t‐test.
- G
Positive correlation between FOS and PCIF1 protein levels in tumors from 29 patients with CRC (R 2 = 0.6902, P < 0.001).
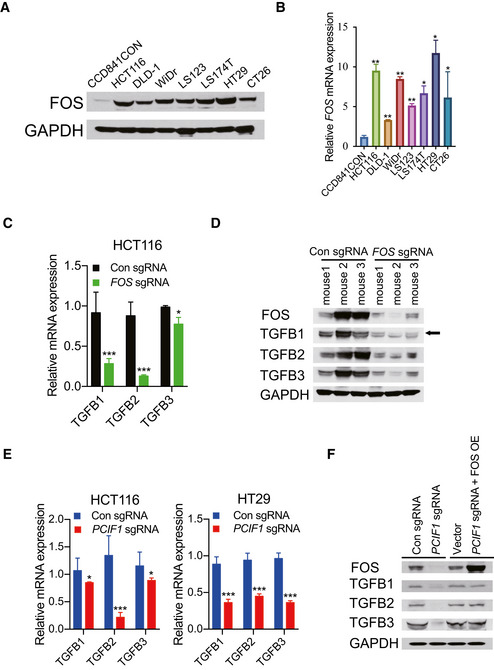
Immunoblotting analysis of PCIF1 in normal colon cells (CCD841CON) and various CRC cell lines. GAPDH served as a loading control.
PCIF1 mRNA level was analyzed by qRT‐PCR in the indicated cell lines. Levels were normalized to GAPDH expression. Data are the mean ± SD of n = 3 biological replicates. *P < 0.05, **P < 0.01 by Student's t‐test.
qRT‐PCR analysis of TGFβ1‐3 mRNA in control and FOS‐depleted HCT116 cells. Mean ± SD of n = 3 biological replicates. *P < 0.05, ***P < 0.001 by Student's t‐test.
Western blot analysis of FOS and TGFB1‐3 in control and FOS‐depleted HCT116 tumors excised from athymic nude mice. GAPDH served as a loading control.
qRT‐PCR analysis of TGFB1‐3 mRNA levels in control or PCIF1‐depleted HCT116 and HT29 cells. Mean ± SD of n = 3 biological replicates. *P < 0.05, ***P < 0.001 by Student's t‐test.
Immunoblot analysis of FOS and TGFB1‐3 proteins in control and PCIF1‐depleted HCT116 cells transfected with empty vector or a FOS overexpression vector. GAPDH served as a loading control.
- A, B
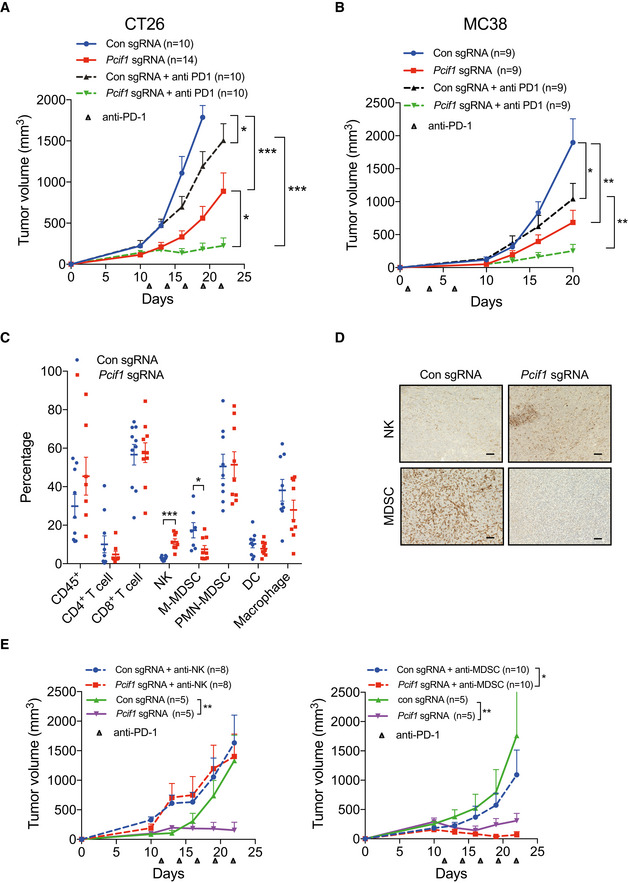
Growth of control and Pcif1‐depleted CT26 (A) and MC38 (B) tumors in BALB/c and C57 BL /6J mice, respectively, untreated or injected intraperitoneally with 200 μg anti‐PD‐1 antibody. n, number of mice. Data are the mean ± SEM of the number of mice/group indicated on each panel. *P < 0.05, **P < 0.01, ***P < 0.001 by Student's t‐test.
- C
Flow cytometric analysis of the percentage of total CD45+ lymphocytes, CD4+ T cells, CD8+ T cells, NK cells, MDSCs, DCs, and macrophages in extracts of control and Pcif1‐depleted CT26 tumors as indicated. Each spot represents individual mice. Data are the mean ± SEM of the number of mice/group as indicated. *P < 0.05; ***P < 0.001 by Student's t‐test.
- D
Representative images of IHC staining of NK and MDSC cells in control and Pcif1‐depleted CT26 tumors. n = 3 mice/group. Scale bars, 25 μm.
- E
Growth of control and Pcif1‐depleted CT26 tumors in BALB/c mice injected with 200 μg anti‐PD‐1 antibody with/without depleted of NK or MDSC cells as indicated. Data are the mean ± SEM of the number of mice/group indicated on each panel. *P < 0.05, **P < 0.01 by Student's t‐test.
- A, B
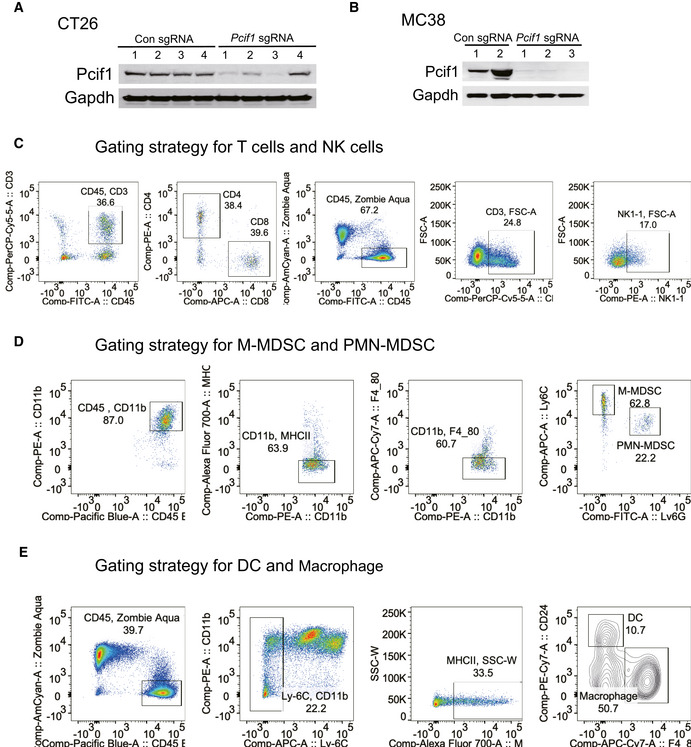
Western blot analysis of Pcif1 and Gapdh (loading control) protein in control and Pcif1‐depleted CT26 and MC38 cells.
- C
Gating strategy for T cells and NK cells.
- D
Gating strategy for M‐MDSC and PMN‐MDSC.
- E
Gating strategy for DC and macrophage.
- A
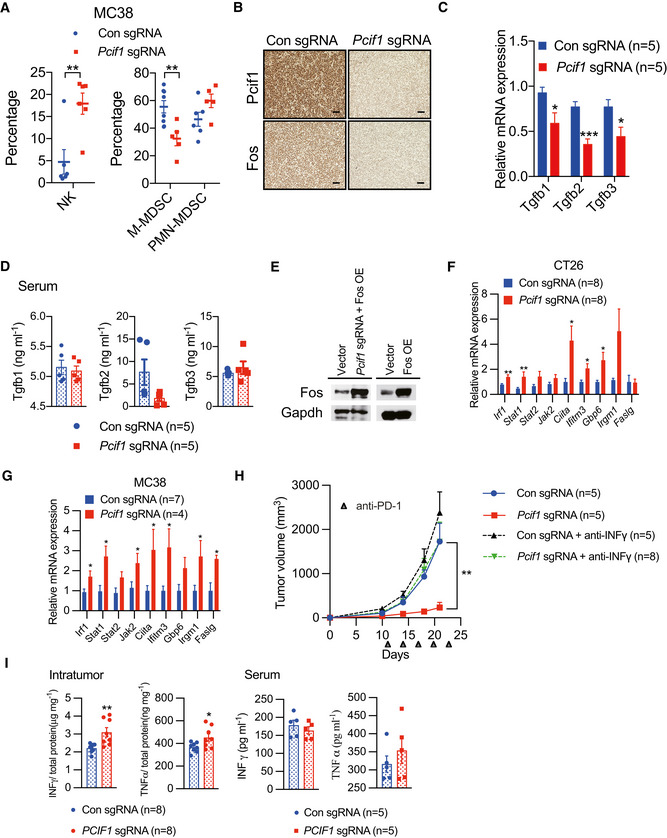
Flow cytometric analysis of the percentage of MDSCs and NK cells in extracts of control and Pcif1‐depleted MC38 tumors. Each spot represents individual mice. Data are the mean ± SEM of the indicated number of mice. **P < 0.01 by Student's t‐test.
- B
IHC staining of Pcif1 and Fos protein expression in control and Pcif1‐depleted CT26 tumors after anti‐PD‐1 antibody injection. n = 3 mice/group. Scale bars, 25 μm.
- C
qRT‐PCR analysis of Tgfb1‐3 mRNA in control and Pcif1‐depleted CT26 tumors of the indicated number of mice. Data are the mean ± SEM of n = 5 mice/group. *P < 0.05, ***P < 0.001 by Student's t‐test.
- D
Quantification of Tgfb1‐3 secretion levels in serum extracts from BALB/c mice carrying control and Pcif1‐depleted CT26 tumors by ELISA. Data are the mean ± SEM of n = 5. Symbols represent individual mice.
- E
Fos expression was validated in the indicated cells transfected with a Fos overexpression vector or empty vector by western blot.
- F, G
The indicated mRNA expression was assessed using qRT‐PCR in Pcif1‐depleted and control CT26 (F) and MC38 tumors (G). Data are the mean ± SEM of the indicated number of mice. *P < 0.05, **P < 0.01 by Student's t‐test.
- H
BALB/c mice bearing Pcif1‐deficient and control tumors were treated with PD‐1 antibody and IFN‐γ‐blocking antibody as indicated. Tumor volume was recorded over time. n, the numbers of mice. Data are mean ± SEM of the indicated number of mice. **P < 0.01 by Student's t‐tests.
- I
The production of IFN‐γ and TNFα in tumor (left) and serum (right) extracts from BALB/c mice injected with control and Pcif1‐depleted CT26 cells via ELISA. Data are the mean ± SEM of the indicated number of mice. Each spot represents individual mice. *P < 0.05, **P < 0.01 by Student's t‐test.
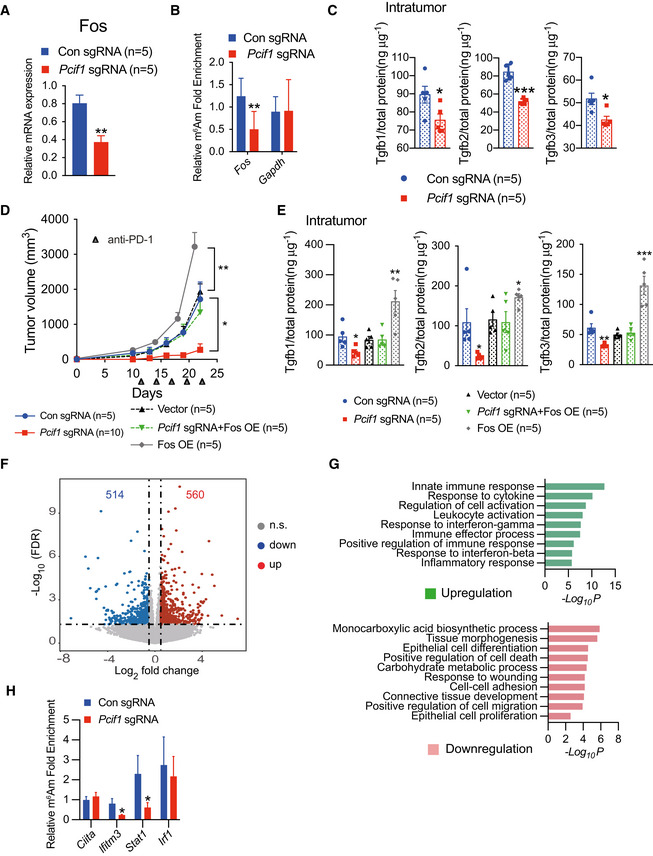
qRT‐PCR analysis of Fos mRNA expression in control and Pcif1‐depleted CT26 tumors after anti‐PD‐1 antibody injection. Data are the mean ± SEM of n = 5. **P < 0.01 by Student's t‐test.
m6Am‐exo‐qPCR analysis of m6Am enrichment in Fos mRNA in control and Pcif1‐depleted CT26 tumors. Gapdh served as a negative control. Data are the mean ± SEM of n = 3. **P < 0.01 by Student's t‐test.
ELISA quantification of Tgfb1‐3 secretion levels in tumor extracts from BALB/c mice injected with control and Pcif1‐depleted CT26 cells. Data are the mean ± SEM of n = 5. Symbols represent individual mice. *P < 0.05, ***P < 0.001 by Student's t‐test.
Tumor growth with the indicated gene edited CT26 cells in BALB/c mice treated with anti‐PD‐1 antibody. n, mouse number. Data are the mean ± SEM of the indicated mice in each group. *P < 0.05, **P < 0.01 by Student's t‐test.
Production of Tgfb1‐3 was measured by ELISA from the indicated tumors. Data are the mean ± SEM of n = 5. Symbols represent individual mice. *P < 0.05, **P < 0.01, ***P < 0.001 by Student's t‐test.
Volcano plot of differentially expression genes analyzed using DESeq2 in Pcif1‐depleted tumors compared with control. Significantly up or downregulated genes are plotted in red and blue points, respectively. n.s, nonsignificant.
Meta‐enrichment analysis summary for the significant up and down‐regulated genes identified as Pcif1 targets in CT26 tumor with PD‐1 treatment.
m6Am enrichment in the indicated mRNA was assessed in control and Pcif1‐depleted CT26 tumors by m6Am‐exo‐qPCR. Data are the mean ± SEM of n = 3. *P < 0.05 by Student's t‐test.
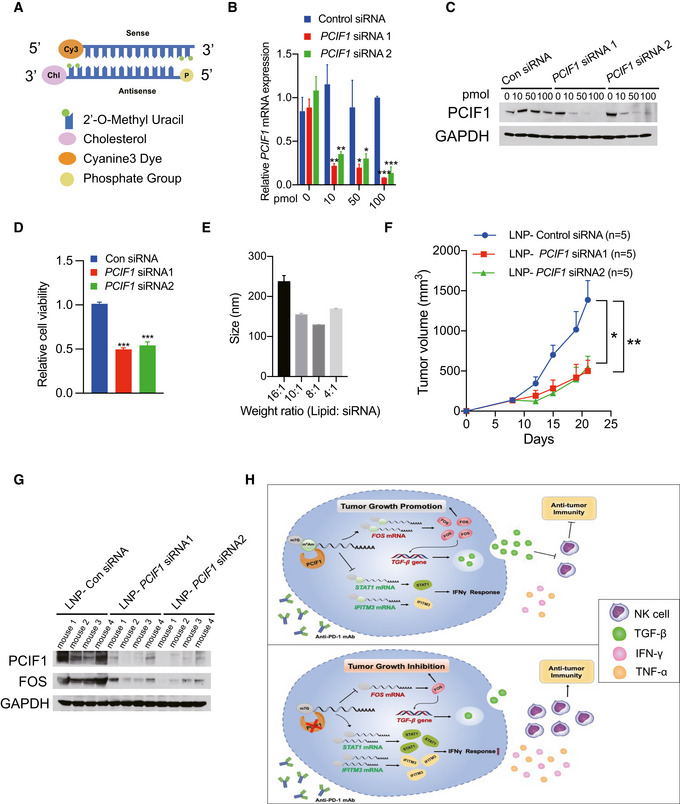
Structures of siRNAs utilized in this study.
mRNA expression of PCIF1 was quantified by qRT‐PCR in the HCT116 cells transfected with gradient amount of control and PCIF1 siRNAs. Data are the mean ± SD of n = 3 biological replicates. *P < 0.05, **P < 0.01, ***P < 0.001 by Student's t‐test.
Western blot analysis of PCIF1 in HCT116 cells with control and PCIF1 siRNAs. GAPDH served as a loading control.
Cell viability assays were performed in in the HCT116 cells transfected with 100 pmol control and PCIF1 siRNAs. Data are the mean ± SD of n = 3 biological replicates. ***P < 0.001 by Student's t‐test.
Size of LNP‐siRNA formulations were analyzed by Zetasizer. Data are the mean ± SD of n = 3 biological replicates.
Tumor growth of HCT116 cells treated with 1 mg/kg control and PCIF1 LNP‐siRNAs starting on day 9 and mice were intratumorally treated twice a week. Data are the mean ± SEM of n = 5 mice/group. *P < 0.05, **P < 0.01 by Student's t‐test.
Immunoblots of PCIF1 and FOS were carried out from the indicated tumors in four replicates with GAPDH as a loading control.
Schematic of the proposed function of PCIF1‐mediated m6Am modification in CRC.
References
-
- Akichika S, Hirano S, Shichino Y, Suzuki T, Nishimasu H, Ishitani R, Sugita A, Hirose Y, Iwasaki S, Nureki O (2019) Cap‐specific terminal N 6‐methylation of RNA by an RNA polymerase II–associated methyltransferase. Science 363: eaav0080 - PubMed
-
- Bedi RK, Huang D, Eberle SA, Wiedmer L, Caflisch A, Śledź P (2020) Small‐molecule inhibitors of METTL3, the major human epitranscriptomic writer. ChemMedChem 15: 744–748 - PubMed
-
- Calon A, Lonardo E, Berenguer‐Llergo A, Espinet E, Hernando‐Momblona X, Iglesias M, Sevillano M, Palomo‐Ponce S, Tauriello DV, Byrom D et al (2015) Stromal gene expression defines poor‐prognosis subtypes in colorectal cancer. Nat Genet 47: 320–329 - PubMed
Publication types
MeSH terms
Substances
Associated data
- Actions
Grants and funding
LinkOut - more resources
Full Text Sources
Medical
Molecular Biology Databases
Research Materials
Miscellaneous
