. 2022 Dec 14:11:e80949.
doi: 10.7554/eLife.80949.

A remarkable adaptive paradigm of heart performance and protection emerges in response to marked cardiac-specific overexpression of ADCY8

Affiliations

A remarkable adaptive paradigm of heart performance and protection emerges in response to marked cardiac-specific overexpression of ADCY8

Kirill V Tarasov et al. Elife. .

Abstract

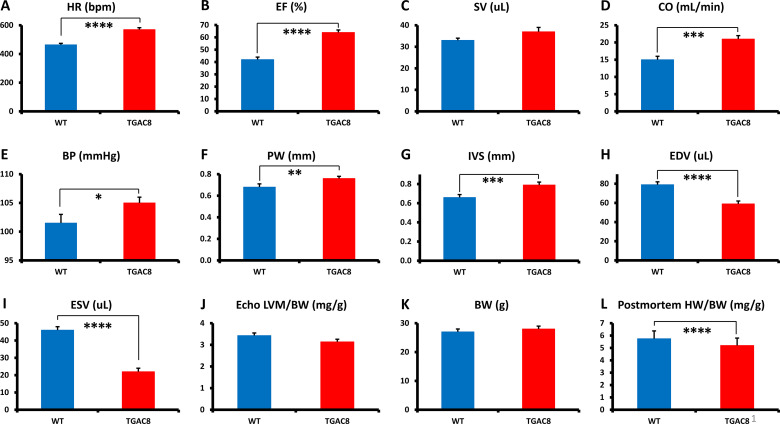
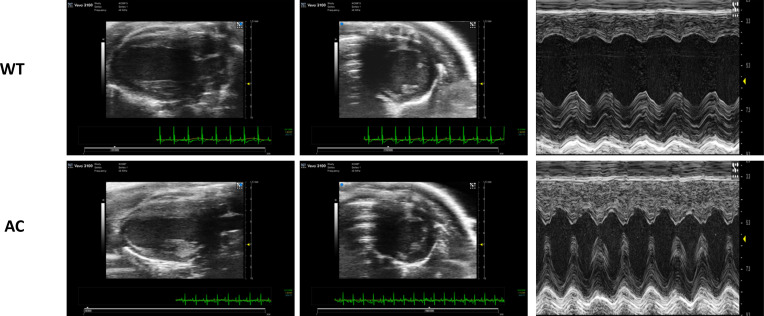
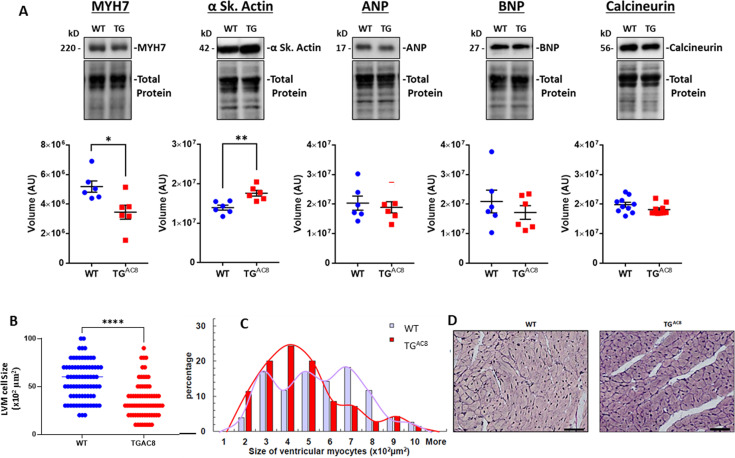
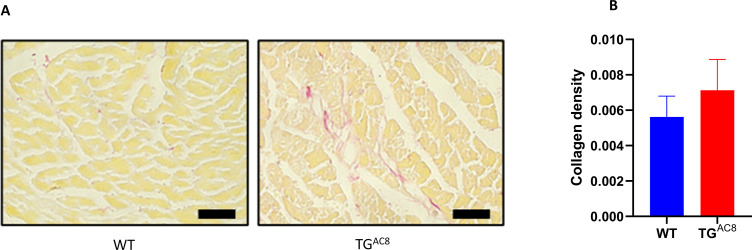
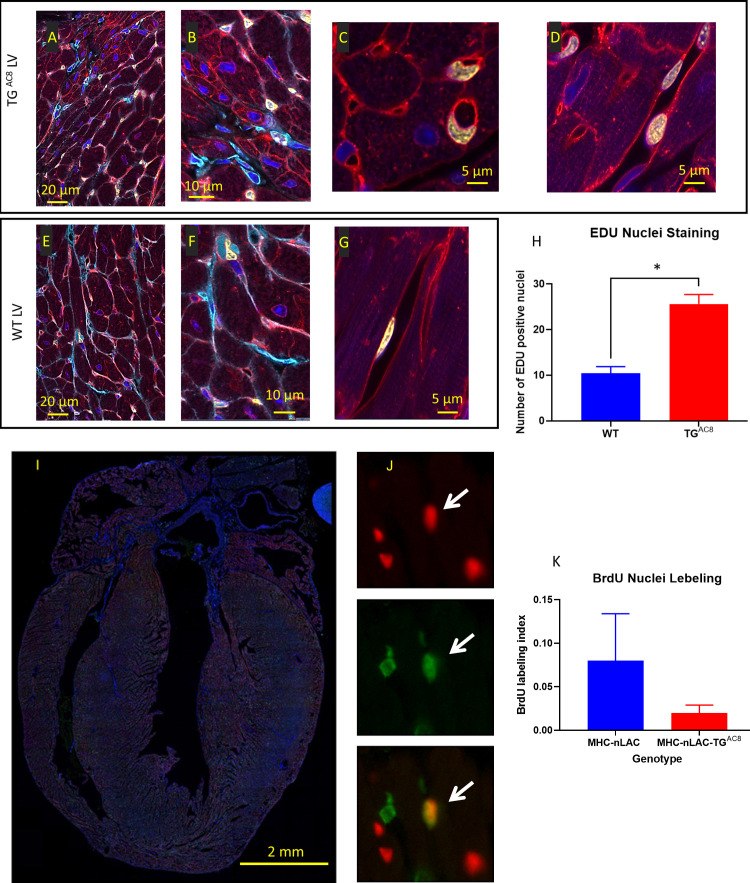
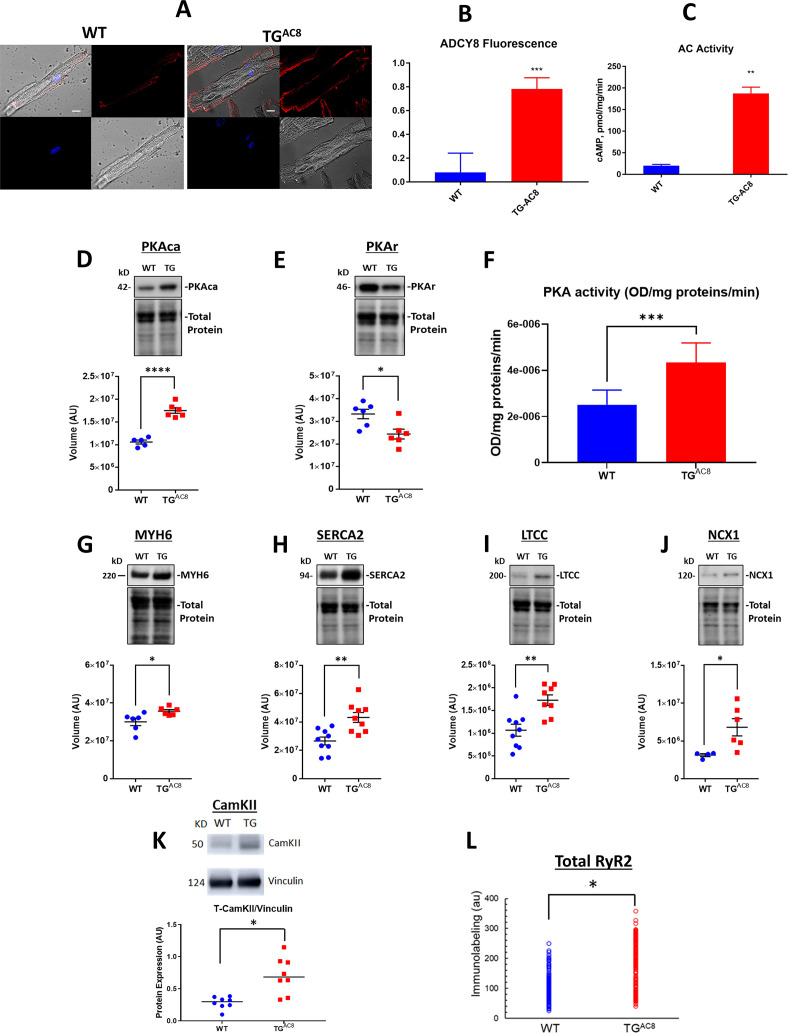
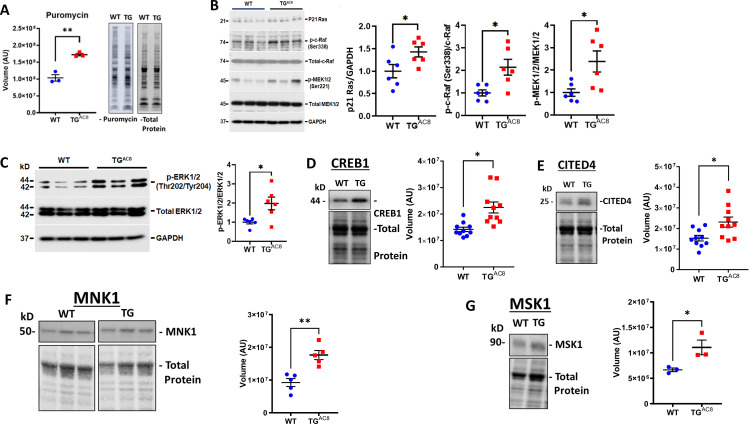
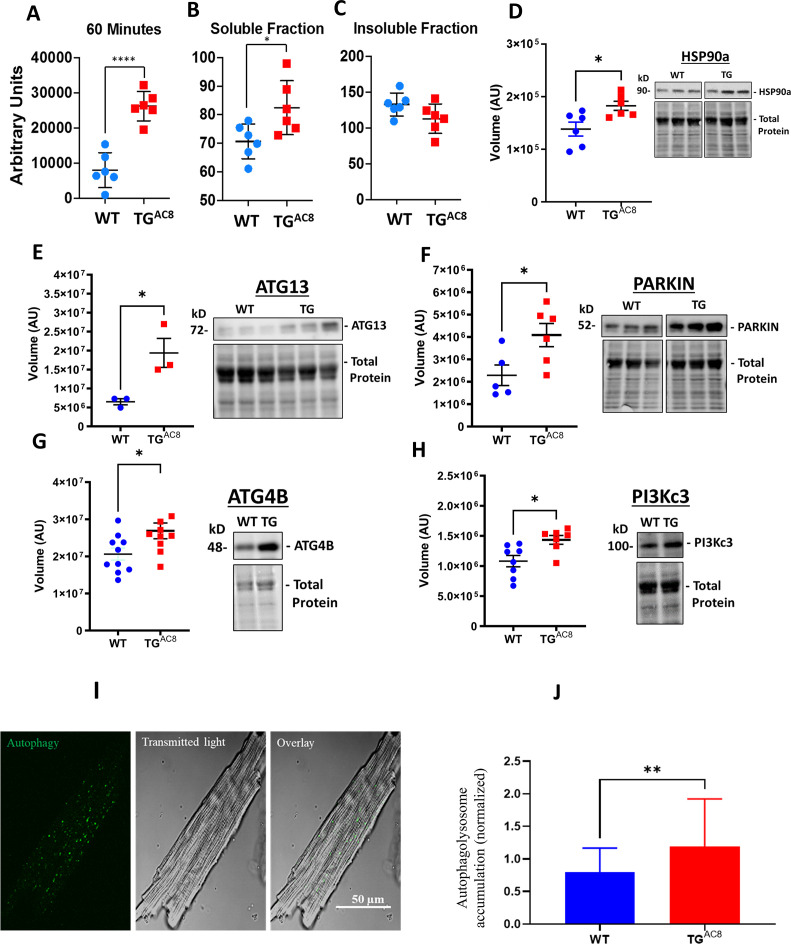
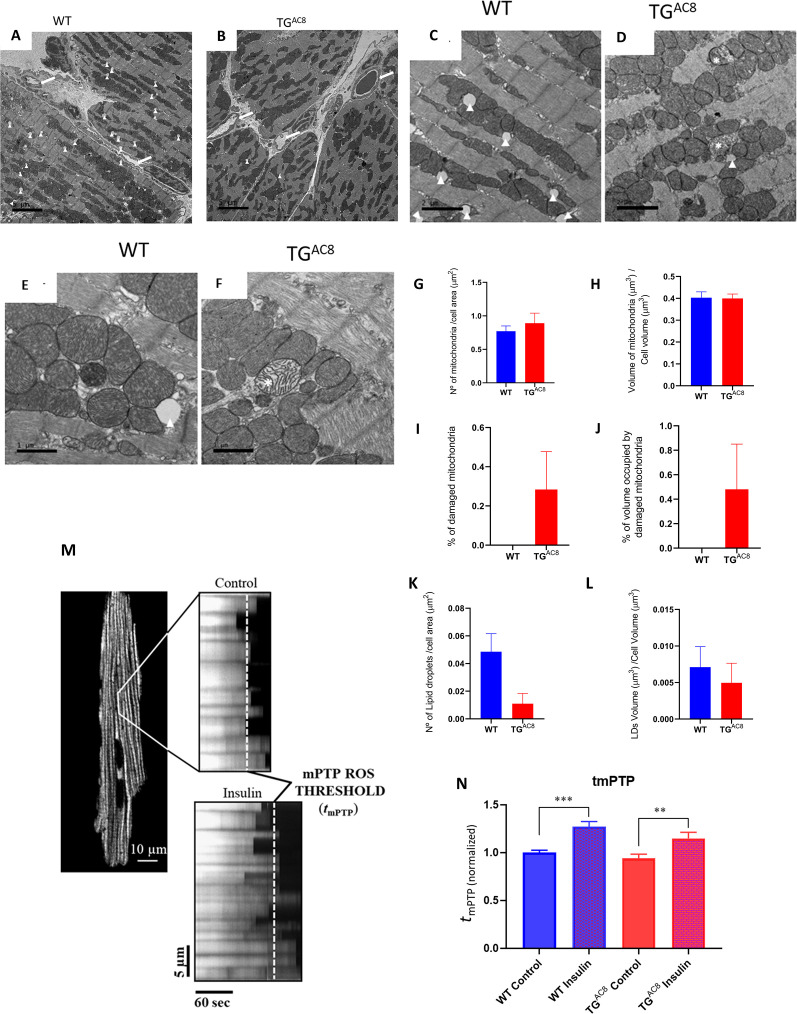
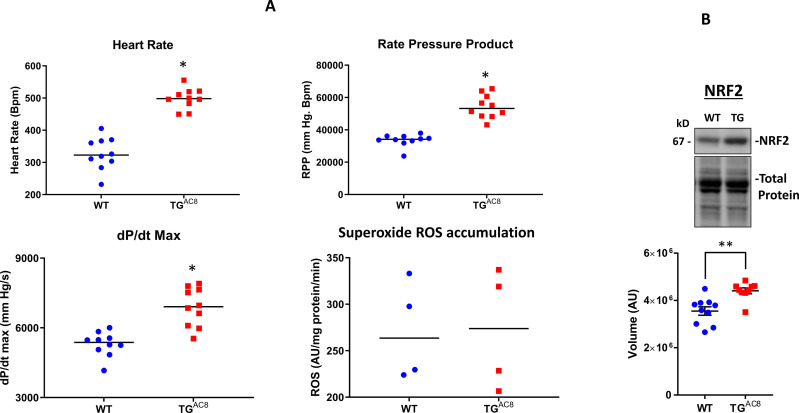
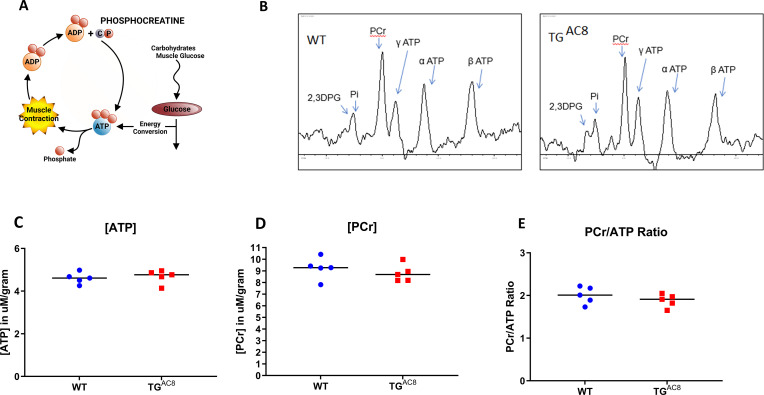
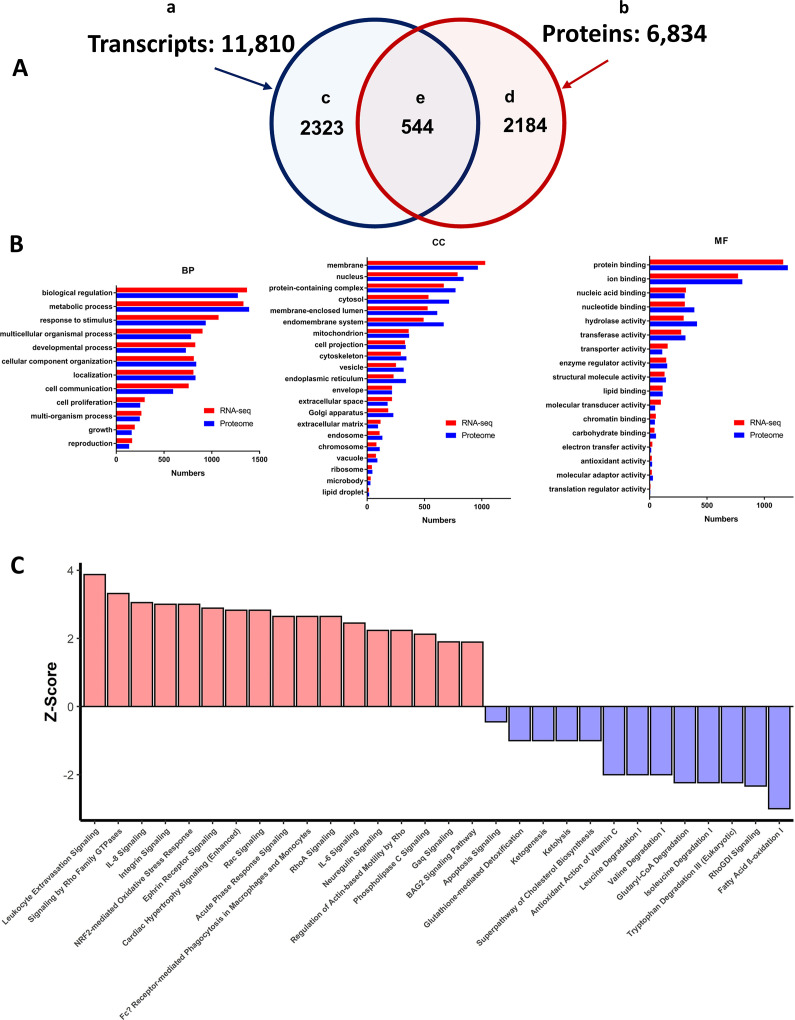
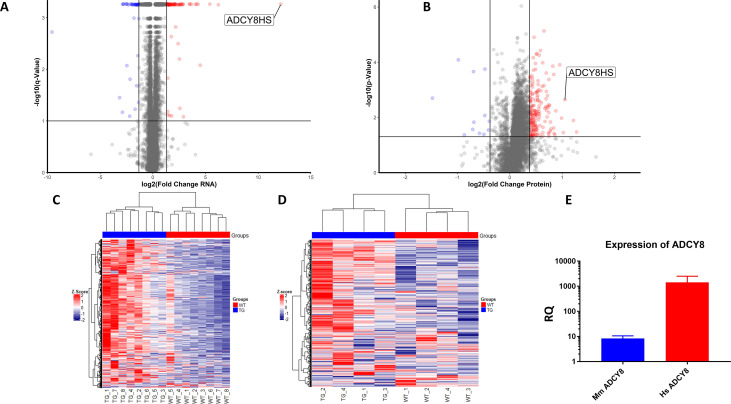
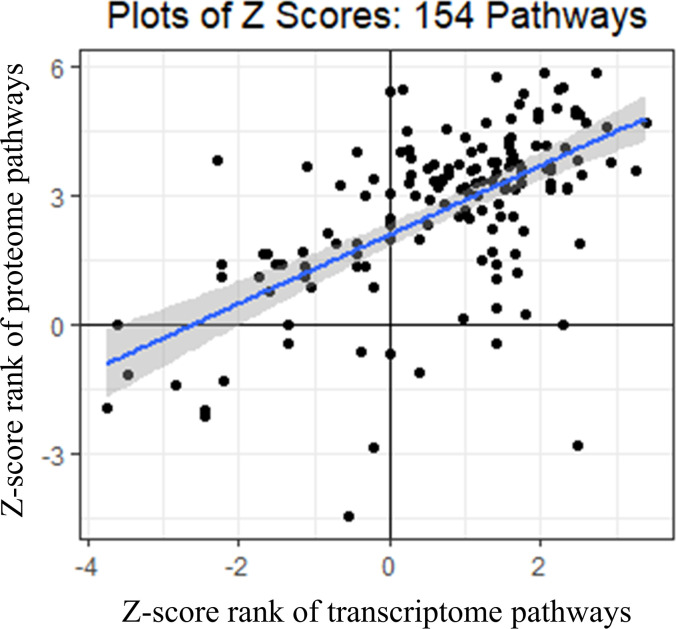
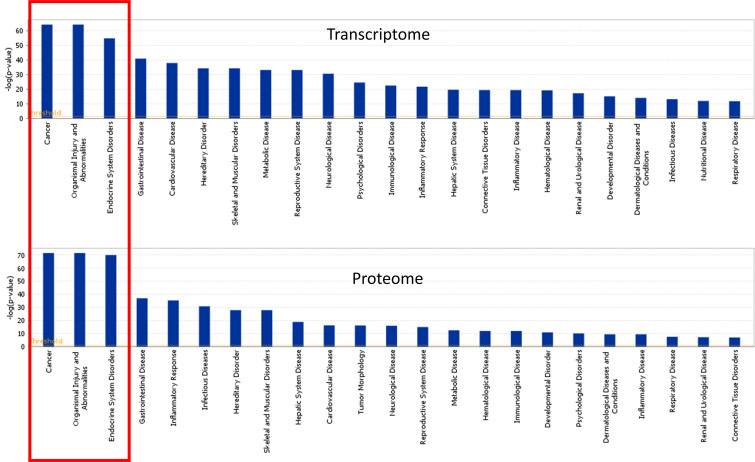
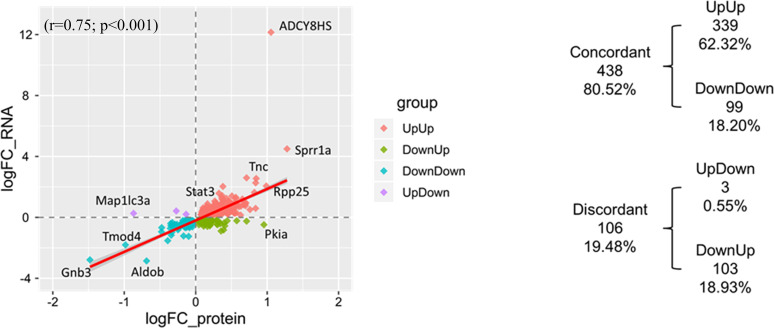
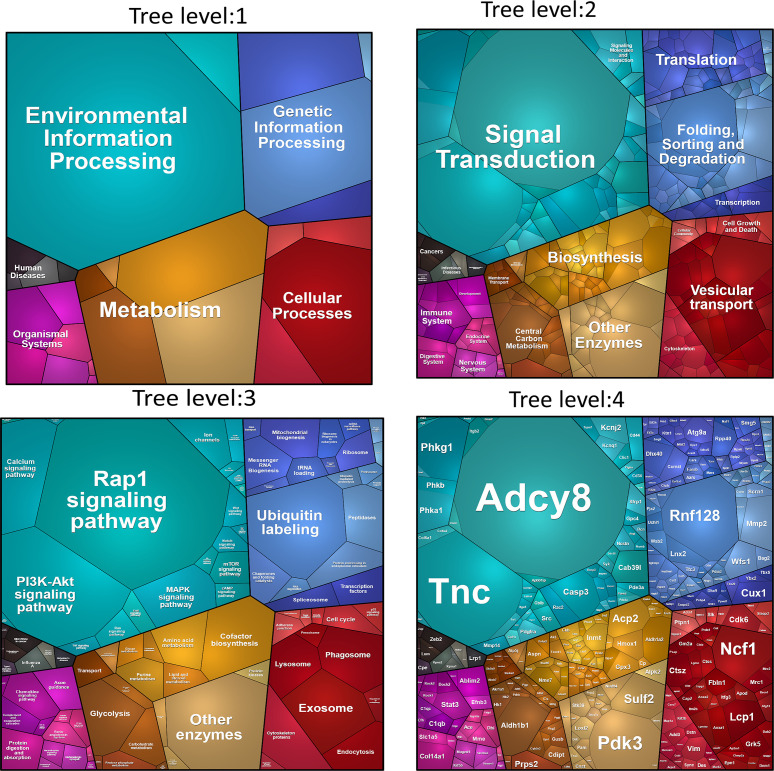
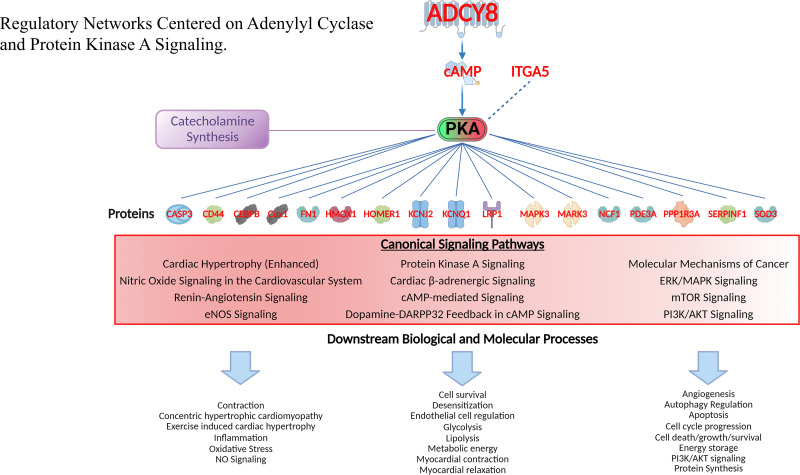
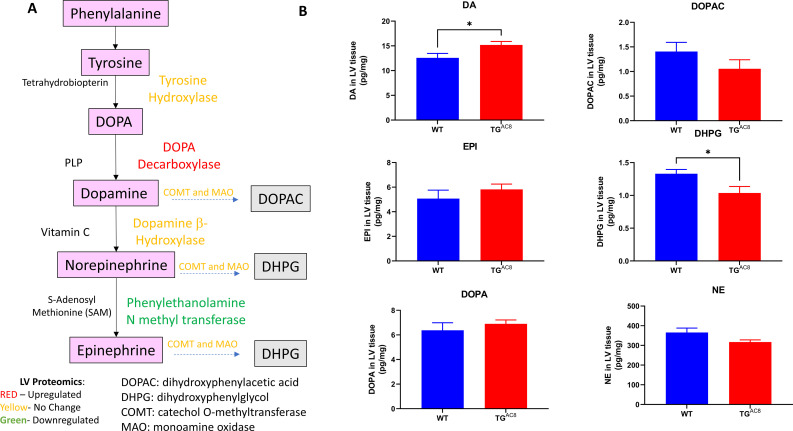
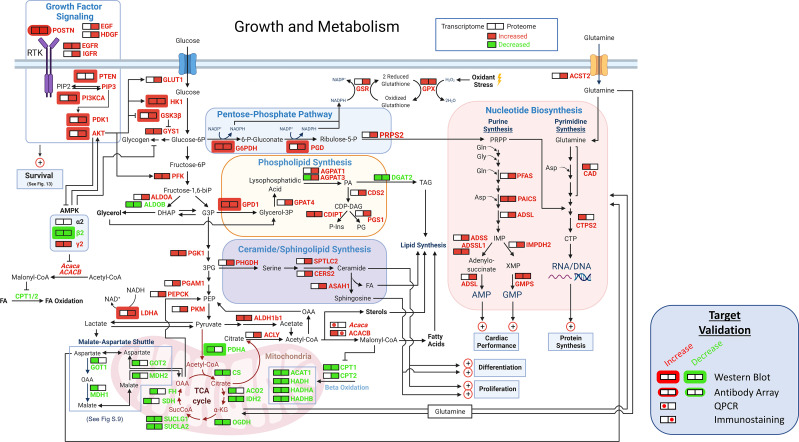
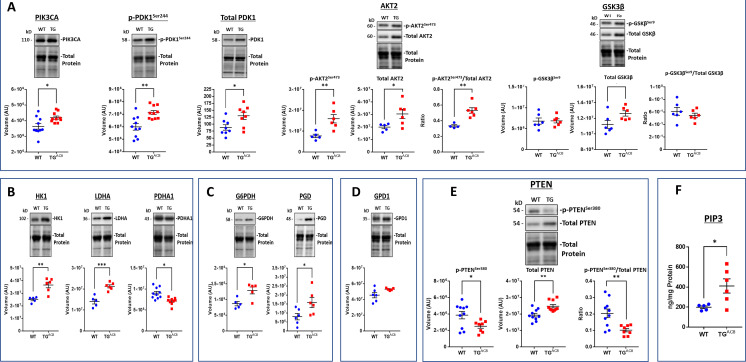
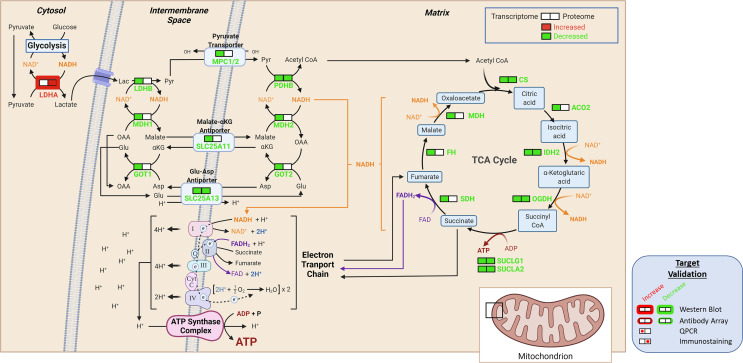
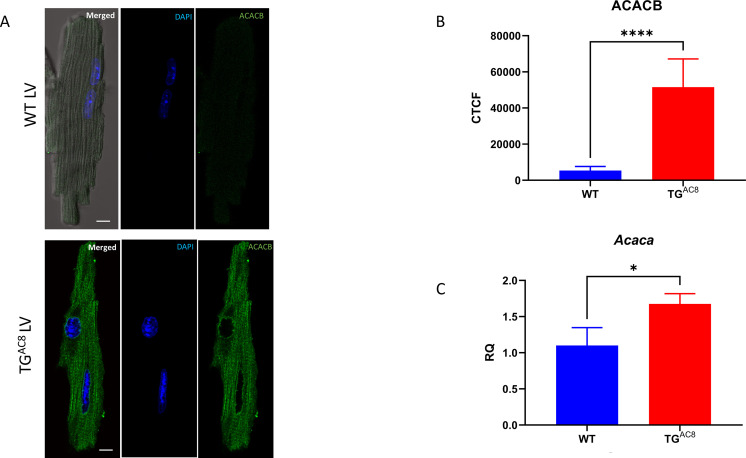
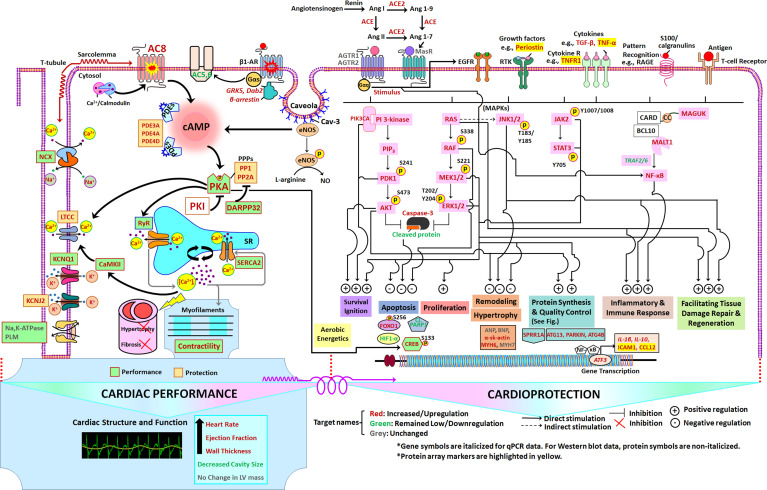
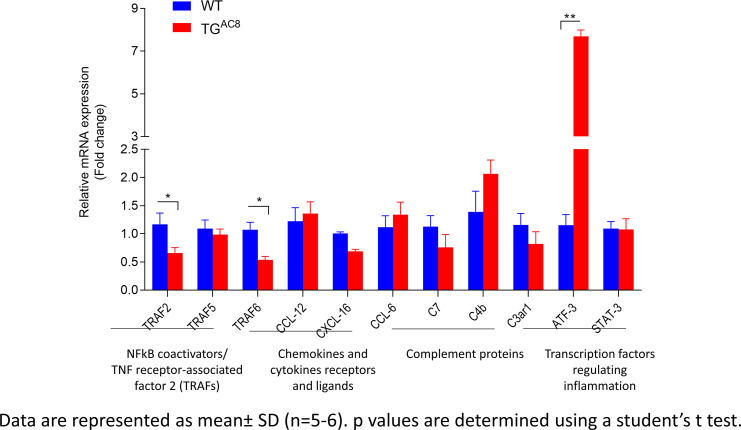
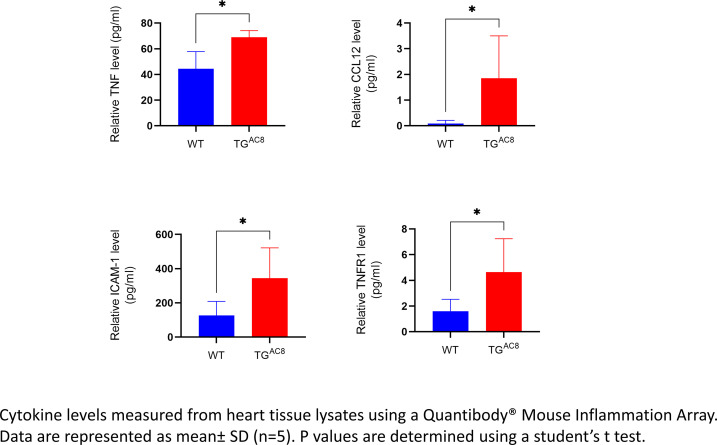
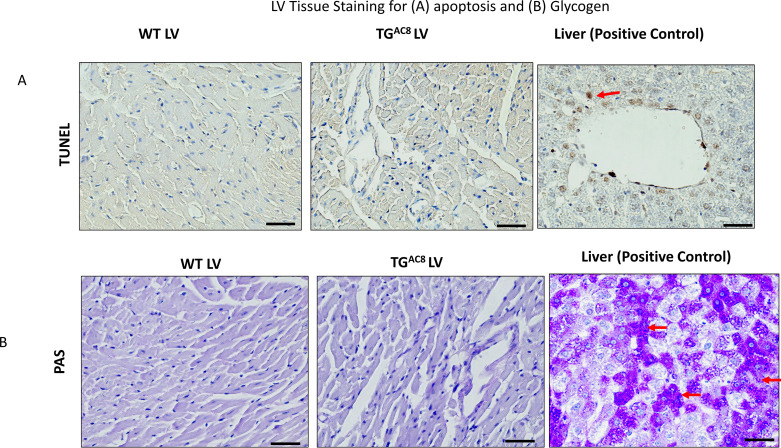
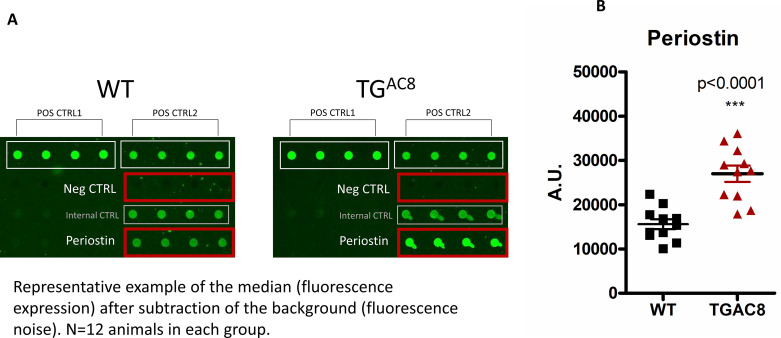
Adult (3 month) mice with cardiac-specific overexpression of adenylyl cyclase (AC) type VIII (TGAC8) adapt to an increased cAMP-induced cardiac workload (~30% increases in heart rate, ejection fraction and cardiac output) for up to a year without signs of heart failure or excessive mortality. Here, we show classical cardiac hypertrophy markers were absent in TGAC8, and that total left ventricular (LV) mass was not increased: a reduced LV cavity volume in TGAC8 was encased by thicker LV walls harboring an increased number of small cardiac myocytes, and a network of small interstitial proliferative non-cardiac myocytes compared to wild type (WT) littermates; Protein synthesis, proteosome activity, and autophagy were enhanced in TGAC8 vs WT, and Nrf-2, Hsp90α, and ACC2 protein levels were increased. Despite increased energy demands in vivo LV ATP and phosphocreatine levels in TGAC8 did not differ from WT. Unbiased omics analyses identified more than 2,000 transcripts and proteins, comprising a broad array of biological processes across multiple cellular compartments, which differed by genotype; compared to WT, in TGAC8 there was a shift from fatty acid oxidation to aerobic glycolysis in the context of increased utilization of the pentose phosphate shunt and nucleotide synthesis. Thus, marked overexpression of AC8 engages complex, coordinate adaptation "circuity" that has evolved in mammalian cells to defend against stress that threatens health or life (elements of which have already been shown to be central to cardiac ischemic pre-conditioning and exercise endurance cardiac conditioning) that may be of biological significance to allow for proper healing in disease states such as infarction or failure of the heart.

Keywords: ROS scavenging; autophagy; cardiac overexpression of human ADCY8; cell biology; left ventricle; mouse; nutrient sensing; proliferation; protection from apoptosis; protein synthesis; proteome; proteosome 35 activity; transcriptome.


Conflict of interest statement

KT, KC, DR, AL, IA, MP, AS, JZ, MW, YL, JQ, MB, MJ, YT, BZ, RT, VK, MR, JL, RB, Rd, SJ, GK, AG, DY, MA, LA, CM, WO, CC, SC, NP, TH, KP, RW, LF, SS, EL No competing interests declared

Figures

Figure 1.
Figure 1.. Echocardiographic parameters and body weight of TGAC8 and WT mice.
(A–K), Echocardiographic parameters (N=28 for TGAC8; WT = 21); (L) heart weight/body weight at sacrifice (N=75 for TGAC8 and N=85 for WT). See Supplementary file 1a for additional Echo parameters. Data are presented as Mean± SEM. The statistical significance is indicated by * p<0.05, ** p<0.01, **** p<0.0001 (t test).
Figure 1—figure supplement 1.
Figure 1—figure supplement 1.. Representative images of echocardiograms.
Figure 2.
Figure 2.. Expression of pathologic hypertrophy markers and cardiac myocyte sizes in LV of TGAC8 and WT mice.
(A) WB of Pathologic hypertrophy markers, (B, C) cardiac myocyte cross-sectional areas and distributions of cardiac myocyte sizes in TGAC8 and WT hearts (cardiomyocytes were counted on left free wall at the middle level sections from four animals in each group; 37 high power fields from WT mice and 33 high power fields from TGAC8 mice; 77 cells from WT mice and 70 cells from TGAC8 mice were analyzed) Data are presented as Mean± SEM. The statistical significance is indicated by * p<0.05, ** p<0.01, (two-tailed t test)., (D) Representative LV sections depicting cardiac myocyte diameters (scale bar 100 µm).
Figure 2—figure supplement 1.
Figure 2—figure supplement 1.. Representative LV sections, labeled with picrosirius red (A) and (B) average collagen density (picrosirius red labeling) in TGAC8 vs WT LV.
Scale bar 100 µm. N=37 high power fields of left free wall at the middle level from four WT mice. N=33 high power fields of left free wall at the middle level from four TGAC8 mice. Data are presented as Mean± SEM.
Figure 3.
Figure 3.. EdU labeling of cardiac tissue.
(A–G) representative examples of confocal images (400 x) of LV WGA (red), vimentin (Cyan), EdU (yellow), DAPI (blue), (H) average number of EdU-labeled nuclei positive field counts in LV TGAC8 vs WT (N=3 mice in each genotype). Data are presented as Mean± SEM. The statistical significance is indicated by * p<0.05, (t test). Detection of cardiomyocyte S-phase activity. (I) Section from the heart of a TGAC8, MHC-nLAC double-transgenic mouse subjected to 12 days of BrdU treatment. The section was processed for β-galactosidase (to identify cardiomyocyte nuclei, red signal) and BrdU (to identify DNA synthesis, green signal) immune reactivity, and then counterstained with Hoechst (which stains all nuclei, blue signal). (J) Example of an S-phase cardiomyocyte nucleus detected with this assay. The upper panel shows β-galactosidase immune reactivity (red channel), the middle panel shows BrdU immune reactivity (green channel), and the lower panel shows a red and green color combined image of the same field. The arrow identifies an S-phase cardiomyocyte nucleus, as evidenced by the overlay of β-galactosidase and BrdU immune reactivity, which appears yellow in the color combined image. (H) Graph representing S-phase activity in the TGAC8, MHC-nLAC double-transgenic vs. the MHC-nLAC single transgenic animals (mean +/- SEM, p=0.315; 5 mice per genotype and 3 sections per mouse were analyzed).
Figure 4.
Figure 4.. Expression of molecules involved in AC/cAMP/PKA/Ca2+ signaling in LV of TGAC8 and WT mice.
(A) Representative examples of ADCY8 immunolabeling in TGAC8 and WT LV cardiomyocytes (scale bar 10 µm), (B) Average AC8 fluorescence in LV cardiomyocytes (N=3 animals per group; 60 cells for each genotype were analyzed. Data are presented as Mean± SEM. The statistical significance is indicated by **** p<0.0001 (two-tailed t test).) and (C) Average AC activity in TGAC8 vs WT (N=3 per group), (D, E) Expression levels of PKA catalytic and regulatory subunits, and (F) PKA activity in TGAC8 vs WT (N=8 per group), (G–M) Western Blot analysis of selected proteins involved in excitation - Ca release – contraction-relaxation coupling TGAC8 vs WT LV. (L) RyR2 immunolabeling. Antibodies employed are listed in supplemental methods. (N=199 WT cells and 195 TGAC8 cells each from 3 mice). Data are presented as Mean± SEM. The statistical significance is indicated by * p<0.05, ** p<0.01, *** p<0.001,**** p<0.0001 (two-tailed t test).
Figure 5.
Figure 5.. Expression of proteins,involved in protein synthesis, degradation, and quality control in LV of TGAC8 and WT mice.
(A) Rate of global protein synthesis and (B–G) mechanisms downstream of PKA signaling involved in protein synthesis in the TGAC8 and WT. Data are presented as Mean± SEM. The statistical significance is indicated by * p<0.05, ** p<0.01,(two-tailed t test).
Figure 6.
Figure 6.. Proteosome activity assay, accumulated proteins in soluble and insoluble fractions and expression levels of selected proteins involved in the autophagy process in LV of TGAC8 and WT mice.
(A) Proteosome activity assay and (B, C) accumulated proteins in soluble and insoluble fractions of LV lysates in TGAC8 vs WT. (D) WB of HSP90 in TGAC8 and WT, (E–H) Expression levels of selected proteins involved in the autophagy process (Data are presented as Mean± SEM. The statistical significance is indicated by * p<0.05, **** p<0.0001 (two-tailed t test).). ;(I, J) Autophagolysosome accumulation is enhanced in AC8 mice (46 cells for each group; 3 aminals per genotype). Data expressed as Mean± SEM. The statistical significance is indicated by **p<0.01, and t (p<0.01 in one-tailed t test).
Figure 7.
Figure 7.. Mitochondrial structure and function.
(A, B) Representative panoramic electron micrographs (white arrows depict capillaries surrounding cardiac myocytes) and (C–F) higher resolution images of LV cardiac muscle fibers and mitochondria in TGAC8 and WT. White arrows depict lipid droplets; asterisks show swollen, disrupted mitochondria with lighter cristae compared to the surrounding, healthy mitochondria. (G, H) Average mitochondrial number of quantitative stereological analyses of normal mitochondrial number and volume, (I, J) damaged mitochondria, (K, L) number of lipid droplets per cell area and volume of lipid droplets. (M, N) mPTP-ROS threshold, measured in a single LV cardiac myocyte, did not differ between TGAC8 and WT mice. Insulin was employed as a positive control. (3 animals in each genotype; 29 cells - WT Control; 26 cells - WT insuline; 30 cells - TGAC8 control; 25 cells - TGAC8 insulin) (** p<0.01, *** p<0.001, one-way anova; Mean± SEM).
Figure 8.
Figure 8.. Detection of ROS levels and NRF signaling in LV of TGAC8 and WT mice.
(A) LV performance and the rate of superoxide (ROS) generation in isolated working TGAC8 and WT hearts. (B) WB analysis of Nrf2 expression in LV TGAC8 vs WT. Differences between two groups were assessed by a t-test, and reported as Mean± SEM; * p<0.05; ** p<0.01.
Figure 9.
Figure 9.. High-energy phosphates in TGAC8 and WT hearts.
(A) A schematic of ATP creatine energy system, (B) Representative P31 NMR spectra of TGAC8 and WT hearts. (C–E) Average levels of ATP, PCr, and ATP/PCr in TGAC8 and WT hearts derived from NMR spectra. Data are presented as Mean± SEM. The statistical significance is indicated by * p<0.05 (two-tailed t test).
Figure 10.
Figure 10.. Summary of LV transcriptome and proteome analysis of TGAC8 and WT.
(A) Schematic of the total number of transcripts (subset ‘a’ – 11,810), and proteins (subset ‘b’ 6834), identified in LV lysates, the number of transcripts (subset ‘c’ 2323), and proteins (subset ‘d’ 2184), that differed by genotype, and number of identified transcripts and proteins that both differed by genotype (subset ‘e’ - 544). (B) WEBGESTALT analysis of the 2323 transcripts (Panel A subset ‘c’) and 2184 proteins (Panel A subset ‘d’) that significantly differed by genotype. Biological Processes (BP), Cell Compartment (CC), Molecular Functions (MF). (C) Top canonical signaling pathways differing in enrichment (-log10(pvalue) >1.3) and activation status by genotype in IPA analysis of transcripts and proteins.
Figure 10—figure supplement 1.
Figure 10—figure supplement 1.. Volcano plots and heat maps of transcripts and proteins.
Figure 10—figure supplement 2.
Figure 10—figure supplement 2.. Spearman’s correlations of Z-scores of IPA canonical pathways that significantly differed by genotype in transcriptome and proteome.
Figure 10—figure supplement 3.
Figure 10—figure supplement 3.. IPA representation of top disease-related functions within the LV transcriptome and proteome of TGAC8 and WT.
Figure 10—figure supplement 4.
Figure 10—figure supplement 4.. Correlation plot of 544 identified molecules of which both transcripts and proteins differed by genotype.
Figure 10—figure supplement 5.
Figure 10—figure supplement 5.. PROTEOMAP.
Visualization of functional categories of the 544 proteins that differed by genotype. Four levels of functional tree consist of number of polygons. The areas of each polygon reflect genotypic differences in protein abundances.
Figure 11.
Figure 11.. Regulatory networks centered on adenylyl cyclase and protein kinase A signaling.
Gene families of proteins regulated by PKA ranged from transcription regulators, kinases, peptidases and other enzymes, transmembrane receptors, ion channels and other gene families. Canonical signaling pathways in which these proteins operate and downstream biological and molecular processes of proteins in these pathways are also displayed (lower part). See Supplementary file 1k for the full list of these downstream effects of PKA signaling.
Figure 11—figure supplement 1.
Figure 11—figure supplement 1.. Myocardial catecholamine levels in LV of TGAC8 and WT.
(A) Pathway for catecholamine synthesis and breakdown; (B) Myocardial catecholamine levels (N=12 for each group, Data are presented as Mean± SEM. The statistical significance is indicated by * p<0.05, (two-tailed t test).).
Figure 12.
Figure 12.. Growth and metabolism.
A schematic of growth and metabolism circuitry based on signals derived from bioinformatic analyses of the transcriptome and proteome and on selected WBs. Catabolism of glucose is markedly increased in TGAC8 vs WT as reflected in increased expression of Glut1, HK1, and PFK and other glycolytic enzymes, whilst fatty acid β oxidation pathway is concurrently reduced, as reflected in reduced expression of Cpt1, Cpt2, Acat1, Hadh, Hadha, and Hadhb. in TGAC8 vs WT LV. Shifts in the transcription of genes and translation of proteins that are operative within PPS pathway, that is G6PDH, PGD and PRPS2 suggests that PPS is more highly activated in the TGAC8 vs WT. The combination of increased expression of the glucose transporter, lactic acid dehydrogenase type A and the glutamine transporter in TGAC8, suggests that, relative to WT, the TGAC8 heart utilizes aerobic glycolysis to fulfill part of its energy needs. Enhanced growth factor and other PI3/AKT driven signaling processes increased in TGAC8 vs WT are also known to be linked to aerobic glycolysis.
Figure 12—figure supplement 1.
Figure 12—figure supplement 1.. WB analyses of selected proteins that mediate PIP3 kinase signaling and metabolism.
Data are presented as Mean± SEM. The statistical significance is indicated by * p<0.05, ** p<0.01, *** p<0.001, (two-tailed t test).
Figure 12—figure supplement 2.
Figure 12—figure supplement 2.. Detailed schematic malate-aspartate shuttle based on signals derived from bioinformatic analyses of the transcriptome and proteome and on selected WBs.
Figure 12—figure supplement 3.
Figure 12—figure supplement 3.. Representative examples of (A) ACACB immunolabeling of TGAC8 and WT LV myocytes (scale bar 10 µm); (B) average ACACB fluorescence in LV cardiomyocytes (n=25 for each group); (C) Relative Quantification of Acaca mRNA expression in LV tissue (n=4 for each group).
Data are presented as Mean± SEM. The statistical significance is indicated by * p<0.05, **** p<0.0001 (two-tailed t test).
Figure 13.
Figure 13.. Schematic of TGAC8 heart performance and protection circuits that appeared to be concurrently engaged in the TGAC8 LV.
The pathways/specific targets and the effector functions/outcomes culminating from the regulation of the components within the circuits in the pathways are represented according to published literature with respect to cardiac-specific context (see Discussion). Pink colors represent proteins that differed by genotype in WB. Molecular targets or components in red, green, and grey represent molecular targets or components that are increased or upregulated, decreased or downregulated, or unchanged, respectively, in TGAC8 vs WT.
Figure 13—figure supplement 1.
Figure 13—figure supplement 1.. WB analyses of selected proteins within the performance and protection circuitry depicted in Figure 13.
Negative feedback adaptations on AC/PKA signaling.Data are presented as Mean± SEM. The statistical significance is indicated by * p<0.05, ** p<0.01, *** p<0.001, **** p<0.0001 (two-tailed t test).
Figure 13—figure supplement 2.
Figure 13—figure supplement 2.. WB analysis of selected proteins involved in Jak/Stat/Jnk/Caspase signaling.
Data are presented as Mean± SEM. The statistical significance is indicated by * p<0.05, ** p<0.01 (two-tailed t test).
Figure 13—figure supplement 3.
Figure 13—figure supplement 3.. WB analysis of selected proteins involved in angiotensin receptor signaling Data are presented as Mean± SEM.
The statistical significance is indicated by * p<0.05, ** p<0.01, *** p<0.001, **** p<0.0001 (two-tailed t test).
Figure 13—figure supplement 4.
Figure 13—figure supplement 4.. WB analysis of Calnexin and Calreticulin, proteins involved in ER protein processing Data are presented as Mean± SEM.
The statistical significance is indicated by * p<0.05, ** p<0.01 (two-tailed t test).
Figure 13—figure supplement 5.
Figure 13—figure supplement 5.. RT-qPCR analysis of genes regulating cytokines level in the LV.
The statistical significance is indicated by * p<0.05, ** p<0.01.
Figure 13—figure supplement 6.
Figure 13—figure supplement 6.. Cytokine levels measured from heart tissue lysates.
The statistical significance is indicated by * p<0.05.
Figure 13—figure supplement 7.
Figure 13—figure supplement 7.. LV tissue staining for apoptosis and glycogen.
Scale bar 100 µm.
Figure 13—figure supplement 8.
Figure 13—figure supplement 8.. Periostin levels detected in TGAC8 vs WT LV (growth factor quantibody array).
Data are presented as Mean± SEM (two-tailed t test).
Figure 13—figure supplement 9.
Figure 13—figure supplement 9.. SPRR1A signaling network and Immunolabeling of SPRR1A.
(A) SPRR1A signaling network, (B) Immunolabeling of SPRR1A in isolated LV myocytes, and (C) WB analysis of RTN4 expression. Data are presented as Mean± SEM. The statistical significance is indicated by **** p<0.0001 (two-tailed t test).

References

    1. Abeyrathna P, Su Y. The critical role of akt in cardiovascular function. Vascular Pharmacology. 2015;74:38–48. doi: 10.1016/j.vph.2015.05.008. - DOI - PMC - PubMed
    1. Adamo L, Staloch LJ, Rocha-Resende C, Matkovich SJ, Jiang W, Bajpai G, Weinheimer CJ, Kovacs A, Schilling JD, Barger PM, Bhattacharya D, Mann DL. Modulation of subsets of cardiac B lymphocytes improves cardiac function after acute injury. JCI Insight. 2018;3:e120137. doi: 10.1172/jci.insight.120137. - DOI - PMC - PubMed
    1. Adamo L, Rocha-Resende C, Prabhu SD, Mann DL. Reappraising the role of inflammation in heart failure. Nature Reviews Cardiology. 2020;17:269–285. doi: 10.1038/s41569-019-0315-x. - DOI - PubMed
    1. Antos CL, Frey N, Marx SO, Reiken S, Gaburjakova M, Richardson JA, Marks AR, Olson EN. Dilated cardiomyopathy and sudden death resulting from constitutive activation of protein kinase a. Circulation Research. 2001;89:997–1004. doi: 10.1161/hh2301.100003. - DOI - PubMed
    1. Antos CL, McKinsey TA, Frey N, Kutschke W, McAnally J, Shelton JM, Richardson JA, Hill JA, Olson EN. Activated glycogen synthase-3 beta suppresses cardiac hypertrophy in vivo. PNAS. 2002;99:907–912. doi: 10.1073/pnas.231619298. - DOI - PMC - PubMed

Publication types

Substances

Associated data