. 2023 May 2;192(1):85-101.
doi: 10.1093/plphys/kiac574.

Cell-type-specific alternative splicing in the Arabidopsis germline

Affiliations

Cell-type-specific alternative splicing in the Arabidopsis germline

Chandra Shekhar Misra et al. Plant Physiol. .

Abstract

During sexual reproduction in flowering plants, the two haploid sperm cells (SCs) embedded within the cytoplasm of a growing pollen tube are carried to the embryo sac for double fertilization. Pollen development in flowering plants is a dynamic process that encompasses changes at transcriptome and epigenome levels. While the transcriptome of pollen and SCs in Arabidopsis (Arabidopsis thaliana) is well documented, previous analyses have mostly been based on gene-level expression. In-depth transcriptome analysis, particularly the extent of alternative splicing (AS) at the resolution of SC and vegetative nucleus (VN), is still lacking. Therefore, we performed RNA-seq analysis to generate a spliceome map of Arabidopsis SCs and VN isolated from mature pollen grains. Based on our de novo transcriptome assembly, we identified 58,039 transcripts, including 9,681 novel transcripts, of which 2,091 were expressed in SCs and 3,600 in VN. Four hundred and sixty-eight genes were regulated both at gene and splicing levels, with many having functions in mRNA splicing, chromatin modification, and protein localization. Moreover, a comparison with egg cell RNA-seq data uncovered sex-specific regulation of transcription and splicing factors. Our study provides insights into a gamete-specific AS landscape at unprecedented resolution.


Conflict of interest statement

Conflict of interest statement. None declared.

Figures

Figure 1
Figure 1
Flow diagram summarizing steps for the analysis of genome-wide AS in Arabidopsis SC and VN. A, Scheme showing FACS sorting strategy of GFP positive (MGH3p::MGH3-eGFP) SCs and RFP positive (ACT11p::H2B-mRFP) VN (Borges et al., 2008), followed by RNA-seq library preparation, sequencing, read assembly, and quantification. B, Flow chart depicting pipeline for analysis of AS. C, Example of a gene undergoing differential expression at the gene level or AS level. D, Different forms of AS events. SSC, side scatter.
Figure 2
Figure 2
Transcriptome of Arabidopsis SC, VN, and EC. A, Hierarchical clustering of the three different cell types. B, Box plot representation of gene expression in SC, VN, and EC. C, Venn diagram showing the overlap between expressed genes between the three cell types at average TPM ≥ 1. D, Venn diagram showing overlap of expressed genes in SCs as detected by microarrays (Borges et al., 2008) and RNA-seq.
Figure 3
Figure 3
Differential expression analysis at gene and transcript level. A, Flowchart depicting analysis of gene expression and AS between SCs and VN, including numbers of DE and DAS genes. B, Bar plots showing the number of DE and DAS genes, separated by upregulated (∧) and downregulated (∨). C, Functional enrichment of DE genes between SC and VN. D, Functional enrichment of DAS genes between SC and VN. For details, see Supplemental Table 5.
Figure 4
Figure 4
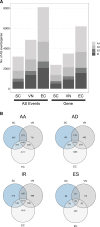
Sex-specific AS in the Arabidopsis germline. A, Bar plot showing the distribution of four predominant forms of AS events in SC, VN, and EC, respectively: ES, exon skipping; IR, intron retention; AA, alternative acceptor site; AD, alternative donor site. The four bars on the right depict the corresponding number of genes undergoing these four different types of AS. B, Venn diagrams depicting the number of overlapping AS events between the three cell types. For details, see Supplemental Table 6.
Figure 5
Figure 5
Comparison of AS landscape in germ cells of several plant species. A,B, AS landscape in maize SC and EC, respectively. C–E, AS landscape in rice SC, VN, and EC. F–H, AS landscape in Arabidopsis SC, VN, and EC.
Figure 6
Figure 6
Isoform level dynamics in SCs and VN. A–C, Expression level (TPM) of individual isoforms that are differentially expressed between SCs and VN, representing examples of complex splicing patterns. D–F, Expression levels (TPM) of isoforms of genes depicting simple cases of isoform switching. G–I, Changes in the isoform fraction of the corresponding genes are shown in (D–F). The error bar indicates the Sd across three biological replicates (n = 3).
Figure 7
Figure 7
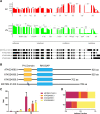
AS of the Rho GTPase-activating gene REN1 (AT4G24580). A, Sashimi plot showing AT4G24580 gene generating four different transcript isoforms detected with our RNA-seq pipeline. Peaks in red (SC) and green (VN) represent read coverage, and curved lines with numbers in red and green represent splice junctions supported by that number of reads (Y-axis). For each transcript isoform, the blocks in black represent exons, and the lines between the blocks represent introns. The number at the base of the sashimi plot represents the genomic coordinate. B, Protein length and domain predictions for the respective isoforms. C, Expression level (TPM) of individual isoforms that are differentially expressed and spliced between SCs and VN. D, Changes in the isoform fraction of the corresponding gene shown in (C). The error bar indicates the Sd across three biological replicates (n = 3).
Figure 8
Figure 8
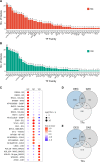
Transcriptional regulation in male and female germlines. Number of TFs per family expressed in SC (A) and VN (B). The number on top of each bar indicates the total number TFs genes present in a given family. C, Dot plot showing the expression of 25 most variable TFs across the three cell types. D, Venn diagram showing the number of TFs differentially expressed (DEG) or spliced (DAS) between SC and EC. E, Venn diagram showing the number of TFs differentially expressed or spliced between and SC and VN. For detailed information, see Supplemental Table 8.
Figure 9
Figure 9
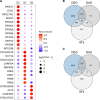
Splicing regulation in the three cell types. A, Dot plot showing the expression of 25 most variable splicing factors across the three cell types. B, Venn diagram showing the number of splicing factors differentially expressed (DEG) or spliced (DAS) between SC and EC. C, Venn diagram showing the number of splicing factors differentially expressed or spliced between SC and VN. For detailed information, see Supplemental Table 8.

References

    1. Adamczyk BJ, Fernandez DE (2009) MIKC* MADS domain heterodimers are required for pollen maturation and tube growth in Arabidopsis. Plant Physiol 149(4): 1713–1723 - PMC - PubMed
    1. Anderson SN, Johnson CS, Jones DS, Conrad LJ, Gou X, Russell SD, Sundaresan V (2013) Transcriptomes of isolated Oryza sativa gametes characterized by deep sequencing: evidence for distinct sex-dependent chromatin and epigenetic states before fertilization. Plant J 76(5): 729–741 - PubMed
    1. Barakate A, Orr J, Schreiber M, Colas I, Lewandowska D, McCallum N, Macaulay M, Morris J, Arrieta M, Hedley PE, et al. (2020) Barley anther and meiocyte transcriptome dynamics in meiotic prophase I. Front Plant Sci 11: 619404. - PMC - PubMed
    1. Baralle FE, Giudice J (2017) Alternative splicing as a regulator of development and tissue identity. Nat Rev Mol Cell Biol 18(7): 437–451 - PMC - PubMed
    1. Bedre R, Irigoyen S, Schaker PDC, Monteiro-Vitorello CB, Da Silva JA, Mandadi KK (2019) Genome-wide alternative splicing landscapes modulated by biotrophic sugarcane smut pathogen. Sci Rep 9(1): 8876. - PMC - PubMed

Publication types

Substances