. 2023 Feb 6;220(2):e20221717.
doi: 10.1084/jem.20221717. Epub 2022 Dec 14.

Progressive differentiation toward the long-lived plasma cell compartment in the bone marrow

Affiliations

Progressive differentiation toward the long-lived plasma cell compartment in the bone marrow

Takuya Koike et al. J Exp Med. .

Abstract

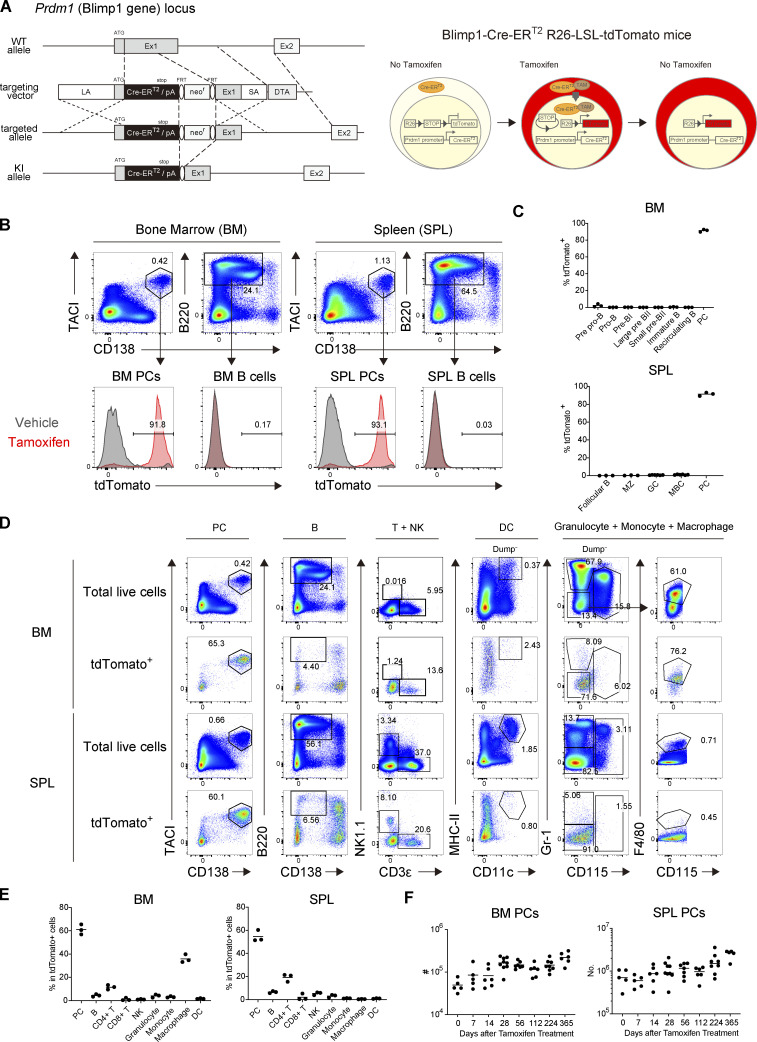
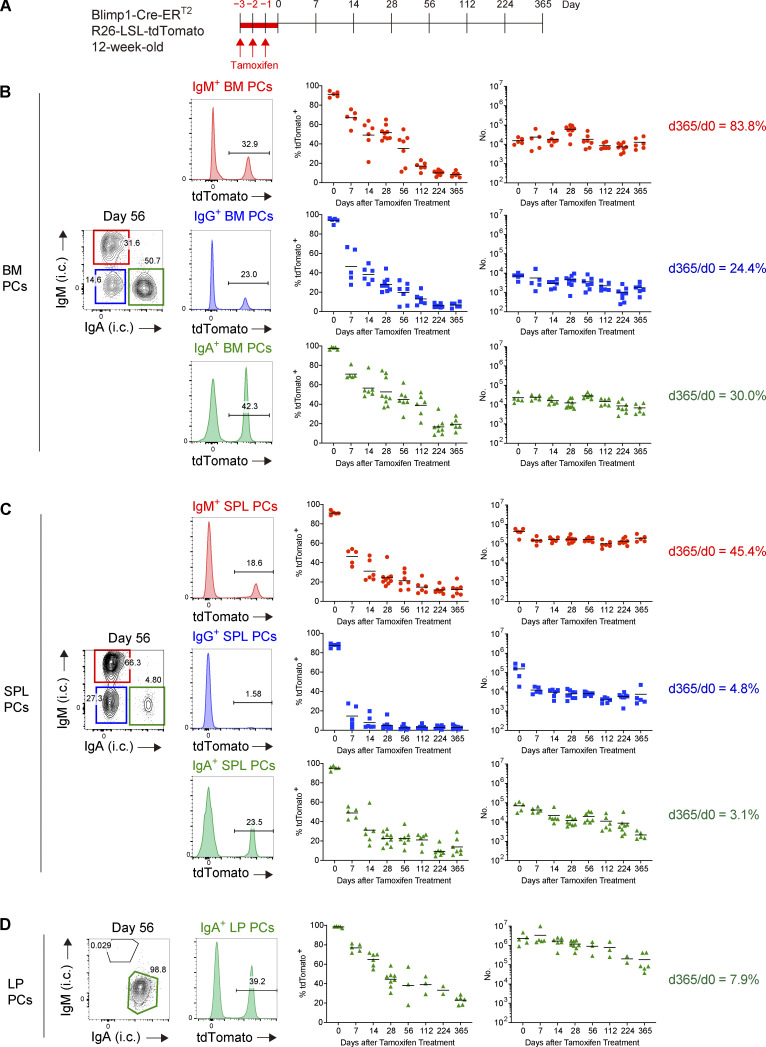
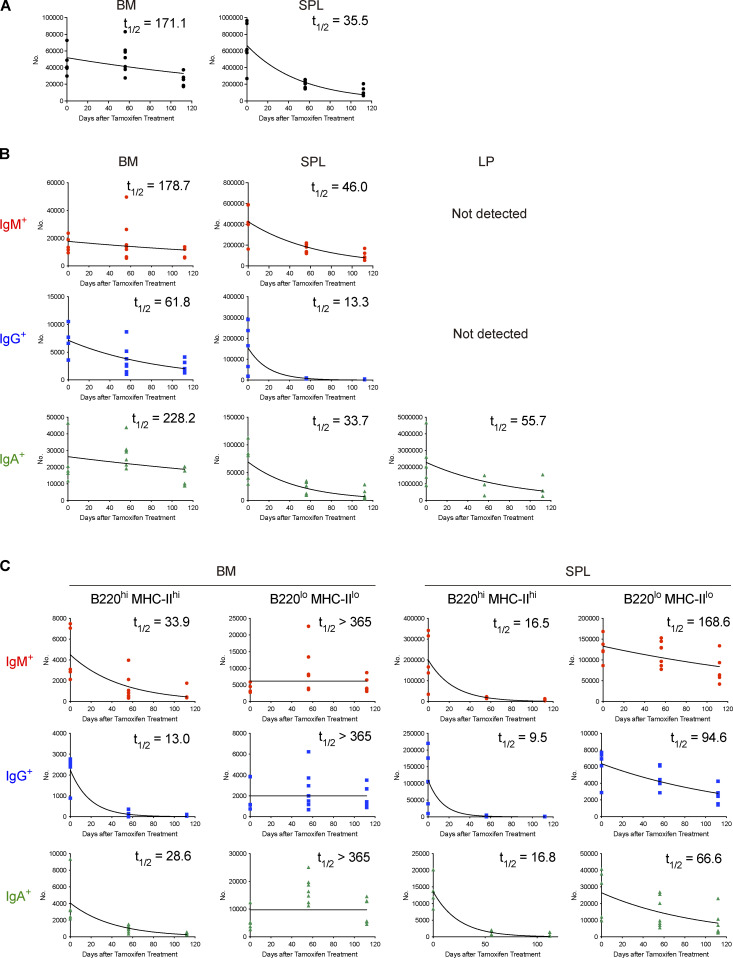
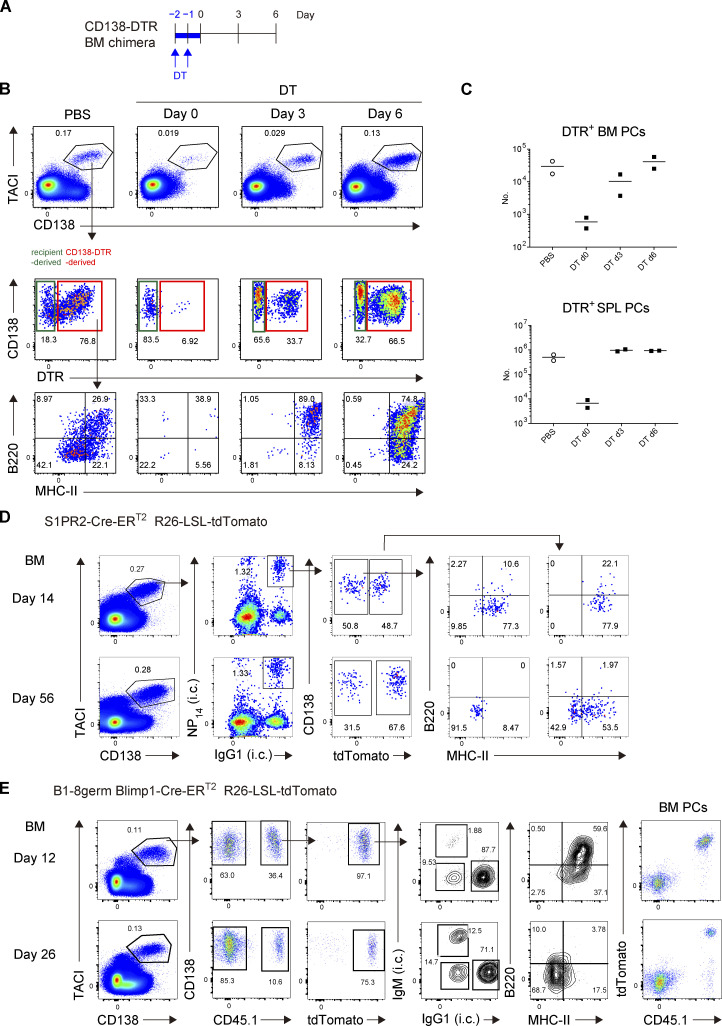
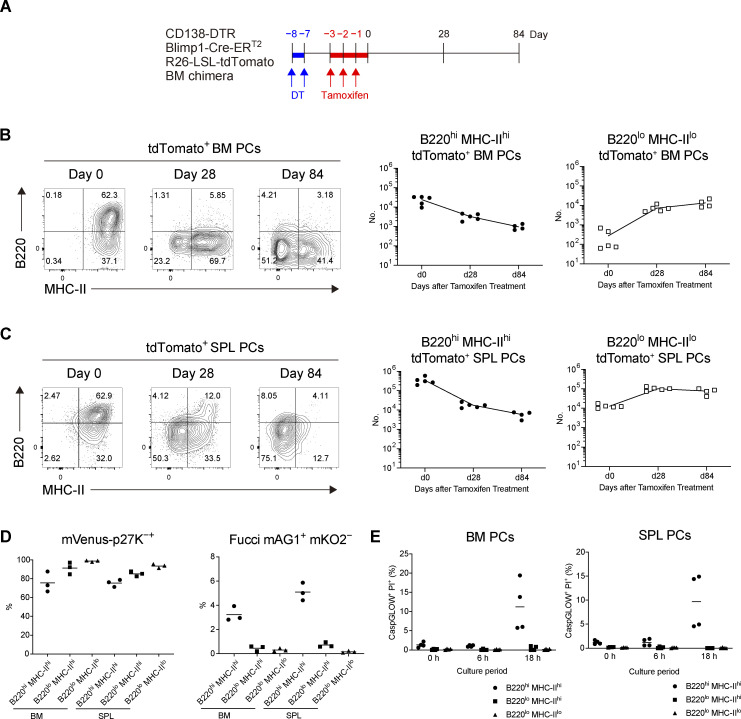
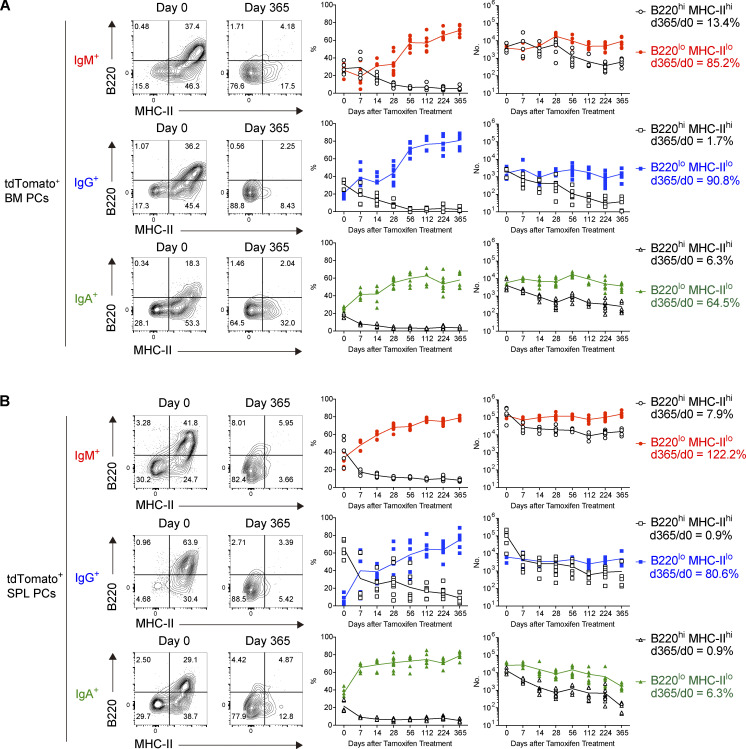
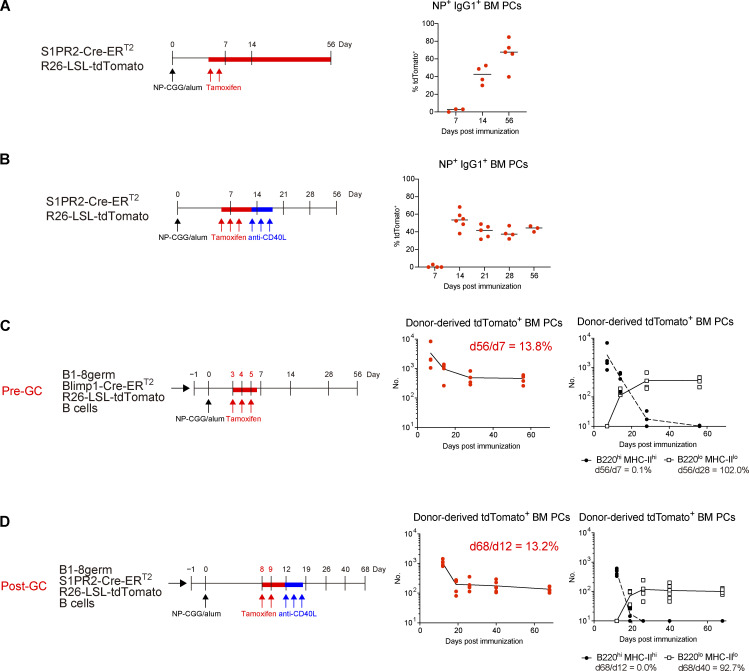
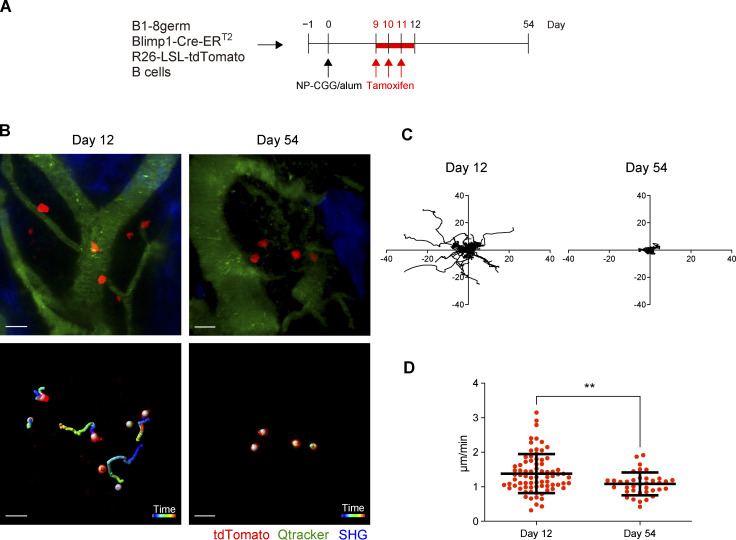
The longevity of plasma cells is dependent on their ability to access and reside in so-called niches that are predominantly located in the bone marrow. Here, by employing a traceable method to label recently generated plasma cells, we showed that homeostatic plasma cells in the bone marrow and spleen were continuously replenished by newly generated B220hiMHC-IIhi populations that progressively differentiated into B220loMHC-IIlo long-lived plasma cell (LLPC) populations. We also found that, in the bone marrow, germinal center (GC)-independent and GC-dependent plasma cells decayed similarly upon NP-CGG engagement, and both entered the B220loMHC-IIlo LLPC pool. Compared with NP+B220hiMHC-IIhi plasma cells, NP+B220loMHC-IIlo cells were more immobilized in the bone marrow niches and showed better survival potential. Thus, our results suggest that the adhesion status of bone marrow plasma cells is dynamically altered during their differentiation and is associated with provision of survival signals.


Conflict of interest statement

Disclosures: The authors declare no competing interests exist.

Figures

Figure S1.
Figure S1.
Establishment of the PC fate mapping system. (A) Schematic representation of the generation of Blimp1-CreERT2 knock-in mice (left) and the PC-linage tracing system using Blimp1-CreERT2 R26-LSL-tdTomato mice (right). (B and C) Blimp1-CreERT2 R26-LSL-tdTomato mice were treated with tamoxifen for 3 d. (B) The expression of tdTomato in PCs (CD138+ TACI+) or B cells (B220+ CD138) in SPL or BM. Data are representative of three independent experiments. (C) The frequency of tdTomato+ cells in B cells or PCs in SPL and BM after tamoxifen treatment of Blimp1-CreERT2 R26-LSL-tdTomato mice. Three mice each were analyzed. (D and E) The frequency of each immune cell type expressing tdTomato. Three mice were analyzed. Data are representative of two independent experiments. (F) Absolute numbers of total BM PCs and SPL PCs analyzed in Fig. 1. Five to seven mice were analyzed at each time point. Data collected from 14 independent experiments are combined.
Figure 1.
Figure 1.
Homeostatic PC turnover in BM, SPL, and LP. (A–D) Blimp1-Cre-ERT2 R26-LSL-tdTomato mice were treated with tamoxifen for 3 d. At the indicated time points after tamoxifen treatment, PCs in each organ were analyzed by FCM. The details of the mice and the experimental system are shown in Fig. S1. (A) Schematic of the experimental procedure. (B–D) Intracellular (i.c.) IgM or IgA expression (contour plots), tdTomato expression (histograms) by PCs of each isotype at day 56 after tamoxifen treatment (IgG+ PCs were defined as IgG+/IgM/IgA). The right two columns show the frequency and the absolute numbers of tdTomato+ cells for PCs of each isotype at the indicated time points in BM (B), SPL (C), and LP (D). Five to nine mice for PCs in BM or SPL or two to eight mice for PCs in LP were analyzed at each time point. Data collected from 14 independent experiments are combined in the right two columns.
Figure S2.
Figure S2.
Half-life of PC populations. (A) Half-lives (t1/2) of tdTomato+ total PCs in BM and SPL calculated from data shown in Fig. 1. Five to seven mice were analyzed at each time point. (B) Half-lives (t1/2) of IgM+, IgG+, and IgA+ tdTomato+ PCs in BM, SPL, and LP calculated from data shown in Fig. 1. Five to seven mice were analyzed at each time point. (C) Half-lives (t1/2) of IgM+, IgG+, and IgA+ tdTomato+ PC subsets (B220hi MHC-IIhi or B220lo MHC-IIlo) in BM and SPL calculated from data shown in Fig. 3. Five to seven mice were analyzed at each time point. Data collected from six independent experiments are combined for calculation of PC half-lives.
Figure S3.
Figure S3.
Gating strategy for identifying de novo–generated homeostatic PCs or NP-specific PCs. (A–C) Depletion and de novo generation of PCs in CD138-DTR BM chimeric mice. (A) Schematic of the experimental procedure. The BM chimeric mice were generated by transfer of BM cells from CD138-DTR mice into x-ray irradiated mice, which were treated with PBS or DT for 2 d. Donor cell-derived PCs in BM, which could be distinguished from residual host-derived PCs by expression of DTR, were analyzed by FCM at the indicated time points. (B) Representative FCM data showing expression of DTR by PCs or B220/MHC-II expression by DTR+ PCs at the indicated time points. (C) Absolute number of donor-derived PCs in SPL (upper) or BM (lower) at the indicated time points after DT treatment. Two mice were analyzed at each time point. (D) Gating strategy for identifying NP-specific PCs in Fig. 4 A. S1pr2-CreERT2 R26-LSL-tdTomato mice were immunized with NP-CGG in alum and treated with tamoxifen from days 5 and 6 after immunization. On day 14 and 56, single-cell suspensions were prepared from the BM and stained with cocktails of fluorescent antibodies or an NP probe and analyzed by FCM. Data are representative of two independent experiments. (E) Gating strategy for identifying B1-8germ PCs. B6 mice were transferred with splenic B cells from B1-8germ Blimp1-CreERT2 R26-LSL-tdTomato mice, immunized with NP-CGG in alum, and then treated with tamoxifen from day 9 to 11 after immunization. BM cells were analyzed by FCM on day 12 and 26. Data are representative of three independent experiments.
Figure 2.
Figure 2.
Differentiation of B220loMHC-IIlo PCs from B220hiMHC-IIhi PCs. (A and B) BM chimeric mice were generated by transfer of BM cells from CD138-DTR Blimp1-CreERT2 R26-LSL-tdTomato mice into x-ray irradiated mice. In the chimeric mice, pre-existing PCs derived from donor BM cells were depleted by DT treatment (Fig. S3, A–C), and de novo–generated PCs from the same BM cell origin were subsequently labeled by tamoxifen administration. These tdTomato+ PCs were analyzed by FCM at the indicated time points. (A) Schematic of the experimental procedure. (B and C) The expression of B220 and MHC-II on tdTomato+ PCs and the absolute numbers of B220hiMHC-IIhi and B220loMHC-IIlo tdTomato+ PCs in BM (B) and SPL (C) at the indicated time points after tamoxifen treatment. Four or five mice were analyzed at the indicated time points. (D) Cell cycle status of each PC subset from SPL or BM analyzed by using mVenus-p27K- mice (left, G0) and Fucci mice (right, S, G2, M). Three mice each were analyzed. (E) The frequency of late apoptotic (CaspGLOW+ PI+) cells in each PC subset after in vitro culture for the indicated times. PCs isolated from four mice were analyzed. Data are representative of two independent experiments.
Figure 3.
Figure 3.
Identification of B220loMHC-IIlo long-lived PCs. (A and B) The frequencies of B220hiMHC-IIhi and B220loMHC-IIlo tdTomato+ PCs of each isotype, and their absolute numbers in BM (A) and SPL (B) at the indicated time points using the same experimental procedure as shown in Fig. 1. Five to nine mice were analyzed at each time point. Data collected from 14 independent experiments are combined.
Figure 4.
Figure 4.
Survival of GC-independent and GC-derived PCs. (A) S1PR2-CreERT2 R26-LSL-tdTomato mice were immunized with NP-CGG in alum and then treated with tamoxifen on days 5 and 6. The frequency of tdTomato+ cells among NP+ IgG1+ BM PCs at the indicated time points is shown. Four or five mice were analyzed at the indicated time points. (B) S1PR2-CreERT2 R26-LSL-tdTomato mice were immunized with NP-CGG in alum and then treated with tamoxifen on days 6, 7, and 8. On days 13, 15, and 17 after immunization, GCs were depleted by anti-CD40L treatment. The frequency of tdTomato+ cells among NP+ IgG1+ BM PCs at the indicated time points is shown. Three to six mice were analyzed at each time point. (C) B6 mice were transferred with splenic B cells from B1-8germ Blimp1-CreERT2 R26-LSL-tdTomato mice, immunized with NP-CGG in alum, and then treated with tamoxifen from day 3 to 5 after immunization. At the indicated time points after immunization, absolute numbers of donor-derived tdTomato+ PCs (left) and B220hiMHC-IIhi and B220loMHC-IIlo PC subsets (right) in BM were analyzed. Four or five mice were analyzed at each time point. (D) B6 mice were transferred with splenic B cells from B1-8germ S1PR2-CreERT2 R26-LSL-tdTomato mice, immunized with NP-CGG in alum and then treated with tamoxifen at days 8 and 9 after immunization. For GC depletion, the mice were injected i.p. with anti-CD40L mAb at days 12, 14, and 16 after immunization. At the indicated time points after immunization, absolute numbers of donor-derived tdTomato+ BM PCs (left) and B220hiMHC-IIhi and B220loMHC-IIlo PC subsets (right) in BM were analyzed. Five or six mice were analyzed at each time point. All data are representative of two independent experiments except B, where data from two independent experiments are combined. The gating strategy for NP-specific PCs is shown in Fig. S3, D and E.
Figure 5.
Figure 5.
Maturation-dependent PC dynamics in the BM niche. B6 mice were transferred with splenic B cells from B1-8germ Blimp1-CreERT2 R26-LSL-tdTomato mice, immunized with NP-CGG in alum, and then treated with tamoxifen from day 9 to 11 after immunization. Intravital BM imaging was performed using these mice on day 12 and 54 after immunization. (A) Schematic of the experimental procedure. (B) A representative maximum-intensity projection image of skull bone tissues from the mice at the indicated time points after immunization (top). Red, PCs expressing tdTomato; green, blood vessels (Qdot); blue, bone tissues (SHG). Scale bar, 20 μm. Trajectory of these PCs measured for 1 h (bottom). White spheres were automatically generated by Imaris software recognizing tdTomato+ cells. (C) Displacement of PCs in the x–y plane during 1 h of observation in the mice at the indicated time points after immunization. (D) Mean track speed of PCs at the indicated time points. Data are pooled from two mice with 77 cells and three mice with 37 cells at day 12 and 54 after immunization, respectively. All data are pooled from two independent experiments. **P < 0.01 by two-tailed unpaired Student’s T test. The imaging data are available in Video 1.

References

    1. Amanna, I.J., Carlson N.E., and Slifka M.K.. 2007. Duration of humoral immunity to common viral and vaccine antigens. N. Engl. J. Med. 357:1903–1915. 10.1056/NEJMoa066092 - DOI - PubMed
    1. Benet, Z., Jing Z., and Fooksman D.R.. 2021. Plasma cell dynamics in the bone marrow niche. Cell Rep. 34:108733. 10.1016/j.celrep.2021.108733 - DOI - PMC - PubMed
    1. Bhattacharya, D. 2022. Instructing durable humoral immunity for COVID-19 and other vaccinable diseases. Immunity. 55:945–964. 10.1016/j.immuni.2022.05.004 - DOI - PMC - PubMed
    1. Bortnick, A., and Allman D.. 2013. What is and what should always have been: Long-lived plasma cells induced by T cell-independent antigens. J. Immunol. 190:5913–5918. 10.4049/jimmunol.1300161 - DOI - PMC - PubMed
    1. Bortnick, A., Chernova I., Quinn W.J. III, Mugnier M., Cancro M.P., and Allman D.. 2012. Long-lived bone marrow plasma cells are induced early in response to T cell-independent or T cell-dependent antigens. J. Immunol. 188:5389–5396. 10.4049/jimmunol.1102808 - DOI - PMC - PubMed

Publication types

LinkOut - more resources