. 2023 Jan 12;388(2):128-141.
doi: 10.1056/NEJMoa2207406. Epub 2022 Dec 14.

Deep Intronic FGF14 GAA Repeat Expansion in Late-Onset Cerebellar Ataxia

Affiliations

Deep Intronic FGF14 GAA Repeat Expansion in Late-Onset Cerebellar Ataxia

David Pellerin et al. N Engl J Med. .

Abstract

Background: The late-onset cerebellar ataxias (LOCAs) have largely resisted molecular diagnosis.

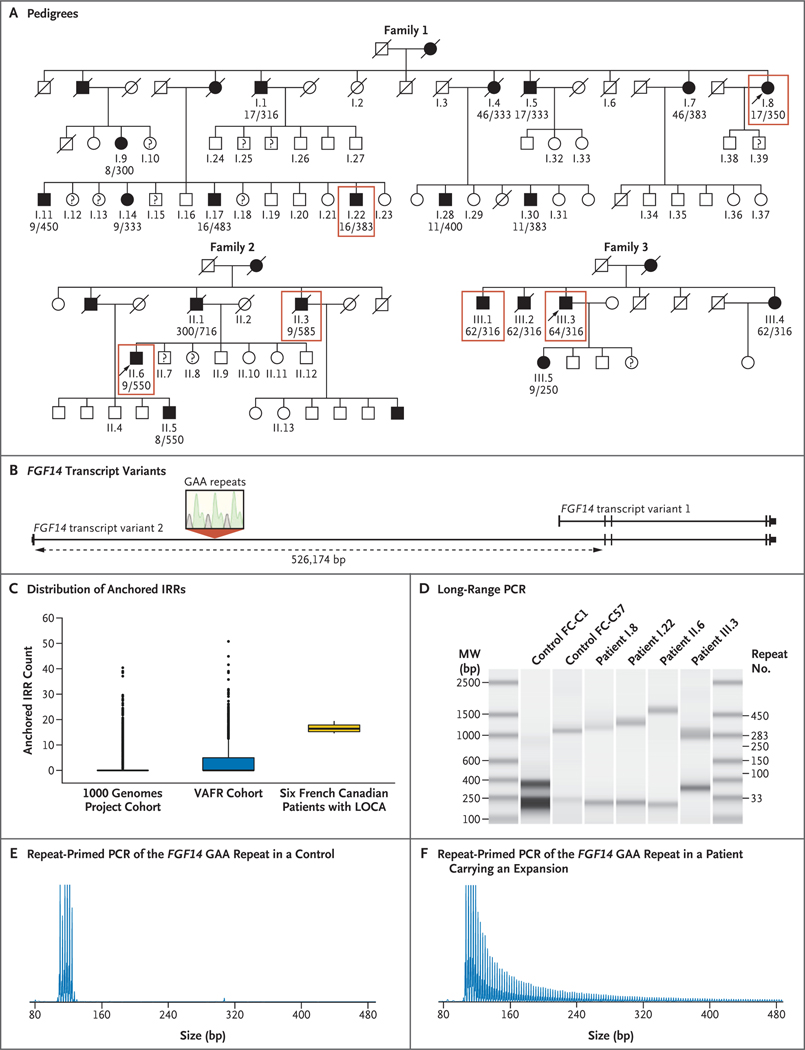
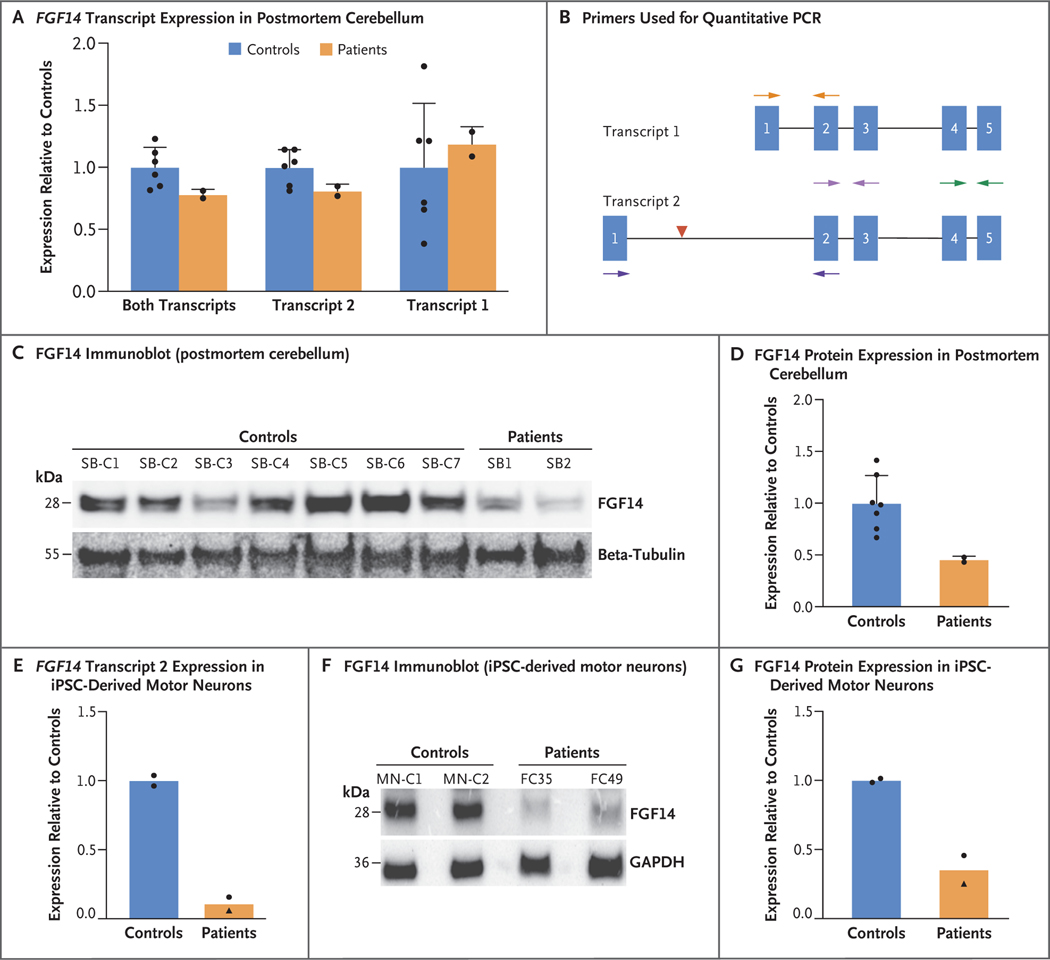
Methods: We sequenced the genomes of six persons with autosomal dominant LOCA who were members of three French Canadian families and identified a candidate pathogenic repeat expansion. We then tested for association between the repeat expansion and disease in two independent case-control series - one French Canadian (66 patients and 209 controls) and the other German (228 patients and 199 controls). We also genotyped the repeat in 20 Australian and 31 Indian index patients. We assayed gene and protein expression in two postmortem cerebellum specimens and two induced pluripotent stem-cell (iPSC)-derived motor-neuron cell lines.

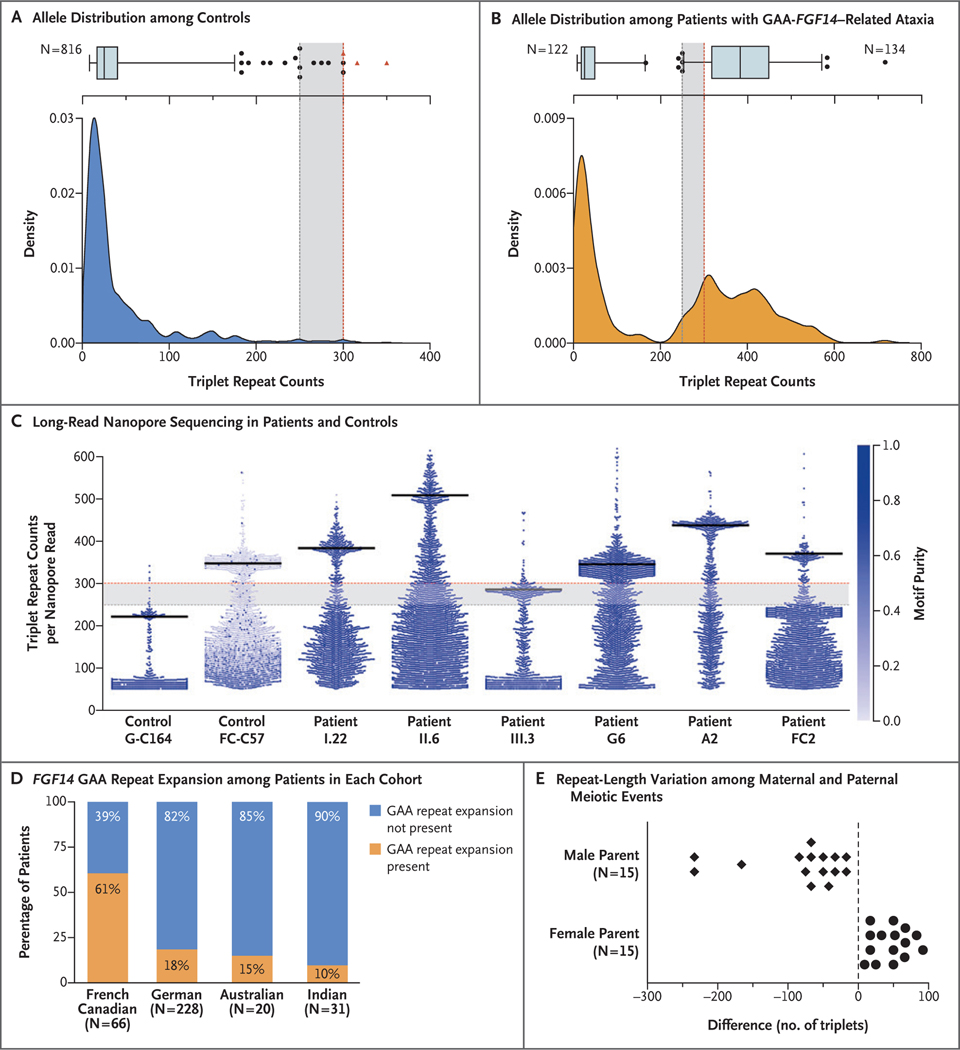
Results: In the six French Canadian patients, we identified a GAA repeat expansion deep in the first intron of FGF14, which encodes fibroblast growth factor 14. Cosegregation of the repeat expansion with disease in the families supported a pathogenic threshold of at least 250 GAA repeats ([GAA]≥250). There was significant association between FGF14 (GAA)≥250 expansions and LOCA in the French Canadian series (odds ratio, 105.60; 95% confidence interval [CI], 31.09 to 334.20; P<0.001) and in the German series (odds ratio, 8.76; 95% CI, 3.45 to 20.84; P<0.001). The repeat expansion was present in 61%, 18%, 15%, and 10% of French Canadian, German, Australian, and Indian index patients, respectively. In total, we identified 128 patients with LOCA who carried an FGF14 (GAA)≥250 expansion. Postmortem cerebellum specimens and iPSC-derived motor neurons from patients showed reduced expression of FGF14 RNA and protein.

Conclusions: A dominantly inherited deep intronic GAA repeat expansion in FGF14 was found to be associated with LOCA. (Funded by Fondation Groupe Monaco and others.).


Figures

Figure 1
Figure 1. Identification of a Deep Intronic GAA Repeat Expansion in FGF14 in Patients with Late-Onset Cerebellar Ataxia.
Panel A shows the pedigrees of three large unrelated French Canadian families with unsolved autosomal dominant late-onset cerebellar ataxia (LOCA). Numbered family members underwent genotyping for the GAA repeat expansion in FGF14 by long-range polymerase chain reaction (PCR) and repeat-primed PCR. Allele sizes expressed as numbers of GAA repeats are provided for clinically affected persons only. Family members for whom whole-genome sequences were obtained are indicated by a red box. Squares represent male family members, and circles female family members. Solid black shapes indicate affected persons. Question marks indicate persons whose clinical status is uncertain. Slashed symbols indicate deceased persons. Probands are indicated by arrows. Pedigrees have been abbreviated and family members randomly rearranged to preserve privacy. Panel B is a diagram of FGF14 transcript variants 1 (NM_004115.4) and 2 (NM_175929.3). The location of the (GAA)n repeat locus in the first intron of FGF14 transcript variant 2 is indicated by the red arrowhead. Panel C shows the distribution of anchored in-repeat reads (IRRs) obtained with the use of ExpansionHunter Denovo for each of the 2504 samples from the 1000 Genomes Project control cohort, 1115 samples from the Vanderbilt Atrial Fibrillation Registry (VAFR) control cohort, and samples from 6 French Canadian patients with LOCA at the FGF14 repeat locus (chr13:102,813,925–102,814,074; GRCh37). The mean (±SD) number of anchored IRRs at this locus was 16.68±1.90 (median, 16.40; range, 14.60 to 19.45) in the group of 6 patients with LOCA, which was higher than that in the 1000 Genomes Project data set (1.77±4.99; median, 0; range, 0 to 40.42; Cohen’s d, 2.99; 95% confidence interval [CI], 2.19 to 3.80) and the VAFR cohort (4.38±7.73; median, 0; range, 0 to 50.78; Cohen’s d, 1.59; 95% CI, 0.78 to 2.40). The widths of the confidence intervals have not been adjusted for multiplicity, and therefore the confidence intervals should not be used to reject or not reject effects. Panel D shows the results of long-range PCR indicating a large heterozygous expansion of the FGF14 repeat locus. A representative image of PCR amplification products that were resolved with the use of the Agilent 4200 TapeStation automated electrophoresis system from two controls and four patients is shown. All samples were amplified and resolved during the same experiment. The four patients each carried one expanded product that was at least 900 bp in length, corresponding to 250 or more GAA repeats. The large amplification product of Control FC-C57 was found by long-read nanopore sequencing to be a GAAGGA hexanucleotide repeat expansion. MW denotes molecular weight. Panels E and F show the results of repeat-primed PCR of the FGF14 GAA repeat unit. Panel E is a normal electropherogram in a control who was homozygous for (GAA)11 alleles. Panel F is an electropherogram showing the characteristic sawtooth pattern in a patient with LOCA (Patient II.6) carrying an expanded (GAA)550 allele.
Figure 2
Figure 2. Allele Distribution and Long-Read Sequencing of the FGF14 GAA Repeat Locus.
Panels A and B show the allele distribution of the FGF14 repeat locus in 408 controls (816 chromosomes) (Panel A) and 128 patients with GAA-FGF14–related ataxia (122 normal and 134 expanded chromosomes) (Panel B). The repeat length was estimated by agarose-gel electrophoresis of PCR-amplification products. Among the patients with GAA-FGF14–related ataxia, 4 were homozygous or compound heterozygous for (GAA)≥250 expansions, and 2 were compound heterozygous for a (GAA)≥250 expansion and a (GAAGGA)≥125 expansion. The smallest number of GAA repeats among controls and patients was 8. The density plots show allele-size frequencies, with higher densities indicating greater frequencies. The box-and-whisker plots show the allelic distribution in controls and patients. In Panel B, the box-and-whisker plots above the graph show the distribution of the normal alleles (left-hand plot) and expanded alleles (right-hand plot) in patients. The box indicates the 25th percentile (first quartile), the median, and the 75th percentile (third quartile), and the whiskers indicate the 2.5th and 97.5th percentiles. Outliers are represented by black dots. In controls, expanded alleles consisting of non-GAA repeats are represented by red triangles. The dashed gray lines and the shaded gray areas indicate the incompletely penetrant range of (GAA)250–300, and the dashed red lines mark the threshold of (GAA)300 repeat units, above which the alleles are fully penetrant. The allelic distributions in the different control and patient cohorts are shown in Figure S4. Panel C shows swarm plots of 3000 randomly sampled individual nanopore reads containing at least 50 repeat units for 2 controls and 6 patients. Control G-C164 carries a subpathogenic (GAA)222 allele, and control FC-C57 carries a nonpathogenic (GAAGGA)152 allele. Patients I.22, II.6, and III.3 (French Canadian discovery cohort) carry a (GAA)388, (GAA)508, and (GAA)285 expansion, respectively. Patients G6 (German cohort) and A2 (Australian cohort) carry a (GAA)345 and (GAA)437 expansion, respectively. Patient FC2 (French Canadian cohort) carries a (GAA)223 allele and a (GAA)355 allele. Horizontal black bars indicate repeat size of the larger allele, as measured by nanopore sequencing. Expansion sizing by long-read nanopore sequencing and agarose-gel electrophoresis of PCR amplification products are highly similar (Pearson correlation coefficient, 0.96), as shown in Figure S8. The horizontal dashed gray line and the shaded gray area show the incompletely penetrant range of (GAA)250–300, and the dashed red line marks the threshold of (GAA)300 repeat units, above which the alleles are fully penetrant. The color of the data points is a function of the GAA repeat motif purity in each individual read, with dark blue indicating pure and lighter blue impure motif (a hue scale is shown on the right y axis). Panel D shows the percentages of patients with LOCA who carried an FGF14 (GAA)≥250 repeat expansion in the French Canadian (40 of 66 index patients), German (42 of 228), Australian (3 of 20), and Indian (3 of 31) cohorts. Panel E shows repeat-length variation across 15 maternal and 15 paternal meiotic events involving alleles of (GAA)≥250 repeats.
Figure 3
Figure 3. Imaging and Neuropathological Findings in Patients with GAA-FGF14–Related Ataxia.
Panel A shows severe vermis atrophy (arrowhead) on sagittal T1-weighted magnetic resonance imaging in a female patient at 88 years of age. Panel B shows a midsagittal section of the postmortem cerebellum of the same patient at 94 years of age, in which anterior vermis atrophy is visible (arrowhead); Panel C shows an age-matched control for comparison. Panel D shows a hematoxylin and eosin–stained section of the cerebellar vermis in the patient, and a control is shown for comparison in Panel E. Widespread loss of Purkinje cells, with a shrunken appearance of rare residual Purkinje cells (arrow), a gliotic and rarefied molecular layer (black asterisk), and reduced numbers of cells in the granule-cell layer (blue asterisk) can be seen in the patient. Panels F and H show calbindin immunohistochemical analysis of the vermis from the same patient with GAA-FGF14–related ataxia and a control, respectively. Severe loss of Purkinje cells with markedly rarefied dendritic network in the molecular layer is seen in the patient, whereas in the age-matched control, the Purkinje cells show dense dendritic arborization in the molecular layer. In the inset shown in Panel G, Purkinje-cell loss is also evident with Bielschowsky tinctorial silver stain, which highlights the processes of basket cells, resulting in an “empty basket” appearance. Panels I and J show the cerebellar hemisphere of a patient with GAA-FGF14–related ataxia and a control, respectively; in the patient, the Purkinje cells are reduced in number (arrows), but the molecular layer shows less prominent gliosis and the cell density in the granule-cell layer is much better preserved than in the vermis. All staining was performed with appropriate negative and positive controls. Pathological findings in the cerebellum were similar in the two French Canadian patients with GAA-FGF14–related ataxia for whom postmortem tissue was available. The scale bar in Panels D through F and Panels H through J indicates 100 μm.
Figure 4
Figure 4. FGF14 Expression and Protein Levels in Cerebellum and iPSC-Derived Motor Neurons.
Panel A shows the relative expression of FGF14 transcript variant 1 (NM_004115.4) and transcript variant 2 (NM_175929.3) mRNA, both together and individually, in the postmortem cerebellar cortex of six controls and two patients, normalized by geometric averaging of the expression of five housekeeping genes (ACTB, HPRT1, YWHAZ, RPL13, and UBE2D2) as assessed by quantitative PCR. Values shown are the ratio of the mean expression relative to the mean among controls. Bars indicate the mean, T bars the standard deviation, and black dots the data distribution. Panel B shows a map of the primers used in quantitative PCR experiments with postmortem cerebellum and induced pluripotent stem-cell (iPSC)–derived motor neurons in relation to the exons of both FGF14 transcripts. Orange arrows indicate the primers used for the transcript 1 assay, dark purple arrows the primers used for the transcript 2 assay, and green arrows and light purple arrows the primers used for total FGF14 expression assays in postmortem cerebellum and iPSC-derived motor neurons, respectively. The position of the GAA repeat expansion in intron 1 of transcript 2 is indicated by a red arrowhead. Panel C shows a representative FGF14 immunoblot of protein extracts from postmortem cerebellar cortex specimens from seven controls and two patients. Beta-tubulin was used as loading control. Western blot analysis was repeated independently three times, with similar results. Panel D shows the mean expression ratios of FGF14 protein in postmortem cerebellar specimens from seven controls and two patients, measured across three independent replicate immunoblots. All ratios were normalized to beta-tubulin and expressed relative to controls. Bars indicate the mean, T bars the standard deviation, and black dots the data distribution. Panel E shows the relative expression of FGF14 transcript 2 in iPSC-derived motor neurons of two controls and two patients, normalized to GAPDH, as assessed by quantitative PCR. Relative quantification was computed by the 2−ΔΔCt method, with the use of the mean value among controls as calibrator; values are represented as the ratio of the mean expression relative to the mean among controls. Bars indicate the mean, and black dots and triangle the data distribution. Panel F shows a representative FGF14 immunoblot of protein extracts from induced motor neurons from two controls and two patients. GAPDH was used as loading control. Western blot analysis was repeated independently twice, with similar results. Panel G shows the mean expression ratios of FGF14 protein in induced motor neurons from two controls and two patients. All ratios were normalized to GAPDH and expressed relative to controls. Bars indicate the mean, and black dots and triangle the data distribution. Black triangles in Panels E and G indicate a patient who was homozygous for (GAA)300 expansions.

Comment in

References

    1. Harding AE. “Idiopathic” late onset cerebellar ataxia: a clinical and genetic study of 36 cases. J Neurol Sci 1981; 51: 259–71. - PubMed
    1. Ruano L, Melo C, Silva MC, Coutinho P. The global epidemiology of hereditary ataxia and spastic paraplegia: a systematic review of prevalence studies. Neuroepidemiology 2014; 42: 174–83. - PubMed
    1. Krygier M, Mazurkiewicz-Bełdzińska M. Milestones in genetics of cerebellar ataxias. Neurogenetics 2021; 22: 225–34. - PMC - PubMed
    1. Bahlo M, Bennett MF, Degorski P, Tankard RM, Delatycki MB, Lockhart PJ. Recent advances in the detection of repeat expansions with short-read next-generation sequencing. F1000Res 2018; 7:F 1000. - PMC - PubMed
    1. Fazal S, Danzi MC, Cintra VP, et al. Large scale in silico characterization of repeat expansion variation in human genomes. Sci Data 2020; 7:2 94. - PMC - PubMed

Publication types

Substances