. 2022 Dec 14;14(23):9484-9549.
doi: 10.18632/aging.204434. Epub 2022 Dec 14.

DNA methylation GrimAge version 2

Affiliations

DNA methylation GrimAge version 2

Ake T Lu et al. Aging (Albany NY). .

Abstract

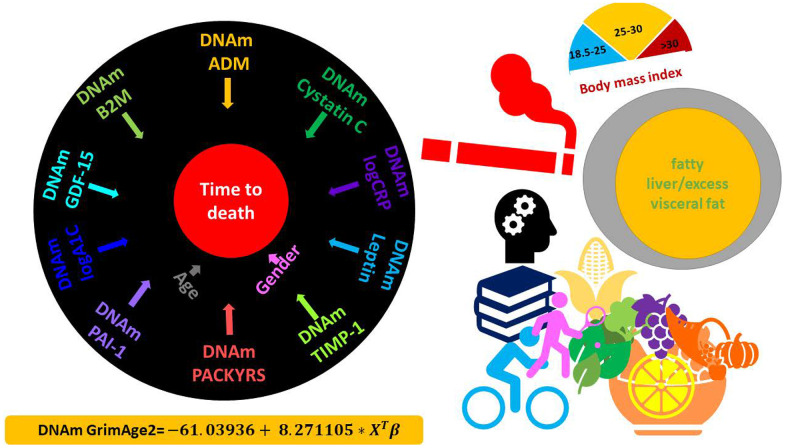
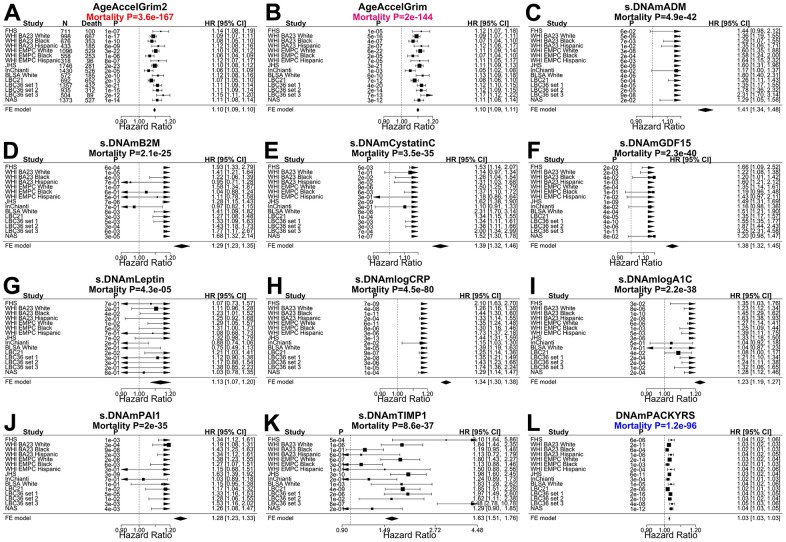
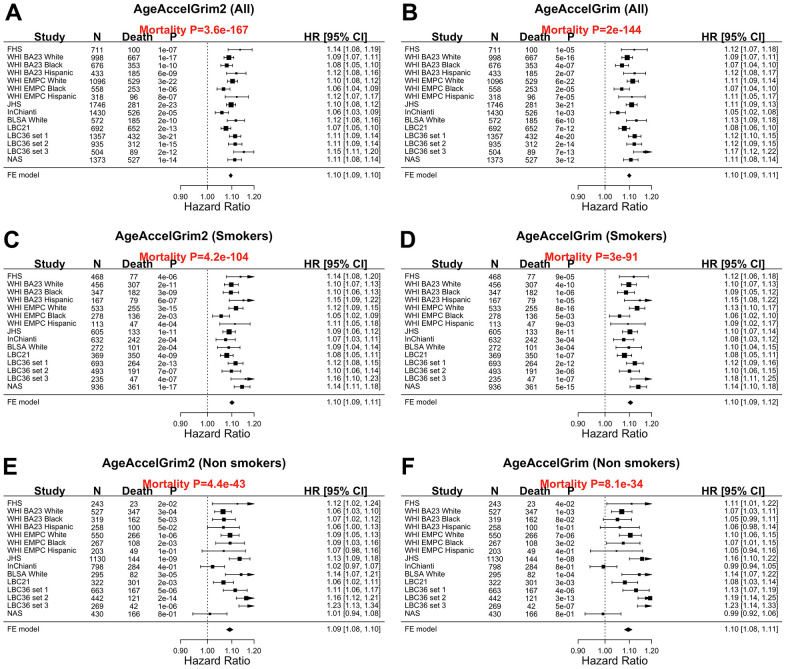
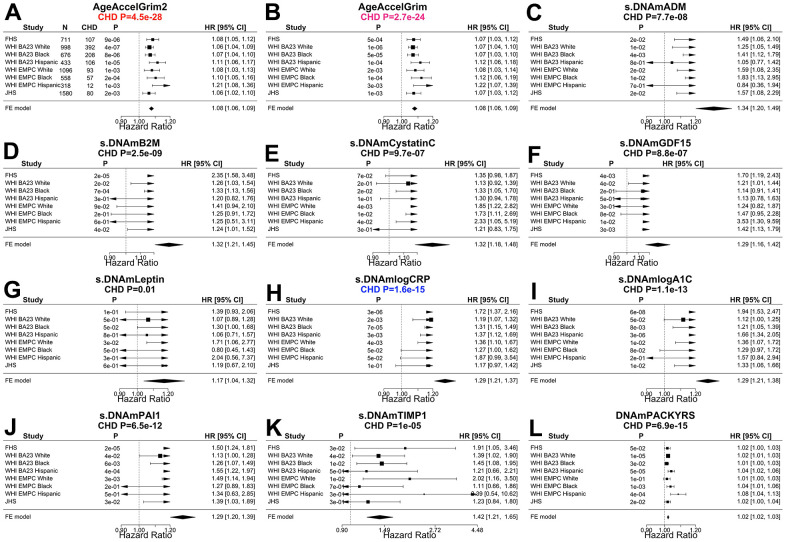
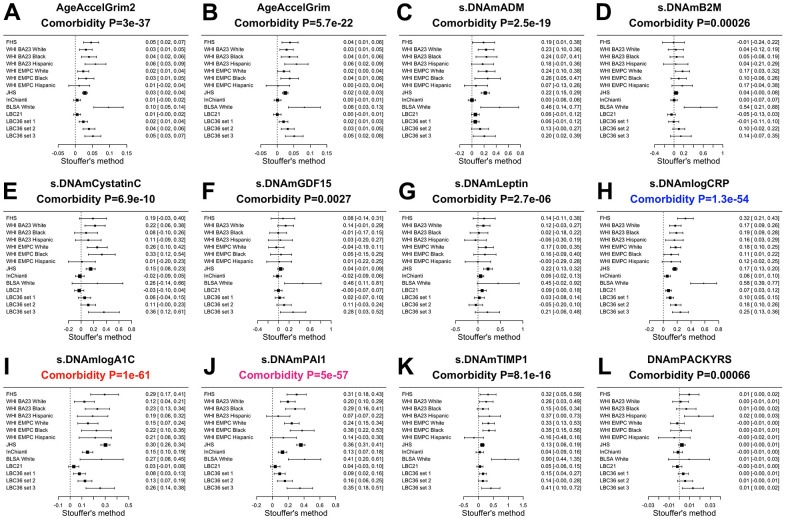
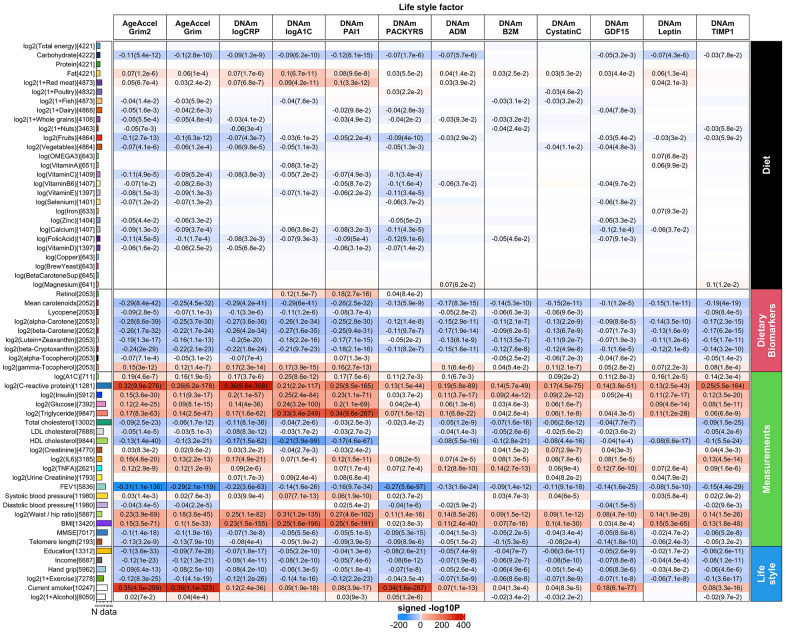
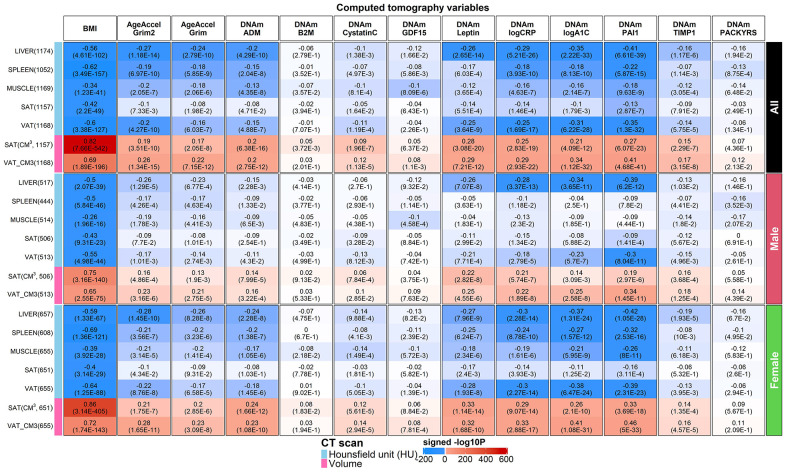
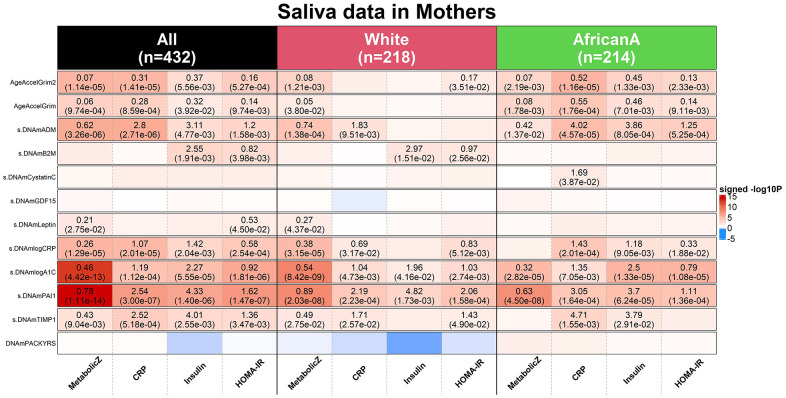
We previously described a DNA methylation (DNAm) based biomarker of human mortality risk DNAm GrimAge. Here we describe version 2 of GrimAge (trained on individuals aged between 40 and 92) which leverages two new DNAm based estimators of (log transformed) plasma proteins: high sensitivity C-reactive protein (logCRP) and hemoglobin A1C (logA1C). We evaluate GrimAge2 in 13,399 blood samples across nine study cohorts. After adjustment for age and sex, GrimAge2 outperforms GrimAge in predicting mortality across multiple racial/ethnic groups (meta P=3.6x10-167 versus P=2.6x10-144) and in terms of associations with age related conditions such as coronary heart disease, lung function measurement FEV1 (correlation= -0.31, P=1.1x10-136), computed tomography based measurements of fatty liver disease. We present evidence that GrimAge version 2 also applies to younger individuals and to saliva samples where it tracks markers of metabolic syndrome. DNAm logCRP is positively correlated with morbidity count (P=1.3x10-54). DNAm logA1C is highly associated with type 2 diabetes (P=5.8x10-155). DNAm PAI-1 outperforms the other age-adjusted DNAm biomarkers including GrimAge2 in correlating with triglyceride (cor=0.34, P=9.6x10-267) and visceral fat (cor=0.41, P=4.7x10-41). Overall, we demonstrate that GrimAge version 2 is an attractive epigenetic biomarker of human mortality and morbidity risk.

Keywords: DNA methylation; epigenetic clock; healthspan; mortality.


Conflict of interest statement

CONFLICTS OF INTEREST: The Regents of the University of California is the sole owner of a patent application directed at this invention for which ATL and SH are named inventors. SH is a founder and paid consultant of the non profit Epigenetic Clock Development Foundation that licenses this patent. REM is a scientific advisor to the Epigenetic Clock Development Foundation and Optima Partners and has received speaker fees from Illumina. AMB is a scientific advisor to the Epigenetic Clock Development Foundation.

Figures

Figure 1
Figure 1
DNAm GrimAge2. The left panel displays the components of GrimAge2 trained by Cox regression with an elastic net penalty. The elastic net regression model automatically selected the following covariates: chronological age (Age), gender (Female), and ten DNAm based surrogates for smoking pack-years (DNAm PACKYRS), adrenomedullin levels (DNAm ADM), beta-2 microglobulin (DNAm B2M), cystatin C (DNAm Cystatin C), growth differentiation factor 15 (DNAm GDF-15), leptin (DNAm Leptin), log-scale high sensitivity C-reactive protein (DNAm logCRP), log-scale hemoglobin A1C (DNAm logA1C), plasminogen activation inhibitor 1 (DNAm PAI-1), tissue inhibitor metalloproteinase 1 (DNAm TIMP-1). The linear combination of the covariate values XTβ was linearly transformed to be in units of years, as described in the bottom. Technically speaking, DNAm GrimAge2 is an epigenetic clock for mortality risk. Metaphorically speaking, it estimates biological age in units of years. The right panel displays selective factors including diet, lifestyle and clinical biomarkers that were significantly associated with age acceleration measure of GrimAge2 or age-adjusted DNAm biomarkers underlying GrimAge2 in our downstream analysis.
Figure 2
Figure 2
Meta analysis forest plots for predicting time-to-death due to all-cause mortality. Fixed effect meta analysis was performed to combine mortality analysis across 15 strata from 9 study cohorts: FHS test data, Women’s Health Initiatives (WHI) BA23, WHI EMPC, Jackson Heart Study (JHS), InCHIANTI (baseline and the third follow-up), Baltimore Longitudinal Study of Aging (BLSA), Lothian Birth Cohort 1921 (LBC21) and LBC 1936 (LBC36), and Normative Aging Study (NAS). Each panel reports a meta analysis forest plot for combining hazard ratios predicting time-to-death based on a DNAm based biomarker (reported in the figure heading) across different strata formed by racial group within cohort and set within LBC36. (A, B) display the results for AgeAccelGrim2 and AgeAccelGrim. Each row reports a hazard ratio (for time-to-death) and a 95% confidence interval resulting from a Cox regression model in each of 15 strata. (CL) display the results for (age-adjusted) DNAm based surrogate markers of (C) adrenomedullin (ADM), (D) beta-2 microglobulin (B2M), (E) cystatin C (Cystatin C), (F) growth differentiation factor 15 (GDF-15), (G) leptin, (H) log scale of C reactive protein (CRP), (I) log scale of hemoglobin A1C, (J) plasminogen activation inhibitor 1 (PAI-1), (K) tissue inhibitor metalloproteinase 1 (TIMP-1) and (L) smoking pack-years (PACKYRS). The sub-title of each panel reports the meta analysis P-value. (A, B) Each hazard ratio (HR) corresponds to a one-year increase in AgeAccel. (CK) Each hazard ratio corresponds to an increase in one-standard deviation. (L) Hazard ratios correspond to a one-year increase in pack-years. The most significant meta analysis P-value is marked in red (AgeAccelGrim2), followed by hot pink (AgeAccelGrim) and blue (DNAm PACKYRS), respectively.
Figure 3
Figure 3
Meta analysis forest plots for predicting all-cause mortality in all, smokers and non-smokers. Fixed effect models meta analysis was performed to combine mortality analysis across 15 strata from 9 study cohorts. Analysis was performed across different strata formed by racial groups within cohort and set within LBC36, using (A, B) all individuals, (C, D) smokers (former and current), and (E, F) non-smokers, respectively. Each panel reports a meta-analysis forest plot for combining hazard ratios predicting time-to-death based on AgeAccelGrim2 (on the left panel) and AgeAccelGrim (on the right panel). The sub-title of each panel reports the meta analysis P-value. Each hazard ratio (HR) corresponds to a one-year increase in AgeAccel measure.
Figure 4
Figure 4
Meta analysis forest plots for predicting time-to-coronary heart disease. Fixed effect models meta analysis was performed to combine Cox regression analysis of coronary heart disease (CHD) across 8 strata from 4 study cohorts. Each panel reports a meta analysis forest plot for combining hazard ratios predicting time-to-CHD based on a DNAm based biomarker (reported in the figure heading) across different strata formed by racial groups within the cohort. (A, B) Results for AgeAccelGrim2 and AgeAccelGrim. Each row reports a hazard ratio (for time-to-CHD) and a 95% confidence interval resulting from a Cox regression model in each strata. (CL) display the results for (age-adjusted) DNAm based surrogate markers of (C) adrenomedullin (ADM), (D) beta-2 microglobulin (B2M), (E) cystatin C (Cystatin C), (F) growth differentiation factor 15 (GDF-15), (G) leptin, (H) log scale of C reactive protein (CRP), (I) log scale of hemoglobin A1C, (J) plasminogen activation inhibitor 1 (PAI-1), (K) tissue inhibitor metalloproteinase 1 (TIMP-1) and (L) smoking pack-years (PACKYRS). The sub-title of each panel reports the meta analysis P-value. (A, B) Each hazard ratio (HR) corresponds to a one-year increase in AgeAccel. (CK) Each hazard ratio corresponds to an increase in one-standard deviation. (L) Hazard ratios correspond to a one-year increase in pack-years. The most significant Meta analysis P-value is marked in red (AgeAccelGrim2), followed by hot pink (AgeAccelGrim) and blue (DNAm logCRP), respectively.
Figure 5
Figure 5
Meta analysis of associations with total number of age-related conditions. Each panel reports a meta analysis forest plot based on Stouffer’s method for combining regression analysis Z statistics between the comorbidity index and the DNAm-based biomarker (reported in the figure heading) across different strata, which are formed by racial group within cohort and set within LBC36. (A, B) display the results for AgeAccelGrim2 and AgeAccelGrim. (CL) display the results for scaled DNAm based surrogate markers of (C) adrenomedullin (ADM), (D) beta-2 microglobulin (B2M), (E) cystatin C (Cystatin C), (F) growth differentiation factor 15 (GDF-15), (G) leptin, (H) log scale of C reactive protein (CRP), (I) log scale of hemoglobin A1C, (J) plasminogen activation inhibitor 1 (PAI-1), (K) tissue inhibitor metalloproteinase 1 (TIMP-1) and (L) smoking pack-years (PACKYRS). The sub-title of each panel reports the meta analysis p-value. Each row reports a beta coefficient β and a 95% confidence interval resulting from a (linear-mixed) regression model in each strata (defined by cohort racial group). (A, B) Each β corresponds to a one-year increase in AgeAccel. (CK) Each β corresponds to an increase in one-standard deviation. (L) β corresponds to a one-year increase in pack-years. The most significant meta-analysis P-value is marked in red (DNAm logA1C), followed by hot pink (DNAm PAI1) and blue (DNAm logCRP), respectively.
Figure 6
Figure 6
Meta cross-sectional correlations with diet, clinical biomarkers and lifestyle factors. Robust correlation coefficients (biweight midcorrelation [26]) between 1) AgeAccelGrim2, AgeAccelGrim, and ten age-adjusted underlying DNAm-based surrogate biomarkers underlying DNAmGrimAge2, and 2) 61 variables including 27 self-reported diet, 9 dietary biomarkers, 19 clinically relevant measurements related to vital signs, metabolic traits, inflammatory markers, cognitive function, lung function, central adiposity and leukocyte telomere length, and 6 lifestyle factors including hand grip strength. The y-axis lists variables in the format of name (sample size), followed by a bar plot denoting number of studies. Variables are arranged by category displayed on the right annotation. The x-axis lists AgeAccelGrim2, AgeAccelGrim, followed by DNAm estimates of log CRP, log A1C, PAI-1, smoking pack-years, etc. Each cell presents meta bicor estimates and P-value, provided P<0.1. The color gradient is based on -log10 P-values times sign of bicor. P-values are unadjusted. An analogous analysis stratified by gender can be found in Supplementary Figure 12.
Figure 7
Figure 7
Computed tomography variables versus BMI and age-adjusted DNAm biomarkers in the FHS. Robust correlation coefficients (biweight midcorrelation [26]) between 1) AgeAccelGrim2, AgeAccelGrim, and ten age-adjusted DNAm-based surrogate biomarkers underlying DNAmGrimAge2, and 2) seven computed tomography-derived organ density measures (Hounsfield units) or volumetric measures for subcutaneous adipose tissue (SAT CM3) or visceral adipose tissue (VAT CM3). The y-axis lists computed tomography variables in the format of name (sample size in FHS), annotated by variable type. The x-axis lists body mass index (BMI), AgeAccelGrim2, AgeAccelGrim, followed by DNAm variables in alphabetical order. Each cell presents bicor (P-value). P-values are unadjusted and reported based on linear mixed analysis with pedigree as random effect to avoid confounding by pedigree structure. The color gradient is based on -log10 P-values times sign of bicor. We applied the correlation analysis to males and females, respectively, and then combined the results via fixed effect models weighted by inverse variance (listed in the top rows, denoted as “ALL”). The heatmap presents the results based on ALL and stratification results by gender, annotated on the right side.
Figure 8
Figure 8
Applications of DNAm GrimAges on saliva methylation data in NGHS. DNAmGrimAge, DNAmGrimAge2 and its components were estimated in saliva methylation data from mothers. Linear regression analysis was performed to study the association between 1) dependent variables: clinically relevant measures: metabolic Z score, high sensitivity C-reactive protein (CRP), insulin resistant and HOMA for insulin resistance (HOMA-IR) [32] and 2) independent variables: AgeAccelGrim2, AgeAccelGrim, and nine scaled DNAm-based surrogates of proteins and DNAmPACKYRS. Regression models were performed in all mothers (n=432) and stratified by ethnic/racial groups: White (n=218) and African American (n=214). Analysis was adjusted for age and batch effect and adjusted for race as needed. The y-axis lists DNAm-based variables and the x-axis lists the clinically relevant measures. Each cell presents beta coefficient (P-value), provided P< 0.05 from the regression analysis. The color gradient is based on -log10 P-values times sign of beta coefficient. All P-values are unadjusted.

References

    1. Lu AT, Quach A, Wilson JG, Reiner AP, Aviv A, Raj K, Hou L, Baccarelli AA, Li Y, Stewart JD, Whitsel EA, Assimes TL, Ferrucci L, Horvath S. DNA methylation GrimAge strongly predicts lifespan and healthspan. Aging (Albany NY). 2019; 11:303–27. 10.18632/aging.101684 - DOI - PMC - PubMed
    1. Horvath S. DNA methylation age of human tissues and cell types. Genome Biol. 2013; 14:R115. 10.1186/gb-2013-14-10-r115 - DOI - PMC - PubMed
    1. Hannum G, Guinney J, Zhao L, Zhang L, Hughes G, Sadda S, Klotzle B, Bibikova M, Fan JB, Gao Y, Deconde R, Chen M, Rajapakse I, et al.. Genome-wide methylation profiles reveal quantitative views of human aging rates. Mol Cell. 2013; 49:359–67. 10.1016/j.molcel.2012.10.016 - DOI - PMC - PubMed
    1. Zhang Y, Wilson R, Heiss J, Breitling LP, Saum KU, Schöttker B, Holleczek B, Waldenberger M, Peters A, Brenner H. DNA methylation signatures in peripheral blood strongly predict all-cause mortality. Nat Commun. 2017; 8:14617. 10.1038/ncomms14617 - DOI - PMC - PubMed
    1. Levine ME, Lu AT, Quach A, Chen BH, Assimes TL, Bandinelli S, Hou L, Baccarelli AA, Stewart JD, Li Y, Whitsel EA, Wilson JG, Reiner AP, et al.. An epigenetic biomarker of aging for lifespan and healthspan. Aging (Albany NY). 2018; 10:573–91. 10.18632/aging.101414 - DOI - PMC - PubMed

Publication types