. 2022 Dec 13;41(11):111821.
doi: 10.1016/j.celrep.2022.111821.

AKTIP loss is enriched in ERα-positive breast cancer for tumorigenesis and confers endocrine resistance

Affiliations

AKTIP loss is enriched in ERα-positive breast cancer for tumorigenesis and confers endocrine resistance

Angel S N Ng et al. Cell Rep. .

Abstract

Recurrent deletion of 16q12.2 is observed in luminal breast cancer, yet the causal genomic alterations in this region are largely unknown. In this study, we identify that loss of AKTIP, which is located on 16q12.2, drives tumorigenesis of estrogen receptor alpha (ERα)-positive, but not ERα-negative, breast cancer cells and is associated with poor prognosis of patients with ERα-positive breast cancer. Intriguingly, AKTIP-depleted tumors have increased ERα protein level and activity. Cullin-associated and neddylation-dissociated protein 1 (CAND1), which regulates the cullin-RING E3 ubiquitin ligases, protects ERα from cullin 2-dependent proteasomal degradation. Apart from ERα signaling, AKTIP loss triggers JAK2-STAT3 activation, which provides an alternative survival signal when ERα is inhibited. AKTIP-depleted MCF7 cells and ERα-positive patient-derived organoids are more resistant to ERα antagonists. Importantly, the resistance can be overcome by co-inhibition of JAK2/STAT3. Together, our results highlight the subtype-specific functional consequences of AKTIP loss and provide a mechanistic explanation for the enriched AKTIP copy-number loss in ERα-positive breast cancer.

Keywords: CP: Cancer; endocrine resistance; estrogen receptor; luminal breast cancer; protein degradation.


Conflict of interest statement

Declaration of interests The authors declare no competing interests.

Figures

Figure 1.
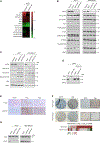
Figure 1.. AKTIP loss promotes tumorigenic phenotypes selectively in luminal breast cancer cells
(A) AKTIP mRNA levels between matched normal breast tissues and tumor samples of all subtypes (n = 111 pairs) or luminal subtype only (n = 84 pairs) in TCGA cohort. p values of Wilcoxon signed rank test are shown. (B) Relapse-free survival of patients with ERα-, progesterone receptor (PR)-, and HER2-positive (top) and ERα-, PR-, and HER2-negative (bottom) breast cancer with a lower tertile of AKTIP mRNA level as cutoff. The analysis was generated by KM plotter using expression data obtained from Gene Expression Omnibus datasets. Hazard ratio (HR), 95% confidence interval, and log rank p values are shown. (C and D) Cells were transfected with AKTIP siRNA for 24 h before seeding into 96-well plate or culture insert. (C) Cell viability of ERα-positive MCF7 and MDA-MB-361 cells (left), HER2-enriched SKBR3 and HCC1954 cells (middle), and basal-like MDA-MB-231 and MDA-MB-468 cells (right) was measured over 7 days. Day 0 was the day of cell seeding. Data show mean ± SD of triplicates and one representative of three independent experiments. **p < 0.01; ***p < 0.001; ns, no significant difference by two-way ANOVA with Sidak’s multiple comparison test. (D) Cells were allowed to migrate or invade for 16 h. Mean numbers (top) and representative images (bottom) of migrated or invaded MCF7, MDA-MB-361, SKBR3, or HCC1954 cells of five fields at a magnification of 100× (MCF7 and HCC1954), 200× (MDA-MB-361), or 20× (SKBR3) are shown. Scale bar, 200 μm. Data shown are one of three independent experiments. (E) MCF7 cells stably expressing AKTIP shRNA or vector were subcutaneously injected into nude mice (n = 10) for 6 weeks. Image of tumor nodules extracted (left) and tumor weight and volume (right) are shown. Data are presented as mean ± SD. *p < 0.05; **p < 0.01; ***p < 0.001; ****p < 0.0001; ns, no significant difference compared with mock or vector using t test.
Figure 2.
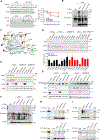
Figure 2.. ERα protein levels are increased in AKTIP-depleted luminal breast cancer cells
(A) Lysates of MCF7 cells transfected with AKTIP siRNA or mock for 72 h were harvested for reverse-phase protein array. The heatmap shows proteins with >20% change in levels in AKTIP-depleted cells normalized to mock-transfected cells. (B and C) Lysates of MCF7 cells stably expressing AKTIP shRNA and MDA-MB-361 cells transfected with AKTIP siRNA for 72 h were subjected to western blotting for proteins of the (B) AKT and (C) ERα pathways. ERK2 was loading control. (D) Cells were transfected with siRNA targeting the 3′ UTR of AKTIP. Eight h later, lentivirus for AKTIP overexpression (OX) was added to the culture for another 72 h prior to protein harvest for western blotting. ERK2 was loading control. (E) Representative immunohistochemical images of AKTIP-depleted and vector xenograft tumor sections stained with anti-AKTIP, anti-ERα, or anti-Ki67 antibody. Scale bar, 100 μm. (F) Human breast tumor tissue samples were subjected to immunohistochemical staining using anti-AKTIP or anti-ERα antibody. Top, representative immunohistochemical images. The boxes depict magnified areas. Scale bar, 200 μm. Bottom, heatmap illustrating the correlation between ERα and AKTIP staining intensities. p value of Pearson correlation analysis is shown. (G) Lysates of MCF7 cells stably expressing AKTIP shRNA and MDA-MB-361 cells transfected with AKTIP siRNA for 72 h were subjected to western blotting for ERβ levels. The western blots shown are representatives of three independent experiments.
Figure 3.
Figure 3.. Protein stability of ERα is enhanced in cells with AKTIP loss through CAND1
(A) MCF7 cells stably expressing AKTIP shRNA or vector were treated with 10 μg/mL cycloheximide (CHX) for the indicated hours before being subjected to western blotting. ERK2 was loading control. The graph shows band intensities quantified by densitometry in ImageJ and normalized to that at 0 h (n = 3). *p < 0.05 using two-way ANOVA for comparison between groups with Sidak’s multiple comparison test. (B) Lysates of AKTIP-depleted or vector control cells were subjected to immunoprecipitation (IP) with anti-ERα antibody before western blotting (immunoblotting [IB]). ERα protein levels were normalized prior to IP by using proportionally different amounts of lysates. IP with normal immunoglobulin G (IgG) was control. (C) AKTIP-bound proteins pulled down in MCF7 cells were identified by mass spectrometry. Protein interaction network of the protein partners was generated by STRING. ERα, which was not pulled down in the IP, was included in the STRING analysis to reveal proteins that potentially interact with ERα. Only proteins in the ubiquitin/proteasome degradation pathway are shown in the network map. Red dots: hits known to inhibit protein ubiquitination. Line thickness reflects the degree of confidence of the interaction. (D–G) MCF7 cells stably expressing AKTIP shRNA or vector were transfected with (D) a pool of 4 siRNA of each gene indicated, (E and F) individual siRNA of CAND1, or (G) OX plasmid of CUL2 or NEDD8 for 72 h. Protein lysates were harvested for western blotting or IP. (H) Lysates of AKTIP-depleted or vector control cells were subjected to IP with anti-CUL2 antibody (top) or anti-CAND1 antibody (bottom) using equal amounts of lysates. (I) Lysates of AKTIP-depleted or vector control cells were subjected to IP with anti-ERα antibody using proportionally different amounts of lysates for equal ERα levels (top) or anti-CUL2 antibody using equal amounts of lysates (bottom). IP with IgG was control. Input was lysate without the IP procedure. Relative densitometric values (after normalization with the immunoprecipitated proteins) are provided below the blots. *p < 0.05; ***p < 0.001; ns, no significant difference compared with mock using t test (n = 3). The western blots shown are representatives of three independent experiments.
Figure 4.
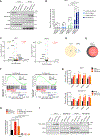
Figure 4.. MCF7 cells with AKTIP loss exhibit ERα-responsive gene expression profiles
(A) Lysates of MCF7 cells stably expressing AKTIP shRNA or vector were harvested for subcellular fractionation before western blotting. GAPDH and lamin A/C are markers for the cytosolic and nuclear fractions, respectively. (B) MCF7 cells were transfected with AKTIP siRNA for 48 h prior to co-transfection of pRL-TK Renilla luciferase plasmids and 3x-ERE-TATA firefly luciferase or pGL2-Basic (vector backbone without 3x-ERE-TATA) plasmids. Cells were treated with or without 10 nM estradiol (E2) for 24 h. Dual-luciferase reporter assay was performed, and the normalized firefly/Renilla luciferase activities are presented. (C) Volcano plots showing the distribution of DEGs (adjusted p < 5%, fold change > 1.2) identified from the RNA-seq analysis of MCF7 (left) and SKBR3 (right) cellsupon AKTIP loss (n = 2). Upregulated and downregulated DEGs are labeled in red and green, respectively. Labeled genes are DEGs validated by real-time PCR. (D) Venn diagram showing the overlap of DEGs between MCF7 and SKBR3 upon AKTIP knockdown. (E) Diagram showing the percentage of estrogen-responsive genes among the 91 DEGs identified in MCF7 upon AKTIP knockdown. (F) GSEA analysis of hallmark gene sets representing early and late estrogen response using ranked gene expression changes in AKTIP siRNA-transfected cells compared with mock-transfected cells. Normalized enrichment score (NES), p value, and FDR are shown. (G) Total RNA of MCF7 and MDA-MB-361 cells transfected with AKTIP siRNA for 72 h was harvested for real-time PCR. GAPDH was internal control. (H) MCF7 cells stably expressing AKTIP shRNA or vector were treated with 10 nM fulvestrant for 48 h before total RNA was harvested for real-time PCR. (I) Lysates of MCF7 cells stably expressing AKTIP shRNA, MDA-MB-361, SKBR3, and MDA-MB-453 cells transfected with AKTIP siRNA for 72 h were subjected to western blotting. ERK2 was loading control. Data are presented as mean ± SD. *p < 0.05; **p < 0.01; ***p < 0.001; ****p < 0.0001; ns, no significant difference using ordinary one-way ANOVA for analysis within group and two-way ANOVA for comparison between groups with Sidak’s multiple comparison test. Bar graphs are mean ± SD of triplicates and one representative of three independent experiments. The western blots shown are representatives of three independent experiments.
Figure 5.
Figure 5.. Loss of AKTIP activates JAK2/STAT3 signaling in ERα-positive breast cancer cells
(A) MCF7 cells stably expressing AKTIP shRNA or vector were transfected with ESR1 siRNA for 24 h before cells were seeded for cell viability assay, which was measured over 7 days (top), or lysates were harvested for western blotting 8 days after siRNA transfection (bottom). ERK2 was loading control. Day 0 was the day of cell seeding. Bar graphs are mean ± SD of triplicates and one representative of three independent experiments. (B) Lysates of MCF7 cells stably expressing AKTIP shRNA, MDA-MB-361, SKBR3, and MDA-MB-453 cells transfected with AKTIP siRNA for 72 h were subjected to western blotting. (C–F) MCF7 stable cells were (C) treated with 10 nM fulvestrant or 1 μM 4-hydroxytamoxifen (4-OH-Tam) for 48 h; (D) SGK3 siRNA for 72 h; (E) 2 μM AZD1480 for 24 h or STAT3 siRNA for 72 h; or (F) 0.5 μM BBI608 for 2 h before lysates were harvested for western blotting. *p < 0.05; ***p < 0.001; ns, no significant difference compared with vector using t test. The western blots shown are representatives of three independent experiments.
Figure 6.
Figure 6.. JAK2 or STAT3 inhibition resensitizes AKTIP-depleted cells to ERα antagonists in vitro
(A) MCF7 cells stably expressing AKTIP shRNA or vector were treated with serially diluted concentrations of fulvestrant for 72 h or 4-OH-Tam for 6 days prior to cell viability assay. Lysates of cells treated with the indicated concentration of fulvestrant were harvested for western blotting (right). ERK2 was loading control. (B) Relapse-free survival of patients with ERα-positive breast cancer with high or low AKTIP mRNA levels stratified at the lower quartile. Cohorts of patients with ERα-positive breast cancer treated with adjuvant tamoxifen (n = 158) were selected for the analysis in the KM plotter. Log rank p value is shown. (C) MCF7 cells stably expressing AKTIP shRNA or vector were treated with serial concentrations of AZD1480 for 72 h. (D and E) MCF7 cells stably expressing AKTIP shRNA or vector were treated with serial concentrations of (D, top) fulvestrant (Ful) with or without 2 μM AZD1480 (AZD) for 72 h; (D, bottom) 4-OH-Tam with or without 2 μM AZD; or (E) 4-OH-Tam with or without 2 μM C188–9 for 6 days. The plots show mean ± SD of triplicates and one representative of three independent experiments. *p < 0.05; **p < 0.01; ***p < 0.001; ****p < 0.0001; ns, no significant difference by two-way ANOVA with Sidak’s multiple comparison test.
Figure 7.
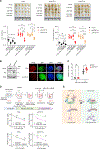
Figure 7.. Responses of AKTIP-depleted cells to ERα antangonist or JAK2/STAT3 inhibitor alone or in combination in xenograft and human breast cancer organoid models
(A) Vector-expressing or AKTIP shRNA-expressing MCF7 tumor-bearing mice (n = 5) were treated with vehicles, 4-OH-TAM (10 mg/kg; once every 2 days), and AZD (20 mg/kg; daily) alone or in combination for 3 weeks. Images of the tumors (top) as well as graphs of tumor weight and tumor volume (bottom) are presented. Error bars represent SD. *p < 0.05; **p < 0.01; ***p < 0.001; ****p < 0.0001; ns, no significant difference using two-way ANOVA with Sidak’s multiple comparison test. (B and C) Human breast cancer organoids were transfected with AKTIP siRNA (B) for 9 days prior to harvest for western blotting or immunofluorescence staining or (C) for a period of 14 days, and cell viability (n = 9 of three independent experiments) was measured at 4 and 14 days post-transfection. The western blots and staining shown are representatives of three independent experiments. Scale bar, 20 μm. **p < 0.01; ns, no significant difference by t test. (D) Top, schematic illustration of the experimental design and treatment timeline of the organoids. BME, basement membrane extract. Bottom, viability of the organoids after treatment with 4-OH-Tam in the presence or absence of 2 μM AZD or 0.5 μM BBI608 for 5 days. The plots show mean ± SD of triplicates and one representative of three independent experiments. *p < 0.05; **p < 0.01; ****p < 0.0001; ns, no significant difference by two-way ANOVA with Sidak’s multiple comparison test. (E) Proposed model of regulation of ERα protein level upon AKTIP loss. When AKTIP is depleted, the binding of CAND1 with cullin 2, and thereby the regulation on cullin 2 by CAND1, is promoted. This may alter the interaction of cullin 2 with substrate receptor (SR) that binds ERα, leading to reduced binding between cullin 2 and ERα. As a result, the ubiquitination and degradation of ERα is decreased. E2, E2 ubiquitin-conjugating enzyme; RBX, RING box protein. The figure was created with BioRender.com.

References

    1. Chia SK, Bramwell VH, Tu D, Shepherd LE, Jiang S, Vickery T, Mardis E, Leung S, Ung K, Pritchard KI, et al. (2012). A 50-gene intrinsic subtype classifier for prognosis and prediction of benefit from adjuvant tamoxifen. Clin. Cancer Res. 18, 4465–4472. 10.1158/1078-0432.CCR-12-0286. - DOI - PMC - PubMed
    1. Russnes HG, Lingjærde OC, Børresen-Dale AL, and Caldas C (2017). Breast cancer molecular stratification: from intrinsic subtypes to integrative clusters. Am. J. Pathol. 187, 2152–2162. 10.1016/j.ajpath.2017.04.022. - DOI - PubMed
    1. Ellis MJ, and Perou CM (2013). The genomic landscape of breast cancer as a therapeutic roadmap. Cancer Discov. 3, 27–34. 10.1158/2159-8290.CD-12-0462. - DOI - PMC - PubMed
    1. Cancer Genome Atlas Network (2012). Comprehensive molecular portraits of human breast tumours. Nature 490, 61–70. 10.1038/nature11412. - DOI - PMC - PubMed
    1. Chin K, DeVries S, Fridlyand J, Spellman PT, Roydasgupta R, Kuo WL, Lapuk A, Neve RM, Qian Z, Ryder T, et al. (2006). Genomic and transcriptional aberrations linked to breast cancer pathophysiologies. Cancer Cell 10, 529–541. 10.1016/j.ccr.2006.10.009. - DOI - PubMed

Publication types

MeSH terms

Substances