. 2023 Jan 9;58(1):3-17.e8.
doi: 10.1016/j.devcel.2022.11.016. Epub 2022 Dec 13.

Developmental cell fate choice in neural tube progenitors employs two distinct cis-regulatory strategies

Affiliations

Developmental cell fate choice in neural tube progenitors employs two distinct cis-regulatory strategies

M Joaquina Delás et al. Dev Cell. .

Abstract

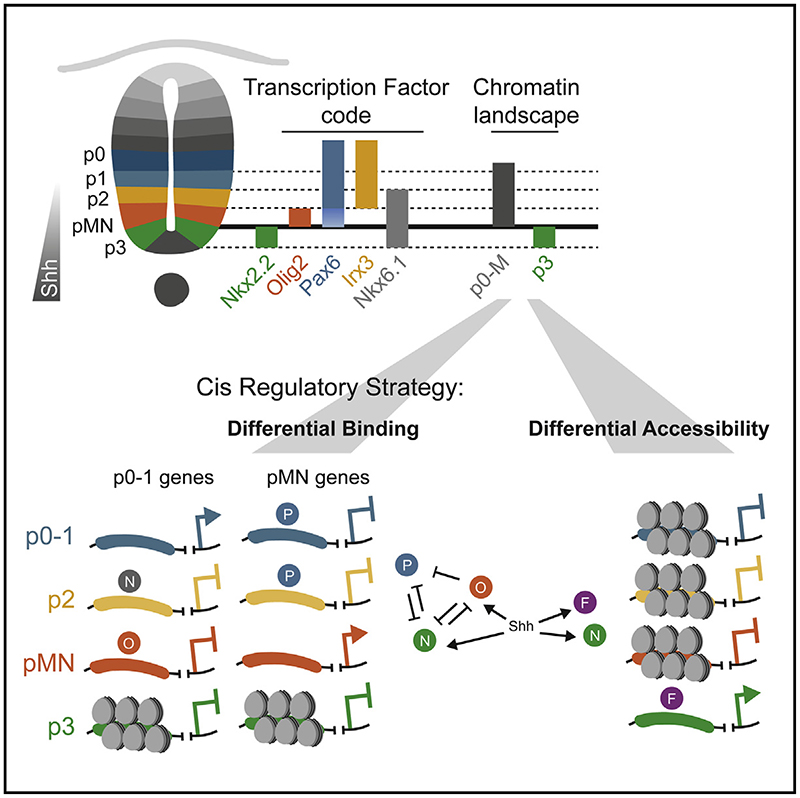
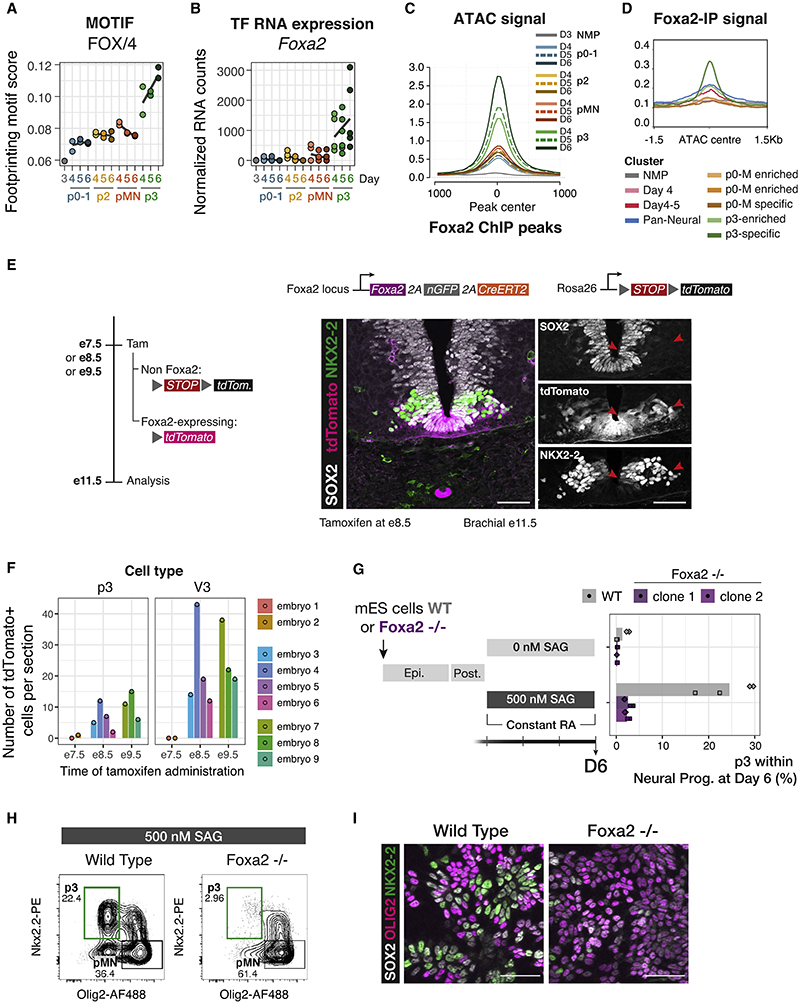
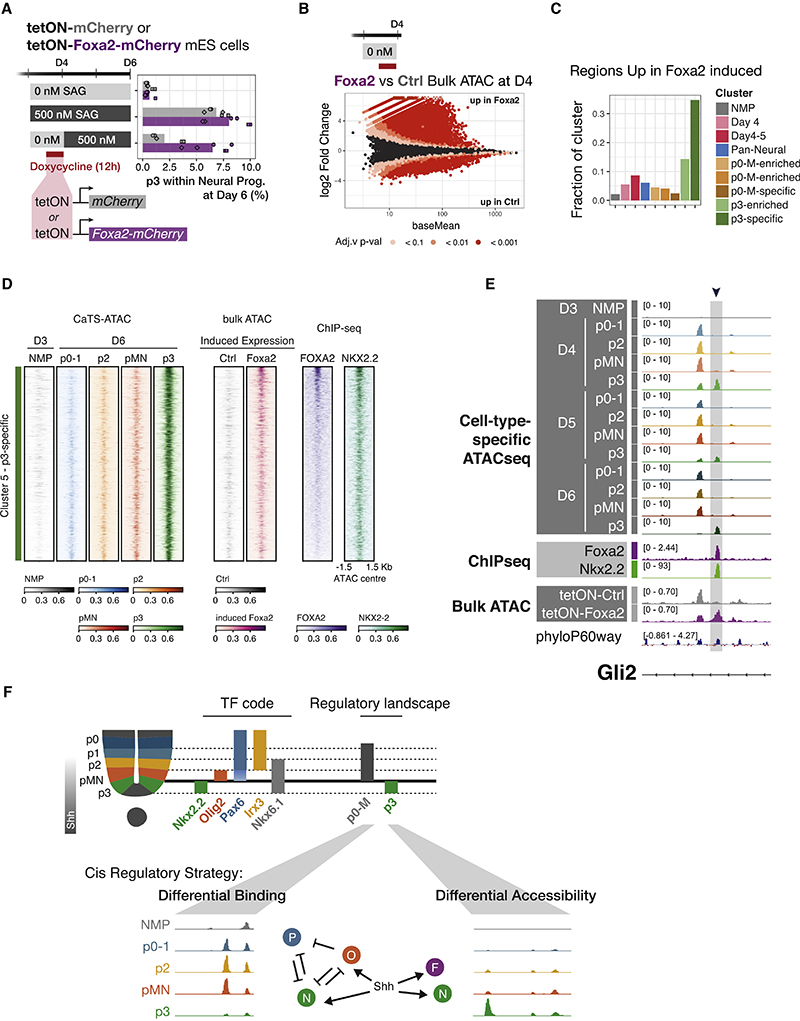
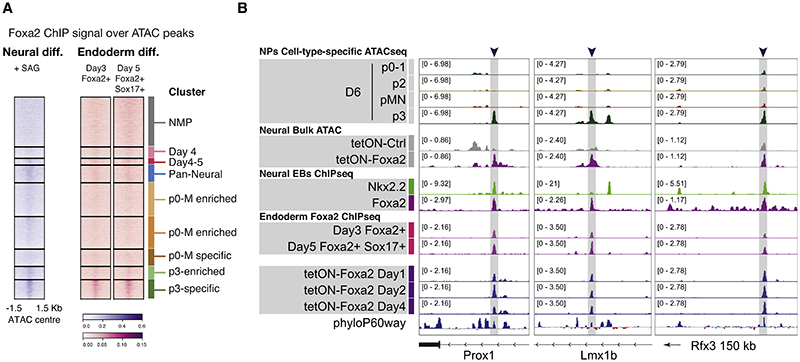
In many developing tissues, the patterns of gene expression that assign cell fate are organized by graded secreted signals. Cis-regulatory elements (CREs) interpret these signals to control gene expression, but how this is accomplished remains poorly understood. In the neural tube, a gradient of the morphogen sonic hedgehog (Shh) patterns neural progenitors. We identify two distinct ways in which CREs translate graded Shh into differential gene expression in mouse neural progenitors. In most progenitors, a common set of CREs control gene activity by integrating cell-type-specific inputs. By contrast, the most ventral progenitors use a unique set of CREs, established by the pioneer factor FOXA2. This parallels the role of FOXA2 in endoderm, where FOXA2 binds some of the same sites. Together, the data identify distinct cis-regulatory strategies for the interpretation of morphogen signaling and raise the possibility of an evolutionarily conserved role for FOXA2 across tissues.

Keywords: Foxa2; chromatin; cis regulation; gene regulation; morphogen; neural tube; sonic hedgehog.


Conflict of interest statement

Declaration of interests The authors declare no competing interests.

Figures

Graphic abstract
Graphic abstract
Figure 1
Figure 1. A stem cell model of ventral neural tube progenitors
(A) Schematic of ventral spinal cord progenitors and the markers used for the combinatorial multi-color flow cytometry and sorting strategies. (B) Schematic of the protocol for the differentiation of mouse ES cells to generate ventral neural progenitors following equivalent signaling cues to embryonic development. (C) Representative flow cytometry plots of the gating strategies used for both analysis and sorting of NPs p0-1, p2, pMN, and p3. Cells were gated as NPs by excluding dead cells and selecting SOX2+. (D) Representative immunohistochemistry of ES cells differentiated for 6 days show expression PAX6 when exposed to 0 nM SAG and NKX2.2 if exposed to 500 nM. At 100 nM SAG, both OLIG2 or NKX2.2 are detected compared with little or no signal at 10 nM SAG. Scale bars, 50 μm. (E) Proportion of NPs at each SAG concentration shows generation of higher proportions of more ventral cell types at increasing SAG concentrations. Dots are individual samples. n = 4 biological replicates for each SAG concentration. Line represents the average. Shaded areas, SEM. SAG, smoothened agonist. See also Figure S1.
Figure 2
Figure 2. Chromatin accessibility reflects cell-type identity independent of SAG concentration
(A) Schematic of CaTS-ATAC, a strategy for cell-type-specific ATAC-seq based on intracellular markers developed for this study. (B) Cell types analyzed from each SAG concentration. (C) Representative genome coverage plot of a differentially accessible region and expression of the nearby gene, Sp8, shows accessibility is consistent for each cell type regardless of the SAG concentration from which it was generated. (D) Quantification of differentially accessible regions between the indicated sample and all other samples at day 5 of differentiation shows no significant differences with the same cell type generated from a different SAG concentration. Thresholds used: absolute fold change > 2, basemean > 100. (E) MA-plot (log2-fold change versus base mean) for the indicated comparisons show large numbers of differentially accessible elements between different cell types generated under the same SAG concentration, but not between the same cell type generated in different SAG concentrations. n = 3 biological replicates. See also Figure S2.
Figure 3
Figure 3. Two regulatory landscapes underlie the Shh response of neural progenitors
(A) Dimensionality reduction (principal component analysis) based on the most variable 30,000 consensus elements shows two different behaviors: a shared one for p0-1, p2, pMN samples, and a different one for p3 samples, regardless of SAG concentration. Each symbol represents a sample colored by differentiation day, SAG concentration, or cell type as indicated in the legend. n = 3 biological replicates (independent differentiations). (B) Heatmap showing ATAC-seq coverage for elements differentially accessible between any two cell types or time points with the same dynamics, grouped in clusters (see STAR Methods) shows decommissioning of the NMP program (cluster 1), a shared pan-neuronal cluster (cluster 4) and two behaviors in cell type-specific accessibility, a shared for p0-1, p2, and pMN samples (clusters 6–8), and a unique program for p3 (clusters 4 and 5). Elements ordered by average accessibility. (C) Heatmap of ChIP-seq coverage for the same elements for NKX6.1, OLIG2, and NKX2.2 performed in neural embryoid bodies treated with SAG shows binding to both pan-neuronal and cell-type-specific elements, and SOX2 from either NMP stage or SAG-treated neural embryoid bodies correlates with accessibility in either NMP or neural progenitors, respectively. (D) Footprinting scores (using TOBIAS, see STAR Methods) for motifs with highly variable scores between p0-1, p2, and pMN at days 5 and 6, and normalized RNA counts for the most correlated TF within the motif archetype. The motifs for cell-type-specific TFs show expected footprinting differences. (E) Example loci that are accessible across p0-pMN but were not accessible at day 3 and do not became accessible in p3 NPs. ChIP-seq for NKX6.1 and OLIG2 shown for the same elements. Normalized expression for nearby genes Neurog2 and Prdm12 shown. Points are individual samples; bars represent average expression. See also Figure S3.
Figure 4
Figure 4. FOXA2 drives the p3-specific chromatin accessibility program
(A) Footprinting score for the FOX motif is highest in p3 samples. (B) Foxa2 expression in p3 NPs suggests it is the most likely candidate to drive the footprinting signal. (C) Average ATAC-seq accessibility at FOXA2 ChIP-seq peaks in the indicated samples shows these regions are highly accessible in p3 NPs. (D) Normalized FOXA2 ChIP-seq coverage showing accessibility in p3-specific elements from the groups of ATAC-seq elements in the indicated clusters from Figure 3B. (E) Genetic lineage tracing indicates that cells that expressed Foxa2 at E8.5 (tamoxifen administration) have contributed to the p3 progenitor and V3 neuronal cell types by E11.5 (red arrows). (F) Quantifications of p3 and V3 cells expressing tdTomato in embryos collected after tamoxifen administration at the indicated times. Biological replicates: n = 2 for E7.5, n = 4 for E8.5, n = 3 for E9.5. (G) Foxa2−/− ES cells fail to generate p3 NPs when exposed to 500 nM SAG. (H) Representative flow cytometry plots of the quantifications in (G) showing a marked reduction in p3 NPs from Foxa2−/− ES cells compared with wild type. Cells are gated for SOX2+ live neural progenitors. (I) Representative immunohistochemistry staining for SOX2, OLIG2 and NKX2,2 showing reduced number of cells expressing NKX2.2 in Foxa2−/− mutant cells at day 6 of differentiation treated with 500 nM SAG. Scale bars, 50 μm. See also Figure S4.
Figure 5
Figure 5. FOXA2 can replace Shh in early p3 specification where it opens p3-specific regulatory elements
(A) A delayed SAG regime greatly reduces p3 generation in control cells (mCherry). A 12 h overexpression of tetON-Foxa2-mCherry rescues p3 generation. n = 3 biological replicates (independent differentiations), and 2 independent samples from each differentiation, for each condition. (B) Differential accessibility in Foxa2 forced expression versus control mCherry shows FOXA2 predominantly opens elements. n = 3 biological replicates (independent differentiations). (C) Overlap of differentially upregulated regions from (B) with ATAC clusters (Figure 3B) reveals a large fraction of the p3-specific cluster is opened upon Foxa2 overexpression. (D) Heatmap showing CaTS-ATAC-seq coverage over all sites in the p3-specific cluster 5, bulk ATAC-seq coverage after induced expression of control or FOXA2, as well as ChIP-seq coverage for FOXA2 and NKX2.2. Regions are ordered by FOXA2 ChIP-signal and depict higher accessibility when FOXA2 (but not control) is induced, concomitant with increased binding of FOXA2 and NKX2.2 in the same regions. (E) Example element in a Gli2 intron with p3-specific chromatin accessibility, FOXA2 and NKX2.2 binding that gains accessibility upon Foxa2 overexpression but not control. (F) Diagram describing the two regulatory landscapes that underlie the molecular identity of ventral neural progenitors, a differential binding strategy is used to distinguish p0-1, p2, pMN, whereas p3 employ a differential accessibility strategy. See also Figure S5.
Figure 6
Figure 6. A common regulatory role of FOXA2 in ventral neural and endoderm lineages
(A) Heatmap of ChIP-seq coverage for neural FOXA2 and endoderm FOXA2 at two differentiation time points show binding for both in the p3-specific accessibility cluster. (B) Potentially functionally relevant target genes expressed and/or required in both tissues, with p3-specific accessibility, opened in response to FOXA2 overexpression, bound by FOXA2 in neural and endoderm, including overexpression of FOXA2. See also Figure S6.

Comment in

References

    1. Spitz F, Furlong EEM. Transcription factors: from enhancer binding to developmental control. Nat Rev Genet. 2012;13:613–626. doi: 10.1038/nrg3207. - DOI - PubMed
    1. Rogers KW, Schier AF. Morphogen gradients: from generation to interpretation. Annu Rev Cell Dev Biol. 2011;27:377–407. doi: 10.1146/annurev-cellbio-092910-154148. - DOI - PubMed
    1. Jessell TM. Neuronal specification in the spinal cord: inductive signals and transcriptional codes. Nat Rev Genet. 2000;1:20–29. doi: 10.1038/35049541. - DOI - PubMed
    1. Echelard Y, Epstein DJ, St-Jacques B, Shen L, Mohler J, McMahon JA, McMahon AP. Sonic hedgehog, a member of a family of putative signaling molecules, is implicated in the regulation of CNS polarity. Cell. 1993;75:1417–1430. doi: 10.1016/0092-8674(93)90627-3. - DOI - PubMed
    1. Roelink H, Augsburger A, Heemskerk J, Korzh V, Norlin S, Ruiz i Altaba AR, Tanabe Y, Placzek M, Edlund T, Jessell TM. Floor plate and motor neuron induction by vhh-1, a vertebrate ho-molog of hedgehog expressed by the notochord. Cell. 1994;76:761–775. doi: 10.1016/0092-8674(94)90514-2. - DOI - PubMed

Publication types

Substances