

How much of the stalled mortality trends in Scotland and England can be attributed to obesity?
- PMID: 36517089
- PMCID: PMC9756156
- DOI: 10.1136/bmjopen-2022-067310
How much of the stalled mortality trends in Scotland and England can be attributed to obesity?
Abstract
Objectives: The rate of improvement in all-cause mortality rates has slowed in the UK since around 2012. While evidence suggests that UK Government 'austerity' policies have been largely responsible, it has been proposed that rising obesity may also have contributed. The aim here was to estimate this contribution for Scotland and England.
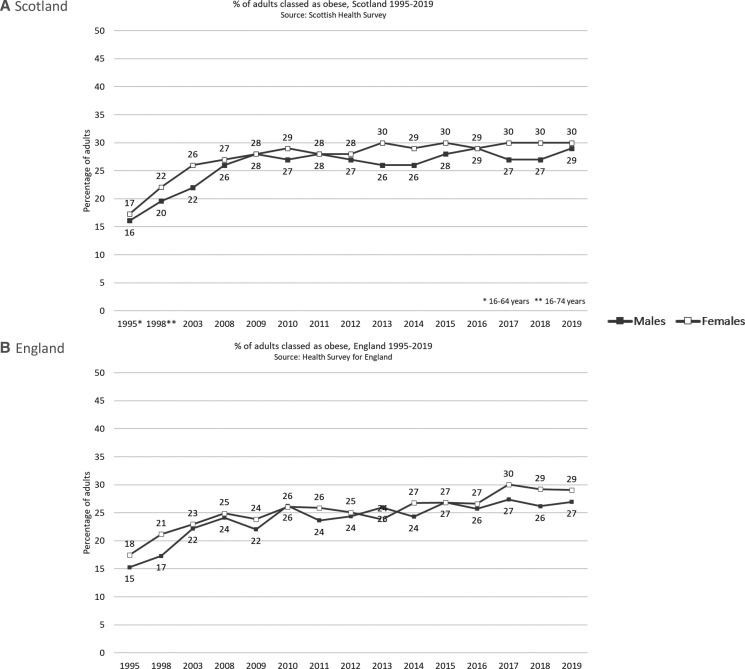
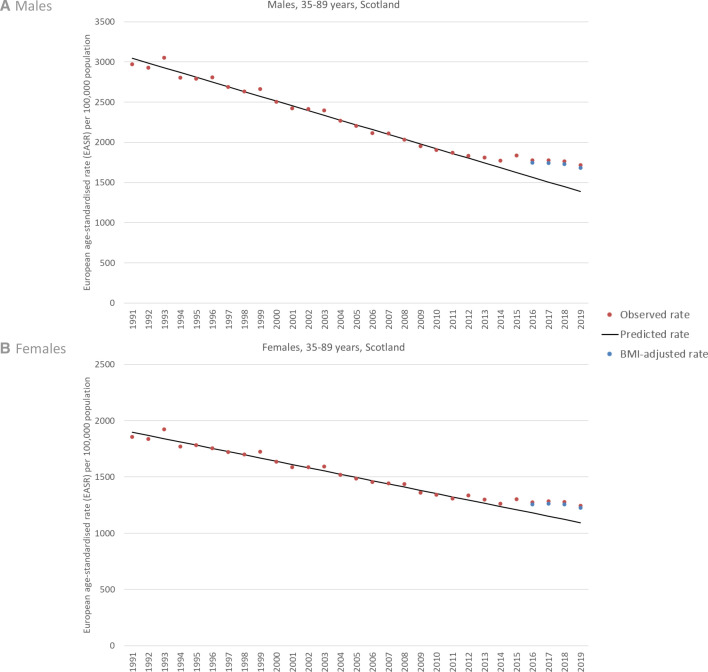
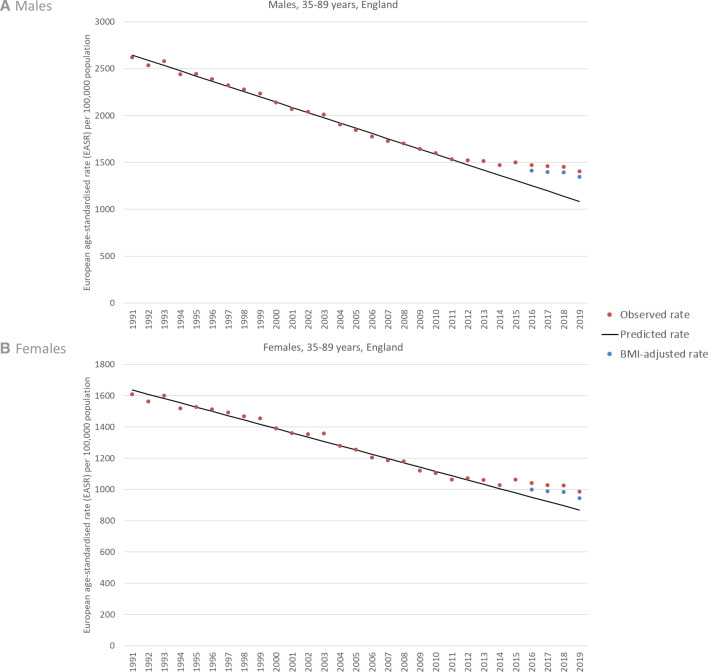
Methods: We calculated population attributable fractions (PAFs) resulting from changes in Body Mass Index (BMI) between the mid-1990s and late 2000s for all-cause mortality among 35-89-year olds in 2017-2019. We used BMI data from national surveys (the Scottish Health Survey and the Health Survey for England), and HRs from a meta-analysis of 89 European studies. PAFs were applied to mortality data for 2017-2019 (obtained from national registries), enabling comparison of observed rates, BMI-adjusted rates and projected rates. Uncertainty in the estimates is dominated by the assumptions used and biases in the underlying data, rather than random variation. A series of sensitivity analyses and bias assessments were therefore undertaken to understand the certainty of the estimates.
Results: In Scotland, an estimated 10% (males) and 14% (females) of the difference between observed and predicted mortality rates in 2017-2019 may be attributable to previous changes in BMI. The equivalent figures for England were notably higher: 20% and 35%, respectively. The assessments of bias suggest these are more likely to be overestimates than underestimates.
Conclusions: Some of the recent stalled mortality trends in Scotland and England may be associated with earlier increases in obesity. Policies to reduce the obesogenic environment, including its structural and commercial determinants, and reverse the impacts of austerity, are needed.
Keywords: epidemiology; public health; social medicine.
© Author(s) (or their employer(s)) 2022. Re-use permitted under CC BY-NC. No commercial re-use. See rights and permissions. Published by BMJ.
Conflict of interest statement
Competing interests: None declared.
Figures
References
Publication types
MeSH terms
LinkOut - more resources
Full Text Sources
Medical