. 2022 Dec 14;13(1):7707.
doi: 10.1038/s41467-022-34510-3.

Optimal deep brain stimulation sites and networks for stimulation of the fornix in Alzheimer's disease

Affiliations

Optimal deep brain stimulation sites and networks for stimulation of the fornix in Alzheimer's disease

Ana Sofía Ríos et al. Nat Commun. .

Abstract

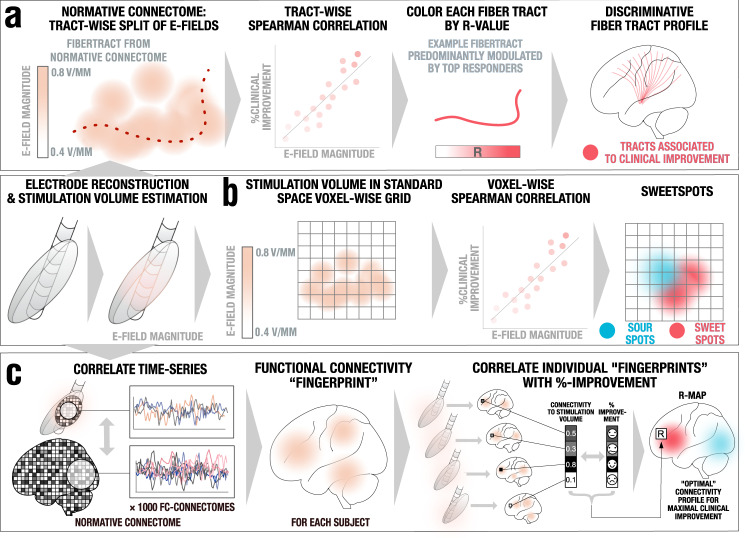
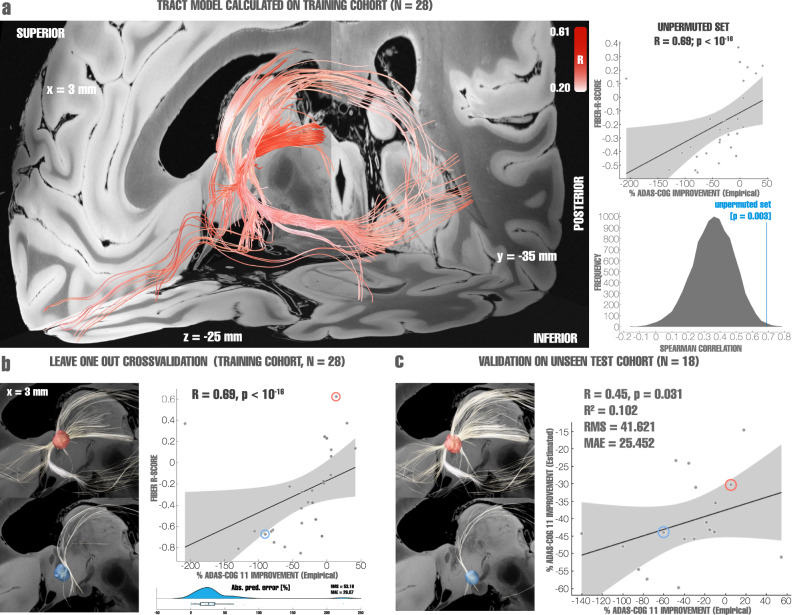
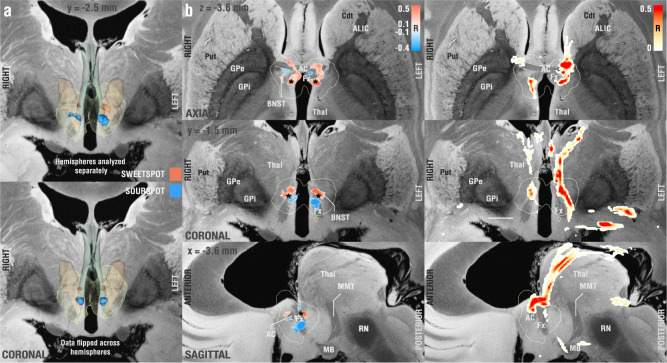
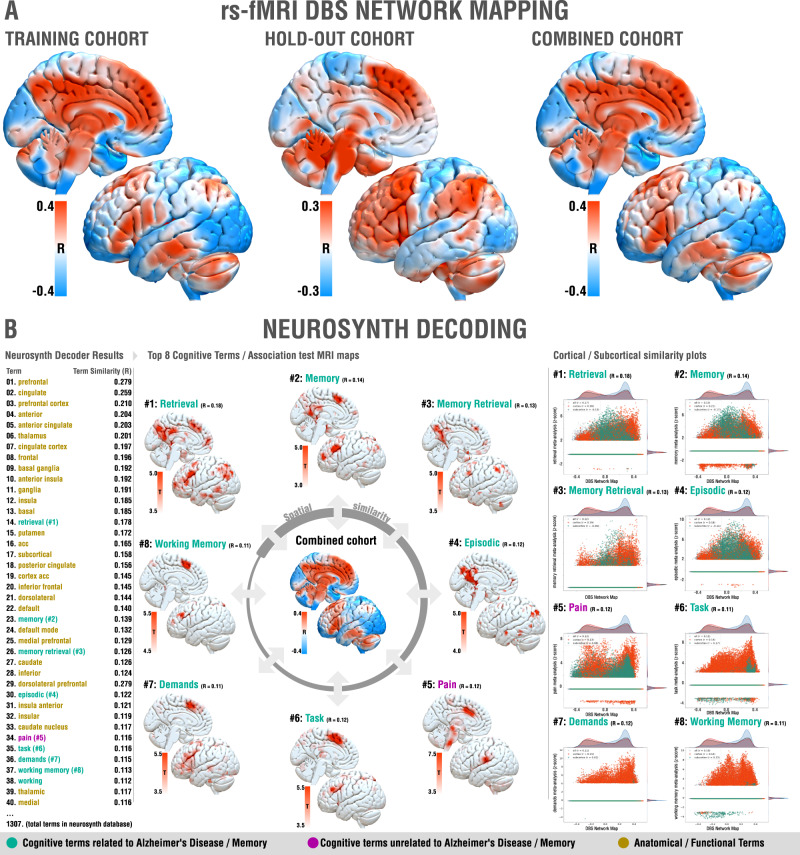
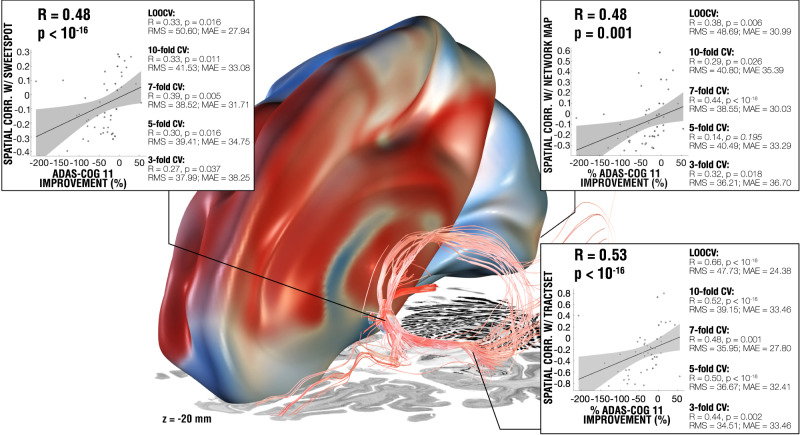
Deep brain stimulation (DBS) to the fornix is an investigational treatment for patients with mild Alzheimer's Disease. Outcomes from randomized clinical trials have shown that cognitive function improved in some patients but deteriorated in others. This could be explained by variance in electrode placement leading to differential engagement of neural circuits. To investigate this, we performed a post-hoc analysis on a multi-center cohort of 46 patients with DBS to the fornix (NCT00658125, NCT01608061). Using normative structural and functional connectivity data, we found that stimulation of the circuit of Papez and stria terminalis robustly associated with cognitive improvement (R = 0.53, p < 0.001). On a local level, the optimal stimulation site resided at the direct interface between these structures (R = 0.48, p < 0.001). Finally, modulating specific distributed brain networks related to memory accounted for optimal outcomes (R = 0.48, p < 0.001). Findings were robust to multiple cross-validation designs and may define an optimal network target that could refine DBS surgery and programming.


Conflict of interest statement

C.N. was supported by the German Research Foundation (Deutsche Forschungsgemeinschaft, DFG NE 2276/1-1). K.F. received grants and personal fees from Medtronic and Boston Scientific, grants from Abbott/St. Jude, and Functional Neuromodulation outside the submitted work. D.W. received grants from Functional Neuromodulation during conduct of this study, grants and personal fees from Avid/Lily, and Merck, personal fees from Jannsen, GE Healthcare, Biogen and Neuronix outside the submitted work. S.S. receives personal fees from Elsai, Lilly, Roche Novartis and Biogen outside the submitted work. M.S. received personal fees from Allergan, Biogen, Roche-Genentech, Cortexyme, Bracket, Sanofi, and other type of support from Brain Health Inc and uMethod Health outside of the submitted work. C.L. received grants from Functional Neuromodulation Inc. during conduct of this study, from Avanir and Eli Lily and NFL Benefits Office outside of the submitted work. M.O. received grants from NIH, Tourette Association of America Grant, Parkinson’s Alliance, Smallwood Foundation, and personal fees from Parkinson’s Foundation Medical Director, Books4Patients, American Academy of Neurology, Peerview, WebMD/Medscape, Mededicus, Movement Disorders Society, Taylor and Francis, Demos, Robert Rose and non-financial support from Medtronic outside of the submitted work. A.L. received grants from Medtronic and Functional Neuromodulation during conduct of this study, personal fees from Medtronic, St. Jude, Boston Scientific, and Functional Neuromodulation outside of submitted work. A.L. disclosed having a patent “US Patent 8,346,365. Lozano AM. Cognitive function within a human brain. 2013” licensed to Functional Neuromodulation. A.H. was supported by the German Research Foundation (Deutsche Forschungsgemeinschaft, 424778381 – TRR 295), Deutsches Zentrum für Luft- und Raumfahrt (DynaSti grant within the EU Joint Programme Neurodegenerative Disease Research, JPND), the National Institutes of Health (R01 13478451, 1R01NS127892-01 & 2R01 MH113929) as well as the New Venture Fund (FFOR Seed Grant). ADvance was supported by the National Institute on Aging (R01AG042165) and Functional Neuromodulation Ltd., the sponsor of the study. Other co-authors report no conflicts of interest.

Figures

Fig. 1
Fig. 1. Overview of the three methods applied.
A pre-requisite to run these analyses is to reconstruct the electrode trajectory and localization to then estimate the stimulation volume following the finite element method (FEM). a DBS fiber filtering. Stimulation volumes as E-fields were pooled in standard space and overlaid on an ultra-high resolution normative connectome. Peak E-field magnitudes along each tract were aggregated for each stimulation volume and Spearman rank-correlated with clinical outcomes. This led to weights that were assigned to each fibertract. b DBS Sweetspot mapping. For each voxel, the E-field magnitudes and clinical outcomes were Spearman rank-correlated, leading to a map with positive and negative associations (sweet and sour spots). c DBS network mapping. Seeding BOLD-signal fluctuations from each E-field in a normative functional connectome consisting of rs-fMRI scans from 1000 healthy participants yielded a functional connectivity “fingerprint” map for each patient. Maps were then Spearman rank-correlated with clinical improvement in a voxel-wise manner to create an R-map model of optimal network connectivity.
Fig. 2
Fig. 2. Validation of tract models predictive of clinical improvements as evaluated using ADAS-cog 11.
a Left: Optimal set of tracts to be modulated as calculated from the entire training cohort (N = 28 subjects), red intensity codes for R-values ranging from 0.2 to 0.6, with darker colors indicating higher R-values. Right: permutation analysis calculated on the entire training cohort (R = 0.69 at p = 0.003). b Top left: stimulation volume of a patient with top clinical improvement overlapping the tracts associated with optimal clinical improvements (calculated leaving out the subject, N = 28-1 = 27 subjects). Fibers displayed in white correspond to the portion of optimal fibers intersecting with the patient’s stimulation volume. Bottom left: Same analysis carried out with a poor-responding example patient. Right: Cross-validation within the training cohort (N = 28) using a leave-one-out design (top, R = 0.69 at p < 10−16), Spearman correlation between the degree of stimulation of positive fibertracts (aggregated R-scores under each E-field) and clinical improvements, and within-fold analysis, reporting root mean square error (RMS) and median absolute error (MAE). The boxplot displays the interquartile range in the box with the median percentual absolute predicted error as a vertical line, whiskers extend to 1.5 times the interquartile range, outlier points outside of this range are plotted (bottom). The two example patients are marked in the correlation plot with circles. c Optimal tracts calculated from the entire training cohort (as shown in panel a, N = 28) were used to cross-predict outcomes in N = 18 patients of the hold-out cohort (R = 0.45, p = 0.031). Left: two example cases from the hold-out cohort are shown, a top responding patient’s stimulation volume with corresponding connected (white) optimal fibers defined by the training cohort; and a poor-responding patient’s stimulation volume with corresponding connected (white) fibers. The two example patients are marked in the correlation plot with circles. Right: Spearman correlation between the degree of stimulating positively correlated tracts from the training cohort by the hold-out cohort and clinical improvements of the latter, gray shaded areas represent 95% confidence intervals. Fiber tracts and example stimulation volumes were superimposed on slices of a 100-µm, 7T brain scan in MNI 152 space.
Fig. 3
Fig. 3. Probabilistic mapping of sweet and sour spots associated with clinical outcome.
a Identified clusters of sweet (red) and sour (blue)-spots in a 3D view, superimposed on slices of a 100-µm, 7T brain scan in MNI 152 space. Since the result was symmetric, on the bottom of the panel, we flipped stimulation volumes across hemispheres to further increase robustness on a voxel-level (effectively doubling the number of electrodes used in each hemisphere). b Axial, coronal, and sagittal views of sweet and sourspot peak coordinates (also see supplementary table 6). Projections of cluster center coordinates are marked by a black asterisk and directly project onto the intersection between fornix and bed nucleus of stria terminalis (BNST, see also supplementary Fig. 6). c Axial, coronal, and sagittal sections showing DBS fiber filtering results obtained from the whole cohort at MNI: X = −3.6, Y = −1.5, and Z = −3.6. Put Putamen, Cdt Caudate, ALIC Anterior limb of the internal capsule, AC Anterior commissure, GPe/i external/internal pallidum, Thal thalamus, RN red nucleus, MB mamillary bodies, Fx Fornix. Fornix is shown in blue-green color, informed by the CoBrALab Atlas. Bed nucleus of the stria terminalis shown in light brown color, informed by Neudorfer et al..
Fig. 4
Fig. 4. Functional network results.
A Functional networks associated with optimal improvements across training (left), hold-out (middle) and combined (right) cohorts. Brain regions are color-coded by correlations between degree of functional connectivity with DBS electrodes and clinical improvements across the cohorts. Since results were highly symmetric, only the left hemisphere is shown. B Optimal network associations to Neurosynth database terms, left: highlighted relevant regions for the most similar networks identified; right: similarity plots between same networks and the optimal network identified by DBS Network Mapping results (x-axis = specific network meta-analysis, z-score, y-axis = DBS Network Map).
Fig. 5
Fig. 5. Results summary including the models from DBS fiber filtering, sweetspot mapping and network mapping.
The three levels of analysis were able to explain a similar amount of variance of clinical outcomes when analyzed in a circular nature (see scatterplots; ∼16–19%) and led to significant cross-predictions of clinical outcomes across leave-one-patient-out and multiple k-fold designs, plots show fitting of a linear model that represents the degree to which stimulating voxels (left), functional regions (top-right) and tracts (bottom-right) explain variance in clinical outcomes across the whole cohort (N = 46) using Spearman correlation, gray shaded areas represent 95% confidence intervals. Three level analysis results were superimposed on slices of a brain cytoarchitecture atlas in MNI 152 space. See supplementary Fig. 7 for additional metrics on each validation approach. RMS Root mean square error, MAE Median absolute error.
Fig. 6
Fig. 6. White matter bundle associated with occurrence of flashback-like phenomena.
a Fiber tracts correlated to the presence of flashback-like events, connected fibers were corrected for multiple comparisons using the False Discovery Rate (FDR) at a 5% α-level. b Brain surface (lateral view) overlaid with results from a (left), in comparison to Penfield’s original work on mapping the presence of electrical stimulation-induced “experiential phenomena” in 40 patients suffering from temporal lobe seizures in a total of 1288 reviewed surgical cases covering a large fraction of the cortical mantle (right). Adapted with permission from.

References

    1. Winston W. Economic burden of Alzheimer disease and managed care considerations. Am. J. Manage. Care. 2020;26:S177–S183. doi: 10.37765/ajmc.2020.88482. - DOI - PubMed
    1. Hyman BT, et al. National Institute on Aging-Alzheimer’s Association guidelines for the neuropathologic assessment of Alzheimer’s disease. Alzheimers Dement. 2012;8:1–13. doi: 10.1016/j.jalz.2011.10.007. - DOI - PMC - PubMed
    1. Greicius MD, Srivastava G, Reiss AL, Menon V. Default-mode network activity distinguishes Alzheimer’s disease from healthy aging: Evidence from functional MRI. Proc. Natl Acad. Sci. 2004;101:4637–4642. doi: 10.1073/pnas.0308627101. - DOI - PMC - PubMed
    1. Mevel K, Chételat G, Eustache F, Desgranges B. The default mode network in healthy aging and Alzheimer’s disease. Int J. Alzheimers Dis. 2011;2011:535816. - PMC - PubMed
    1. Canter RG, Penney J, Tsai L-H. The road to restoring neural circuits for the treatment of Alzheimer’s disease. Nature. 2016;539:187–196. doi: 10.1038/nature20412. - DOI - PubMed

Publication types