. 2022 Dec 14;13(1):7752.
doi: 10.1038/s41467-022-35189-2.

Biodiversity-stability relationships strengthen over time in a long-term grassland experiment

Affiliations

Biodiversity-stability relationships strengthen over time in a long-term grassland experiment

Cameron Wagg et al. Nat Commun. .

Abstract

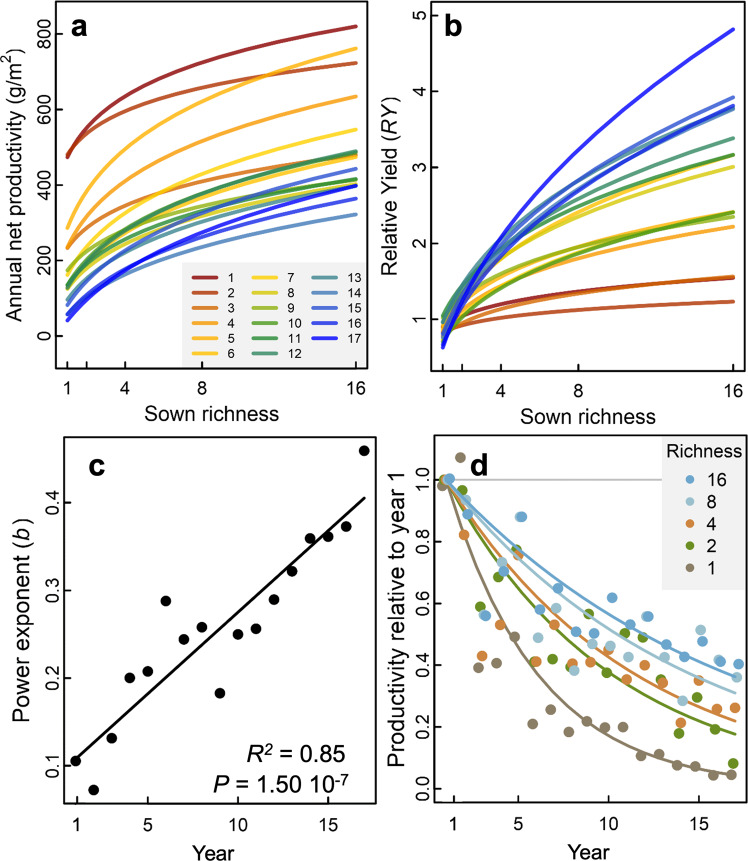
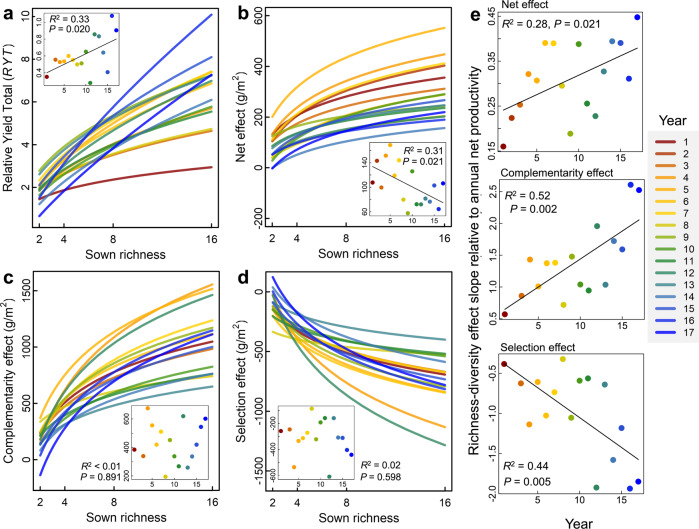
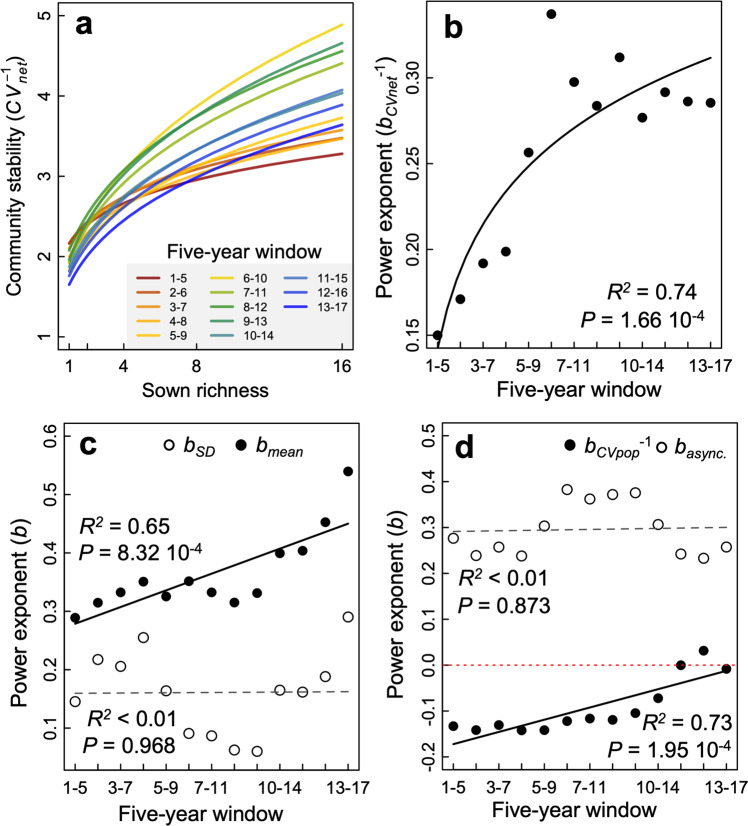
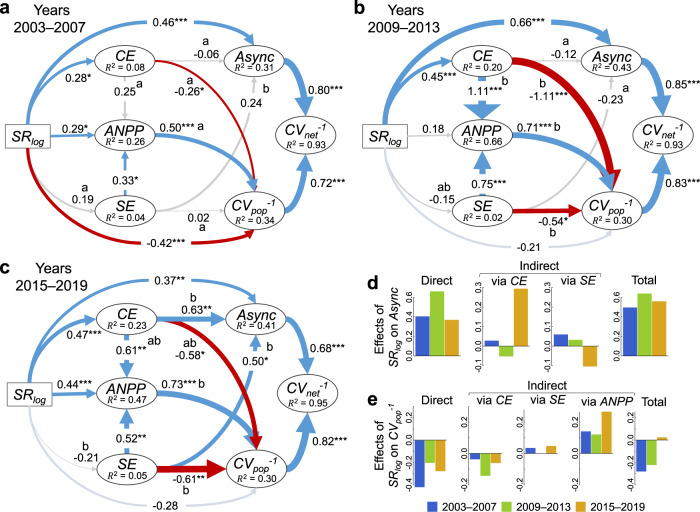
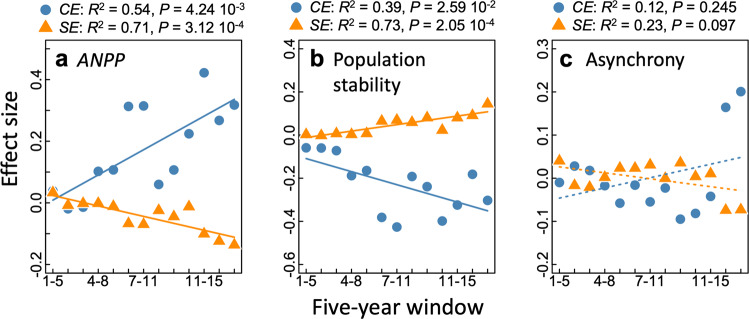
Numerous studies have demonstrated that biodiversity drives ecosystem functioning, yet how biodiversity loss alters ecosystems functioning and stability in the long-term lacks experimental evidence. We report temporal effects of species richness on community productivity, stability, species asynchrony, and complementarity, and how the relationships among them change over 17 years in a grassland biodiversity experiment. Productivity declined more rapidly in less diverse communities resulting in temporally strengthening positive effects of richness on productivity, complementarity, and stability. In later years asynchrony played a more important role in increasing community stability as the negative effect of richness on population stability diminished. Only during later years did species complementarity relate to species asynchrony. These results show that species complementarity and asynchrony can take more than a decade to develop strong stabilizing effects on ecosystem functioning in diverse plant communities. Thus, the mechanisms stabilizing ecosystem functioning change with community age.


Conflict of interest statement

The authors declare no competing interests.

Figures

Fig. 1
Fig. 1. Sown species richness–productivity relationships through time.
The log-linear relationships between sown species richness and a aboveground net primary productivity (ANPP square root transformed prior to analysis) of the communities and b relative yield (ANPP divided by mean ANPP of monocultures in that year) of the communities are shown for each year (1 = 2003, 17 = 2019). c The slope of the log–log relationship (power exponent b of curves shown in b) corresponding to the increase in biomass per added species relative to the mean ANPP of all monocultures for each year. d The change in ANPP of the communities over time relative to their ANPPs in year 1 for each sown species richness level 1–16.
Fig. 2
Fig. 2. Effects of sown species richness on the annual biodiversity effects.
The effects of richness on the a relative yield total (RYT), b net, c complementarity, and d selection biodiversity effects are shown for each year (1 = 2003, 17 = 2019). Panels ad show the regression trend of the effect of sown richness for each of the 17 years (fitting the dependent variable against log species richness. The RYT was also log-transformed prior to analysis. Linear regression relationships are shown on the original scale and the significance for a difference from 0 was two-sided). Inset is the slope of those relationships for each year with the fit statistic (R2) for the effect of species richness on the biodiversity effects with increasing time, where solid lines highlight significant temporal changes. Since the net, complementarity, and selection effects are measured on a scale of the ANPP (g/m2), which declines across the years, in (e), we also show the slopes of the effects of species richness on biodiversity effects divided by the average ANPP of all plots for each year.
Fig. 3
Fig. 3. Effects of species richness on community stability and its underlying components.
In a the richness-community stability (CVnet−1), relationships are sown for each 5-year window indicated by different colors (1 = 2003, 17 = 2019). b The change in the slope of the log–log relationship between richness and community stability (power exponent b of curves shown in a for each consecutive 5-year rolling window. The solid regression line was fit using the relationship slope~log(window). Similarly, c are the regression coefficients of richness on the five-year temporal mean and SD in community productivity and d on the population stability (CVpop−1) and asynchrony (async.) of the log–log relationships. These coefficients are relative effects of richness on community stability as bmean  − bSD and basync + bCVpop−1 are the slope of the log–log relationship between richness and community stability (bCVnet−1) shown in b (see Methods). Black and dashed regression lines respectively highlight significant and non-significant trends along the rolling windows. Tests for significance are two-sided for a difference from 0.
Fig. 4
Fig. 4. Linking temporal changes in biodiversity effects with stability over three non-overlapping 5-year windows.
The structural equation model shows the species richness (SRlog) effects on the 5-year community productivity (ANPP) and indirectly through the 5-year complementarity (CE) and selection (SE) effects that together affect species population stability (CVpop−1) and asynchrony (Async). Standardized path coefficients are indicated by arrows with significant positive effects in blue and negative in red. Significance is indicated by *P < 0.05, **P < 0.01, and ***P < 0.001. Different letters adjacent to coefficients indicate significant differences between models ac (P < 0.05, no multiple comparison adjustments made). Async and CVpop−1 were allowed to covary, as well as the CE and SE. Fit statistics for the multigroup structural equation model: Χ2 = 16.1, P = 0.375; RMSEA = 0.035, PRMSEA= 0.524. In d and e, the direct effects, indirect effects, and the total summed effect, of species richness on asynchrony and population stability are shown, respectively. Tests for significance are two-sided for a difference from 0.
Fig. 5
Fig. 5. Indirect effects of species richness on community stability through the 5-year complementarity (CE) and selection (SE) effects across 5-year rolling windows.
a indirect effects through the CE and SE on community stability by their effects on ANPP (richness - > CE/SE - > ANPP - > population stability - > community stability), b by their effects on population stability (richness -> CE/SE - > population stability -> community stability), and c by their effects on asynchrony (richness -> CE/SE - > Asynchrony -> community stability). Solid lines indicate significant regression trends and dotted lines non-significant trends. Tests for significance are two-sided for a difference from 0. See Fig. S6 for 3-year windows.

References

    1. Doak DF, et al. The statistical inevitability of stability‐diversity relationships in community ecology. Am. Nat. 1998;151:264–276. doi: 10.1086/286117. - DOI - PubMed
    1. Schläpfer F, Schmid B. Ecosystem effects of biodiversity: a classification hypotheses and exploration of empirical results. Ecol. Appl. 1999;9:893–912. doi: 10.1890/1051-0761(1999)009[0893:EEOBAC]2.0.CO;2. - DOI
    1. Lehman CL, Tilman D. Biodiversity, stability, and productivity in competitive communities. Am. Nat. 2000;156:534–552. doi: 10.1086/303402. - DOI - PubMed
    1. Allan E, et al. More diverse plant communities have higher functioning over time due to turnover in complementary dominant species. Proc. Natl Acad. Sci. USA. 2011;108:17034–17039. doi: 10.1073/pnas.1104015108. - DOI - PMC - PubMed
    1. Isbell F, et al. High plant diversity is needed to maintain ecosystem services. Nature. 2011;477:199–202. doi: 10.1038/nature10282. - DOI - PubMed

Publication types