. 2023 Aug;48(9):1347-1357.
doi: 10.1038/s41386-022-01519-7. Epub 2022 Dec 14.

Microglial P2Y12 mediates chronic stress-induced synapse loss in the prefrontal cortex and associated behavioral consequences

Affiliations

Microglial P2Y12 mediates chronic stress-induced synapse loss in the prefrontal cortex and associated behavioral consequences

Justin L Bollinger et al. Neuropsychopharmacology. 2023 Aug.

Abstract

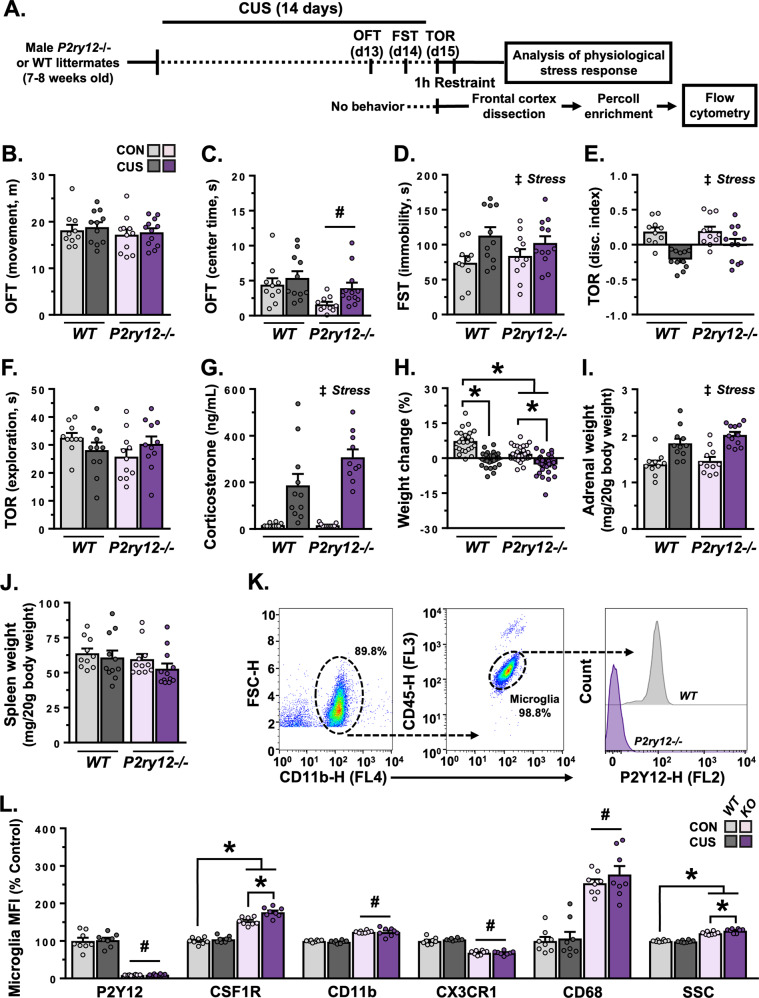
Chronic unpredictable stress (CUS) drives microglia-mediated neuronal remodeling and synapse loss in the prefrontal cortex (PFC), contributing to deficits in cognition and behavior. However, it remains unclear what mechanisms guide microglia-neuron interactions in stress. Evidence indicates that neuronal activity-dependent purinergic signaling directs microglial processes and synaptic engagement via P2Y12, a purinergic receptor exclusively expressed by microglia in the brain. Stress alters excitatory neurotransmission in the PFC, thus we aimed to determine if P2Y12 signaling promotes functional changes in microglia in chronic stress. Here we used genetic ablation of P2Y12 (P2ry12-/-) or pharmacological blockade (clopidogrel, ticagrelor) to examine the role of purinergic signaling in stress-induced microglia-neuron interaction. Multiple behavioral, physiological, and cytometric endpoints were analyzed. Deletion of P2Y12 led to a number of fundamental alterations in the PFC, including the heightened microglial number and increased dendritic spine density. Flow cytometry revealed that microglia in P2ry12-/- mice had shifts in surface levels of CX3CR1, CSF1R, and CD11b, suggesting changes in synaptic engagement and phagocytosis in the PFC. In line with this, pharmacological blockade of P2Y12 prevented CUS-induced increases in the proportion of microglia with neuronal inclusions, limited dendritic spine loss in the PFC, and attenuated alterations in stress coping behavior and working memory function. Overall, these findings indicate that microglial P2Y12 is a critical mediator of stress-induced synapse loss in the PFC and subsequent behavioral deficits.


Conflict of interest statement

The authors declare no competing interests.

Figures

Fig. 1
Fig. 1. Constitutive ablation of P2Y12 attenuates stress effects on coping behavior and working memory, and induces significant alterations in frontal cortex microglia.
A Male wild-type or P2ry12–/– mice were exposed to 14 days of chronic unpredictable stress (CUS) or were handled as controls (CON). One cohort was subjected to behavioral testing, an acute stress challenge, and analysis of stress-sensitive organ weight (n = 10–12/group). B Average distance moved in the open field test (OFT). C Average time spent in the center zone in the OFT. D Average time spent immobile in the forced swim test (FST). E Discrimination index in the temporal object recognition task (TOR). F Average time spent exploring objects in the TOR. G Levels of plasma corticosterone in mice subjected to an acute restraint stress challenge. H Body weight was measured prior to stress and post-CUS exposure, and percent weight change was calculated for all animals regardless of experimental endpoint (n = 24–29/group). I Adrenal weight relative to animal body weight. J Spleen weight relative to animal body weight. K In a separate cohort of mice, brains were extracted, frontal cortex was dissected out, and microglia were isolated and characterized using flow cytometry (n = 8/group). Representative dot plots of FSC-H/CD11b-H and CD45-H/CD11b-H are shown. Histogram depicts levels of P2Y12 fluorescence in frontal cortex microglia in representative WT and P2y12–/– mice. L Normalized mean fluorescence intensity of P2Y12, CSF1R, CD11b, CX3CR1, and CD68 in frontal cortex microglia. Normalized mean side scatter profile is shown. Bars represent mean ± S.E.M. *p < 0.05, pairwise comparison indicated (significant interaction). #p < 0.05, significant main effect of genotype. Stressp < 0.05, significant main effect of stress.
Fig. 2
Fig. 2. Loss of P2Y12 increases lysosome markers in the medial prefrontal cortex and prevents dendritic remodeling in chronic stress.
Male Thy1-GFP(M) wild-type or P2ry12–/– mice were exposed to 14 days of chronic unpredictable stress (CUS) or were handled as controls. Approximately 4 h after the final stressor, mice were perfused and brains were collected, sectioned, immunostained, and imaged (n = 5–9/group). A Confocal images of microglia (IBA1, red), dendritic segments (Thy1-GFP, green), and microglial lysosomes (CD68, blue) were obtained from lamina I of the mPFC. Crosshairs note either a microglial process in close proximity to dendritic elements or a dendritic element localized within a microglial cell body or process extension. Inset shows a magnified view of dendritic material in the noted location, with lysosome area marked (blue dashed line). Alongside merged channels, orthogonal cross-sections matching the noted location are depicted for each group. White scale bar represents 10 µm. B Left: Proportion of microglia with GFP + inclusions in the mPFC. Right: Proportion of phagocytic microglia with GFP + inclusions exclusively in their soma (bottom panel) or processes (middle panel), or within both their soma and processes (top panel). C Number of GFP + inclusions within microglia with dendritic elements. D Average GFP + inclusion volume within microglia. E Average volume of CD68 per microglial cell. F Representative images of dendritic segments (left) and average dendritic spine density (right). White scale bar represents 5 µm. Bars represent mean ± S.E.M. *p < 0.05, pairwise comparison indicated (significant interaction). #p < 0.05, significant main effect of genotype. Stressp < 0.05, significant main effect of stress.
Fig. 3
Fig. 3. Pharmacological blockade of microglial P2Y12 attenuates stress effects on behavior and shifts microglial phenotype in the frontal cortex.
A Male wild-type or Thy1-GFP(M) mice were exposed to 14 days of chronic unpredictable stress (CUS) or were handled as controls. During this time, animals received daily injections of either vehicle, clopidogrel, or ticagrelor. One cohort was subjected to behavioral testing (n = 9–20/group). B Average time spent immobile in the forced swim test (FST). C Discrimination index in the temporal object recognition task (TOR). D Average time spent exploring objects in the TOR. E In a separate cohort of mice, brains were extracted, frontal cortex was dissected out, and microglia were isolated and characterized using flow cytometry (n = 7–22/group). Normalized mean fluorescence intensity of P2Y12, CSF1R, CD11b, and CX3CR1 in frontal cortex microglia. Normalized mean side scatter profile is shown. Bars represent mean ± S.E.M. *p < 0.05, pairwise comparison indicated (significant interaction or main effect).
Fig. 4
Fig. 4. Administration of clopidogrel reduces levels of microglial P2Y12 and prevents stress effects on microglial morphology.
A Male Thy1-GFP(M) mice were exposed to 14 days of chronic unpredictable stress (CUS) or were handled as controls. During this time, animals received daily injections of either vehicle or clopidogrel. Approximately 4 h after the final stressor, mice were perfused and brains were collected, sectioned, immunostained, and imaged (n = 6–8/group). B Confocal images of FosB (top panel, green), microglial IBA1 (bottom panel, red) and microglial P2Y12 (bottom panel inset, cyan) in the mPFC. White scale bar represents 100 µm. C Average number of FosB+ cells/mm2 in the mPFC. D Average number of IBA1 + cells/mm2 in the mPFC. E Average IBA1 + area per microglial cell. F Average intensity (A.U.) of P2Y12 staining per microglial cell (relative to vehicle treated control group). Bars represent mean ± S.E.M. *p < 0.05, pairwise comparison indicated (significant interaction). #p < 0.05, significant main effect of drug treatment. Stressp < 0.05, significant main effect of stress.
Fig. 5
Fig. 5. Antagonism of microglial P2Y12 prevents stress-induced phagocytosis of dendritic elements and subsequent dendritic spine loss in the mPFC.
Male Thy1-GFP(M) mice were exposed to 14 days of chronic unpredictable stress (CUS) or were handled as controls. During this time, animals received daily injections of either vehicle or clopidogrel. Approximately 4 h after the final stressor, mice were perfused and brains were collected, sectioned, immunostained, and imaged (n = 6–8/group). A Confocal images of microglia (IBA1, red) and dendritic segments (Thy1-GFP, green) were obtained from lamina I of the mPFC. Crosshairs note either a microglial process in close proximity to dendritic elements or a dendritic element localized within a microglial cell body or process extension. Inset shows a magnified view of dendritic material in the noted location, with inclusion area marked (green dashed line). Alongside merged channels, orthogonal cross-sections matching the noted location are depicted for each group. White scale bar represents 10 µm. B Left: Proportion of microglia with GFP + inclusions in the mPFC. Right: Proportion of phagocytic microglia with GFP + inclusions exclusively in their soma (bottom panel) or processes (middle panel), or within both their soma and processes (top panel). C Number of GFP + inclusions within microglia with dendritic elements. D Average GFP + inclusion volume per phagocytic microglia. E Average volume of CD68 per microglial cell. F Average dendritic spine density. G Left: Linear association between the density of FosB+ cells and the proportion of microglia with dendritic inclusions in the mPFC. Right: Linear association between dendritic spine density and the proportion of microglia with dendritic inclusions in the mPFC. Solid line represents linear fit in vehicle-treated animals (left), dashed line represents this in clopidogrel-treated animals (right). Pearson correlation coefficients (r) are shown for each dataset. Bars represent mean ± S.E.M. *p < 0.05, pairwise comparison indicated (significant interaction). #p < 0.05, significant main effect of drug treatment. Stressp < 0.05, significant main effect of stress.

References

    1. Thompson SM, Kallarackal AJ, Kvarta MD, Van Dyke AM, LeGates TA, Cai X. An excitatory synapse hypothesis of depression. Trends Neurosci. 2015;38:279–94. - PMC - PubMed
    1. Duman RS, Aghajanian GK, Sanacora G, Krystal JH. Synaptic plasticity and depression: New insights from stress and rapid-acting antidepressants. Nat Med. 2016;22:238–49. - PMC - PubMed
    1. Holmes SE, Scheinost D, Finnema SJ, Naganawa M, Davis MT, DellaGioia N, et al. Lower synaptic density is associated with depression severity and network alterations. Nature Commun. 2019;10:1529. - PMC - PubMed
    1. Liu T, Lu J, Lukasiewicz K, Pan B, Zuo Y. Stress induces microglia-associated synaptic circuit alterations in the dorsomedial prefrontal cortex. Neurobiol Stress. 2021:100342. - PMC - PubMed
    1. Wohleb ES, Terwilliger R, Duman CH, Duman RS. Stress-induced neuronal CSF1 provokes microglia-mediated neuronal remodeling and depressive-like behavior. Biol Psychiatry. 2018;83:38–49. - PMC - PubMed

Publication types