. 2023 Jan;613(7942):96-102.
doi: 10.1038/s41586-022-05515-1. Epub 2022 Dec 14.

Recurrent repeat expansions in human cancer genomes

Affiliations

Recurrent repeat expansions in human cancer genomes

Graham S Erwin et al. Nature. 2023 Jan.

Abstract

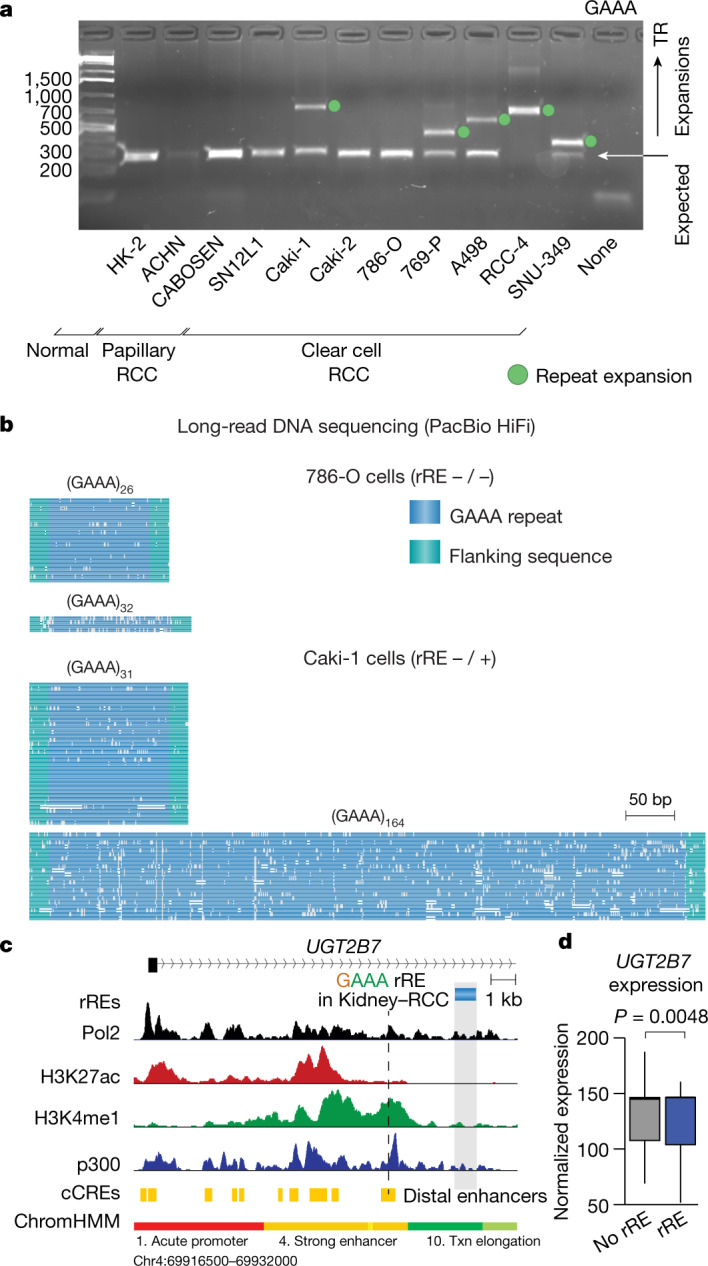
Expansion of a single repetitive DNA sequence, termed a tandem repeat (TR), is known to cause more than 50 diseases1,2. However, repeat expansions are often not explored beyond neurological and neurodegenerative disorders. In some cancers, mutations accumulate in short tracts of TRs, a phenomenon termed microsatellite instability; however, larger repeat expansions have not been systematically analysed in cancer3-8. Here we identified TR expansions in 2,622 cancer genomes spanning 29 cancer types. In seven cancer types, we found 160 recurrent repeat expansions (rREs), most of which (155/160) were subtype specific. We found that rREs were non-uniformly distributed in the genome with enrichment near candidate cis-regulatory elements, suggesting a potential role in gene regulation. One rRE, a GAAA-repeat expansion, located near a regulatory element in the first intron of UGT2B7 was detected in 34% of renal cell carcinoma samples and was validated by long-read DNA sequencing. Moreover, in preliminary experiments, treating cells that harbour this rRE with a GAAA-targeting molecule led to a dose-dependent decrease in cell proliferation. Overall, our results suggest that rREs may be an important but unexplored source of genetic variation in human cancer, and we provide a comprehensive catalogue for further study.


Conflict of interest statement

G.S.E. and M.P.S. are inventors on a patent application describing anti-proliferative agents. E.D. and M.A.E. are shareholders and are currently or were formerly employed by Illumina and Pacific Biosciences. The other authors declare no competing interests.

Figures

Fig. 1
Fig. 1. Genome-wide detection of rREs in cancer genomes.
a, Scheme of the method to identify rREs in 2,509 patients across 29 human cancer types: 1, head and neck squamous cell carcinoma (Head−SCC); 2, skin–melanoma; 3, glioblastoma (CNS–GBM); 4, medulloblastoma (CNS−Medullo); 5, pilocytic astrocytoma (CNS–PiloAstro); 6, oesophageal adenocarcinoma (Oeso−AdenoCA); 7, osteosarcoma (Bone−Osteosarc); 8, leiomyosarcoma (Bone−Leiomyo); 9, thyroid adenocarcinoma (Thy–AdenoCA); 10, lung adenocarcinoma (Lung−AdenoCA); 11, lung squamous cell carcinoma (Lung−SCC); 12, mammary gland adenocarcinoma (Breast−AdenoCA); 13, B cell non-Hodgkin lymphoma (Lymph−BNHL); 14, chronic lymphocytic leukaemia (Lymph−CLL); 15, acute myeloid leukaemia (Myeloid−AML); 16, myeloproliferative neoplasm (Myeloid−MPN); 17, biliary adenocarcinoma (Biliary–AdenoCA); 18, hepatocellular carcinoma (Liver−HCC); 19, stomach adenocarcinoma (Stomach−AdenoCA); 20, pancreatic adenocarcinoma (Panc−AdenoCA); 21, pancreatic neuroendocrine tumour (Panc−Endocrine); 22, colorectal adenocarcinoma (ColoRect–AdenoCA); 23, prostatic adenocarcinoma (Prost−AdenoCA); 24, chromophobe renal cell carcinoma (Kidney–ChRCC); 25, renal cell carcinoma (Kidney–RCC); 26, papillary renal cell carcinoma (Kidney−pRCC); 27, uterine adenocarcinoma (Uterus−AdenoCA); 28, ovarian adenocarcinoma (Ovary−AdenoCA); 29, transitional cell carcinoma of the bladder (Bladder−TCC). b, Distribution of rREs across cancer types. c, Proportion of cancer genomes with rREs. d, STR mutation rate for cancer genomes with and without an rRE. Two-tailed Mann–Whitney test (n = 2,465 cancer genomes); NS, not significant. Boxes extend from the 25th percentile to the 75th percentile, the centre line represents the median and whiskers represent minima and maxima. e, Distribution of rREs across MSS and MSI-high cancers. Chi-squared (two-tailed) test with Yates’ correction (n = 2,482 cancer genomes).
Fig. 2
Fig. 2. Features of rREs.
a, Distribution of the repeat unit (motif) for rREs. b, Motifs enriched in the catalogue of rREs. c, Distance of rREs to the end of the chromosome arm. d, Proportion of genic features that overlap with rREs. e, Distance of simple repeats (n = 950,091 loci) and rREs (n = 160 loci) to the nearest Encyclopedia of DNA Elements (ENCODE) cCRE. Centre values represent the median. Welch’s t test (two tailed).
Fig. 3
Fig. 3. Association of rREs with cancer.
a, Association of rREs with human diseases. Chr., chromosome. b, Estimated frequency of rREs in genes of interest, including nine COSMIC genes. c, Distance of simple repeats (n =  950,091 loci), non-prostate cancer rREs (n = 55 loci) and prostate cancer rREs (n = 105 loci) to the nearest prostate cancer risk locus. Centre values represent the median. Statistical significance was measured with Welch’s t test (two tailed; *, q = 0.08). See Methods section ‘Statistics and reproducibility’ for more information.  d, Association between SNVs in genes in the COSMIC tier 1 genes and the presence of rREs. Two-tailed Student’s t test with FDR correction by the Benjamini–Hochberg method.
Fig. 4
Fig. 4. An rRE in RCC.
a, Gel electrophoresis of the GAAA TR in RCC samples. This analysis was performed in duplicate, and the gel is representative of the results. The units for the ladder are base pairs. For gel source data, see Supplementary Fig. 1. b, Visualization of long-read sequencing of the GAAA rRE in the intron of UGT2B7. Data are from PacBio HiFi sequencing. c, The locus surrounding the rRE detected in the intron of UGT2B7. Signal traces of RNA polymerase II (Pol2), acetylated histone H3 lysine 27 (H3K27ac), monomethylated histone H3 lysine 4 (H3K4me1) and p300 in HepG2 cells are shown. cCREs and chromatin states (ChromHMM) are also depicted. Txn, transcription. d, Expression of UGT2B7 isoform ENST00000508661.1 in RCC samples as a function of detection of the rRE in UGT2B7 (normalized expression, counts). Centre values represent the median. Significance was measured by two-tailed Wald test with FDR correction (Benjamini–Hochberg) (n = 49 cancer genomes with matching WGS and RNA-seq data).
Fig. 5
Fig. 5. Design and characterization of GAAA-targeting molecules in RCC.
a, Chemical structures of Syn-TEF3, PA3, Syn-TEF4 and PA4. Syn-TEF3 and PA3 target 5′-AAGAAAGAA-3′. Syn-TEF4 and PA4 target 5′-AAGGAAGG-3′. The structures of N-methylpyrrole (open circles), N-methylimidazole (filled circles) and β-alanine (diamonds) are shown. N-methylimidazole is bolded for clarity. The structure of JQ1 linked to polyethylene glycol (PEG6) is represented as a blue circle. The structure of isophthalic acid and its linker is represented as IPA. Complete chemical structures appear in Supplementary Fig. 2. Mismatches formed with Syn-TEF4 and PA4 are indicated with orange lines. b, Relative cell density of RCC cell lines Caki-1 and 786-O following treatment (72 h) with compounds as indicated. Relative cell density was measured by CCK-8 assay (Methods). Results are shown as the mean ± s.e.m. (n = 4 biological replicates). c, Quantification of the percentage of propidium iodide-positive cells. P values are from one-way ANOVA with Bonferroni’s correction for multiple comparisons. Results are shown as the mean ± s.e.m. (n = 3 biological replicates except n = 2 biological replicates for Syn-TEF3 in 786-O cells). d, Live-cell microscopy of Caki-1 and 786-O cells stained with propidium iodide (red) and Hoechst 33342 (blue). Scale bars, 100 μm. See also Extended Data Fig. 10.
Extended Data Fig. 1
Extended Data Fig. 1. Overview of PCAWG data and analysis with ExpansionHunter De Novo.
a, Distribution of cancer genomes analysed across 29 human cancers in the PCAWG data. b, Distribution of p-values following candidate recurrent repeat expansion (rRE) analysis with ExpansionHunter Denovo (one-sided Wilcoxon rank-sum test).
Extended Data Fig. 2
Extended Data Fig. 2. Benchmarking EHdn.
a, Comparison of anchored in-repeat reads (IRRs) to long-read sequencing reads. Long-read sequencing confirmation rate across all tandem repeats (TRs, motifs 2–20 bp), short TRs with motifs from 2–6 bp, and variable number TRs with motifs from 7–20 bp. b, Confirmation rate versus number of anchored IRRs. c, Effect of downsampling on the identification of the rRE in the intron of UGT2B7 in kidney cancer. Tumour genomes from the PCAWG dataset were downsampled to the specified number. ExpansionHunter De Novo was run, and the resulting Bonferroni-correct p-value is depicted for the given sequencing coverage. Corrected p-value from one-sided Wilcoxon rank-sum test with Bonferroni correction. d, Estimation of the frequency of repeat expansions in rRE loci in the general population. The number of rREs (count) corresponding to each bin is plotted on the y-axis. Results are from analysis of 1000 Genomes Project samples (n = 2,504) (GRCh38) and Medical Genome Reference Bank samples (n = 4,010).
Extended Data Fig. 3
Extended Data Fig. 3. Local read depth normalization of recurrent repeat expansion (rRE) candidates.
a, Examples of read depth before and after local normalization. b, Examples of anchored in-repeat read (IRRs) before and after local normalization. The read depth for the locus on the left is derived from TCGA data, and the read depth for the locus on the right is derived from PCAWG data. Q-values were calculated from two-tailed Student’s t-test with FDR correction by Benjamini-Hochberg. FDR q-value=4.83e-05 and 0.54 for Kidney-RCC and Breast-AdenoCA, respectively (n = 74 Kidney-RCC genomes and n = 193 Breast-AdenoCA genomes analyzed). c, Workflow to identify rREs. d, Detection rate in an independent cohort of samples.
Extended Data Fig. 4
Extended Data Fig. 4. Benchmarking LRDN and EHdn.
a,b, Benchmarking the local read depth normalization filter (n = 10 loci analysed). c, The anchored IRR quotient was calculated as (tumour anchored IRR – normal anchored IRR)/(normal anchored IRR + 1). Dashed line at 2.5 indicates the threshold for calling a locus as a repeat expansion in a cancer genome. d, ExpansionHunter was used to estimate repeat sizes from short-read sequencing data, and the results were visualized with REViewer (see Methods). The allele with the longest repeat tract for normal and tumour samples is shown. The TR is depicted in red, and the flanking regions are depicted in blue.
Extended Data Fig. 5
Extended Data Fig. 5. Association of rREs with genetic features.
a, Correlation of rREs with MSI-High cancers. bc, Association of rREs with mutational signatures. b, Correlation between DBS2 and the number of rREs detected. c, Correlation between DBS2 and the number of rREs detected when Lung-SCC data are omitted from the analysis.
Extended Data Fig. 6
Extended Data Fig. 6. Distribution of rREs across the genome.
a, Distance of rREs to the nearest centromere or telomere. b, Distribution of rREs across early- and late-replicating regions of the genome. Welch’s t-test (two-tailed, not significant). c, Circos plot depicting (from outside to inside) p-value of rREs, location of rREs where darker shading indicates the rRE observed across 3 cancers, early and late replicating regions (yellow and purple, respectively), and simple sequence repeats. This plot depicts the overlay between different data types and the distribution of rREs across the genome.
Extended Data Fig. 7
Extended Data Fig. 7. Molecular features of rREs.
a, Overlap of rREs with other datasets. The fraction of rREs overlapping with other catalogues of TRs and genomic instability. From left to right in the figure, recurrently altered STRs in cancer (Supplementary Data 14 from ref. ; PMID: 28585546), extrachromosomal circular DNA (ecDNA, circular amplification events from Supplementary Table 1; ref. ; PMID: 31748743), unstable STRs in cancer (Supplementary Table 10 from ref. ; PMID: 27694933), eSTRs (Supplementary Data 1; ref. ; PMID: 31676866), and microDNA (From C4-2, ES2, LNCaP, OVCAR8, and PC-3 cells; ref. ; PMID: 26051933). The PubMed ID for each corresponding manuscript is included in the figure. For the overlap of rREs with microDNA, we looked at loci that we attempted to detect in an independent cohort of cancer samples, and we found that we tested 11 loci. Of the 11 rREs tested, 8 (72%) were detected in the independent cohort of cancer samples. b, Distribution of rRE motif length across cancer types. b,c, Association of rREs with regulatory elements. b, Distance of simple sequence repeats and rREs to the nearest candidate cis-regulatory elements (cCREs). Key: promoter-like signature (P), proximal enhancer-like signature (p), distal enhancer-like signature (d), DNase-H3K4me3 (D), and CTCF-only (C). c, Signal tracks depicting rREs near regulatory elements (n = 950,091 simple repeats and n = 160 rREs). d, Association between rREs in prostate cancer and risk loci in prostate cancer. Signal trace showing an rRE detected in prostate cancer and a risk locus for prostate cancer.
Extended Data Fig. 8
Extended Data Fig. 8. Analysis of cytotoxic activity.
a, Analysis of UGT2B7 GAAA rRE in patients with clear cell RCC. N, normal tissue; T, tumour tissue. For gel source data, see Fig. S1. b, UGT2B7 in RCC patients. b, Expression of UGT2B7 (transcripts per million, TPM) in RCC samples as a function of the detection of the rRE in UGT2B7. P value computed with Welch’s t-test (two-tailed. c, Kaplan-Meier survival plots of RCC patients stratified by rRE in the intron of UGT2B7. P value computed with Welch’s t-test (two-tailed).
Extended Data Fig. 9
Extended Data Fig. 9. Association of rREs with cytotoxic activity.
P values computed with Welch’s t-test (two-tailed) with FDR correction (Benjamini-Hochberg) (n = 49 Kidney-RCC genomes and n = 85 Ovary-AdenoCA genomes analysed).
Extended Data Fig. 10
Extended Data Fig. 10. Syn-TEF treatment of RCC cell lines.
a, Quantitation of the percentage of propidium iodide-positive cells. P values are from a one-way ANOVA adjusted with Bonferroni correction for multiple comparisons. Results are mean ± s.e.m. (n = 3 biological replicates, except n = 2 biological replicates for Syn-TEF3 in 786-O). b, Live cell microscopy of Caki-1 and 786-O cells stained with propidium iodide (red) and Hoechst 33342 (blue). Scale bars, 100 μm. c, Relative cell density of RCC cell lines following treatment (72 h) with compounds (50 μM Syn-TEF or 0.1% DMSO vehicle, as indicated). Results are mean ± s.e.m. (ACHN and RCC-4 are n = 4 biological replicates, A498 and Caki-2 are n = 3 biological replicates).

References

    1. Hannan AJ. Tandem repeats mediating genetic plasticity in health and disease. Nat. Rev. Genet. 2018;19:286–298. doi: 10.1038/nrg.2017.115. - DOI - PubMed
    1. Gall-Duncan T, Sato N, Yuen RKC, Pearson CE. Advancing genomic technologies and clinical awareness accelerates discovery of disease-associated tandem repeat sequences. Genome Res. 2022;32:1–27. doi: 10.1101/gr.269530.120. - DOI - PMC - PubMed
    1. Hause RJ, Pritchard CC, Shendure J, Salipante SJ. Classification and characterization of microsatellite instability across 18 cancer types. Nat. Med. 2016;22:1342–1350. doi: 10.1038/nm.4191. - DOI - PubMed
    1. Cortes-Ciriano I, Lee S, Park WY, Kim TM, Park PJ. A molecular portrait of microsatellite instability across multiple cancers. Nat. Commun. 2017;8:15180. doi: 10.1038/ncomms15180. - DOI - PMC - PubMed
    1. Grünewald TGP, et al. Chimeric EWSR1-FLI1 regulates the Ewing sarcoma susceptibility gene EGR2 via a GGAA microsatellite. Nat. Genet. 2015;47:1073–1078. doi: 10.1038/ng.3363. - DOI - PMC - PubMed

Publication types

Substances