. 2022 Dec;612(7941):778-786.
doi: 10.1038/s41586-022-05496-1. Epub 2022 Dec 14.

Ovarian cancer mutational processes drive site-specific immune evasion

Affiliations

Ovarian cancer mutational processes drive site-specific immune evasion

Ignacio Vázquez-García et al. Nature. 2022 Dec.

Abstract

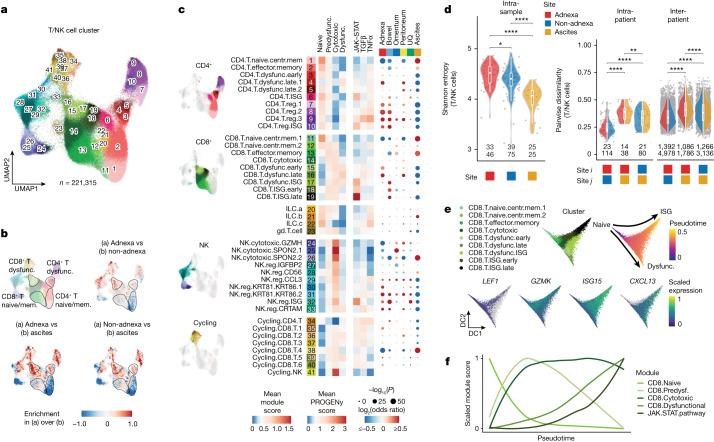
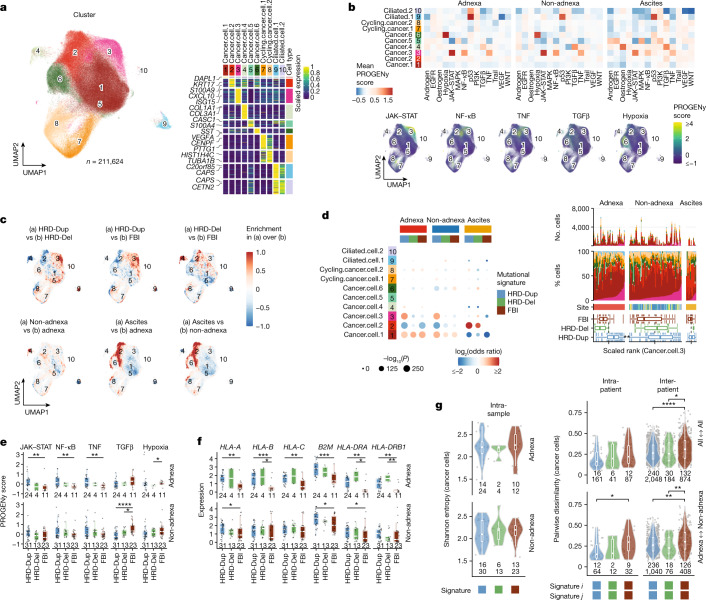
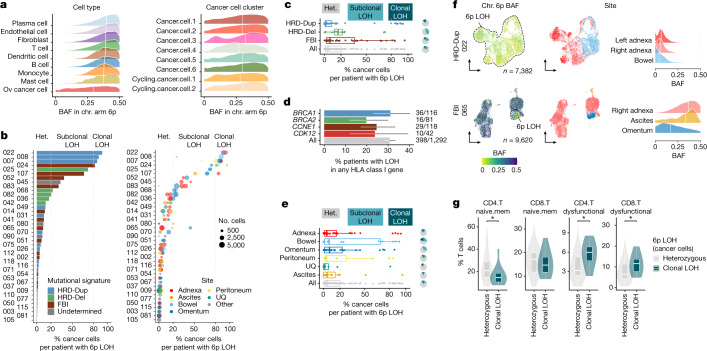
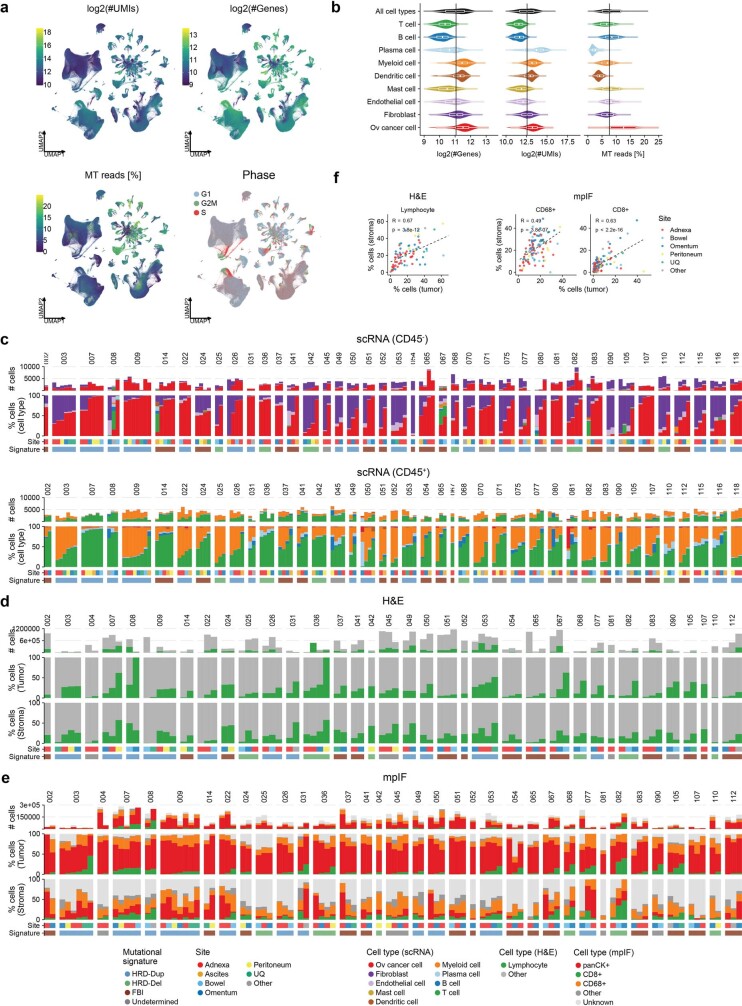
High-grade serous ovarian cancer (HGSOC) is an archetypal cancer of genomic instability1-4 patterned by distinct mutational processes5,6, tumour heterogeneity7-9 and intraperitoneal spread7,8,10. Immunotherapies have had limited efficacy in HGSOC11-13, highlighting an unmet need to assess how mutational processes and the anatomical sites of tumour foci determine the immunological states of the tumour microenvironment. Here we carried out an integrative analysis of whole-genome sequencing, single-cell RNA sequencing, digital histopathology and multiplexed immunofluorescence of 160 tumour sites from 42 treatment-naive patients with HGSOC. Homologous recombination-deficient HRD-Dup (BRCA1 mutant-like) and HRD-Del (BRCA2 mutant-like) tumours harboured inflammatory signalling and ongoing immunoediting, reflected in loss of HLA diversity and tumour infiltration with highly differentiated dysfunctional CD8+ T cells. By contrast, foldback-inversion-bearing tumours exhibited elevated immunosuppressive TGFβ signalling and immune exclusion, with predominantly naive/stem-like and memory T cells. Phenotypic state associations were specific to anatomical sites, highlighting compositional, topological and functional differences between adnexal tumours and distal peritoneal foci. Our findings implicate anatomical sites and mutational processes as determinants of evolutionary phenotypic divergence and immune resistance mechanisms in HGSOC. Our study provides a multi-omic cellular phenotype data substrate from which to develop and interpret future personalized immunotherapeutic approaches and early detection research.


Conflict of interest statement

S.P.S. is a shareholder of Imagia Canexia Health and a consultant to AstraZeneca, outside the scope of this study. D.Z. reports research funding to MSK from AstraZeneca, Genentech, Synthekine and Plexxikon; personal fees from Synlogic Therapeutics, Hookipa Biotech, Agenus, Synthekine, Memgen, Mana Therapeutics, Tessa Therapeutics and Xencor; and stock options from Accurius, Calidi Biotherapeutics and Immunos. D.Z. is an inventor on a patent concerning the use of Newcastle disease virus as a cancer therapeutic, licensed to Merck. C.F.F. reports research funding to the institution from Merck, AstraZeneca, Genentech/Roche, Bristol Myers Squibb and Daiichi and uncompensated membership of a scientific advisory board for Merck and Genentech and is a consultant for OncLive, Aptitude Health, Bristol Myers Squibb and Seagen, all outside the scope of this manuscript. B.W. reports ad hoc membership of the scientific advisory board of Repare Therapeutics, outside the scope of the submitted work. C.A. reports grants from Clovis, Genentech, AbbVie and AstraZeneca and personal fees from Tesaro, Eisai/Merck, Mersana Therapeutics, Roche/Genentech, Abbvie, AstraZeneca/Merck and Repare Therapeutics, outside the scope of the submitted work. N.R.A.-R. reports grants to MSK from Stryker/Novadaq and GRAIL, outside the scope of the submitted work. D.S.C. is on the medical advisory board of Apyx Medical Co, Verthermia Acquio and Biom'up and is a stockholder of Intuitive Surgical and TransEnterix. R.N.G. reports funding from GSK, Novartis, Mateon Therapeutics, Corcept, Regeneron, Clovis, Context Therapeutics, EMD Serono, MCM Education, OncLive, Aptitude Health and Prime Oncology, outside the scope of this work. Y.L.L. reports research funding from AstraZeneca, GSK/Tesaro and Tesaro Therapeutics outside the scope of this work. Y.L. consults for Calyx Clinical Trials Solutions and holds shares of Y-mAbs Therapeutics. T.J.H. receives research funding from Bristol Myers Squibb, Calico Labs and the Parker Institute for Cancer Immunotherapy. S.F.B. owns equity in, receives compensation from, and serves as a consultant and on the scientific advisory board and board of directors of Volastra Therapeutics. The other authors declare no competing interests.

Figures

Fig. 1
Fig. 1. TME of HGSOC at single-cell resolution.
a, Overview of the MSK SPECTRUM cohort and specimen collection workflow. b, UMAP plot of cells profiled by scRNA-seq coloured by patient. Cell types are highlighted with grey outlines. c, Patient specificity for each cell type (Methods). Ov, ovarian. d, Number of cells identified per cell type next to a UMAP plot with cells coloured by cell type. e, Number of cells profiled per tumour site next to a UMAP plot with cells coloured by tumour site. UQ, upper quadrant. f, Site-specific enrichment of cell type composition in scRNA-seq, H&E and mpIF data fitted using a GLM. GLMs for H&E and mpIF data were separated by tumour (T) and stroma (S) regions. The colour gradient indicates the log2-transformed odds ratio (red, enrichment; blue, depletion), and sizes indicate the Bonferroni-corrected –log10(P value). g, Cell type composition based on scRNA-seq data for CD45 and CD45+ samples. Upper panels, absolute and relative cell type numbers; lower panels, box plot distributions of sample ranks with respect to tumour site. h, Cell type composition based on H&E with lymphocyte ranks in tumour and stroma. Panels are analogous to those in g. i, Cell type composition based on mpIF with CD8+ T cell ranks in tumour and stroma. Panels are analogous to those in g. For c and gi, violin plots and box plots are shown as the median, top and bottom quartiles; whiskers correspond to 1.5× interquartile range (IQR). *P < 0.05, **P < 0.01.
Fig. 2
Fig. 2. Site specificity of immunophenotypes.
a, UMAP plot of T and NK cell clusters profiled by scRNA-seq. Clusters are coloured and numbered to reference cluster labels in c. b, Pairwise comparisons of kernel density estimates in UMAP space. c, Left, heatmap of average T cell state module scores (left) and signalling pathway activity scores (right) across CD4+ T, CD8+ T, innate lymphoid cell (ILC), NK and cycling cell clusters. Right, dot plot showing site-specific enrichment of T and NK cell clusters based on GLM. The colour gradient indicates the log2-transformed odds ratio (red, enrichment; blue, depletion), and sizes indicate the Bonferroni-corrected –log10(P value). d, Intra-sample diversity of T and NK cell clusters estimated by Shannon entropy with samples grouped by site (patient and sample counts shown) and intra- and inter-patient dissimilarity of T and NK cell cluster composition for pairs of samples, estimated using the Bray–Curtis distance (patient and sample pair counts shown). Pairwise dissimilarity is shown for all heterotypic pairs of sites (adnexa versus non-adnexa, adnexa versus ascites, non-adnexa versus ascites). Violin plots show the median, top and bottom quartiles; whiskers correspond to 1.5× IQR. *P < 0.05, **P < 0.01, ***P < 0.001, ****P < 0.0001. e, Top, diffusion maps of the subset of CD8+ T cells profiled by scRNA-seq, with cells coloured by CD8+ T cell cluster and pseudotime. Bottom, relative expression of genes marking CD8+ T cell clusters in diffusion space. DC, diffusion component. f, Scaled module scores with respect to pseudotime.
Fig. 3
Fig. 3. Malignant cell phenotypes and association with mutational signatures.
a, Left, UMAP plot of epithelial cells coloured by cluster. Clusters are numbered to reference cluster labels in the heatmap. Right, heatmap of scaled marker gene expression averaged per cluster, showing differentially expressed genes in rows and clusters in columns. The top two genes for each cluster are highlighted. b, Top, heatmap of average signalling pathway activity scores per site. Bottom, UMAP plots with cells coloured by signalling activity scores for pathways of interest. EGFR, epidermal growth factor receptor; MAPK, mitogen-activated protein kinase; PI3K, phosphoinositide 3-kinase; VEGF, vascular endothelial growth factor. c, Relative kernel densities showing enrichment (red) and depletion (blue) in UMAP space for pairwise comparisons of mutational signatures and sites. d, Left, estimated effects of anatomical site and mutational signature on epithelial cluster composition based on GLM. The colour gradient indicates the log2-transformed odds ratio (red, enrichment; blue, depletion), and sizes indicate the Bonferroni-corrected –log10(P value). Right, epithelial cluster compositions ranked by Cancer.cell.3 fraction. Box plot panels show distributions of scaled sample ranks by mutational signature. e,f, Distributions of signalling pathway activity scores (e) and HLA gene expression (f) in adnexal and non-adnexal samples as a function of mutational signature (patient counts shown). g, Left, intra-sample diversity of malignant cell clusters in adnexal and non-adnexal samples, with samples grouped by mutational signature and site (patient and sample counts shown). Right, intra- and inter-patient dissimilarity of malignant cluster composition for pairs of samples. Pairwise dissimilarity is shown for all pairs of sites (patient and sample pair counts shown) excluding ascites (top) and for adnexal versus non-adnexal pairs of sites (bottom). In dg, box plots and violin plots show the median, top and bottom quartiles; whiskers correspond to 1.5× IQR. Colours in eg are analogous to those in d. *P < 0.05, **P < 0.01, ***P < 0.001, ****P < 0.0001; brackets indicate two-sided Wilcoxon pairwise comparisons in eg.
Fig. 4
Fig. 4. Mutational signatures as determinants of immunophenotypes.
a, Differences in kernel density estimates in UMAP space for pairwise comparisons of mutational signatures. b, Estimated effects of mutational signature and anatomical site on T and NK cell cluster composition based on a GLM, with models fitted excluding ascites samples. The colour gradient indicates the log2-transformed odds ratio (red, enrichment; blue, depletion), and sizes indicate the Bonferroni-corrected –log10(P value). c, Distributions of CD8+ T cell state module scores and JAK–STAT signalling pathway activity scores with respect to mutational signature (patient counts shown). d, Scaled module scores within the subset of CD8+ T cells with respect to pseudotime and mutational signature. e, Correlation of JAK–STAT signalling scores in CD8+ T cells in CD45+ samples with those in cancer cells in matched CD45 samples. f, Left, intra-sample diversity of T and NK cell clusters in adnexal and non-adnexal samples estimated by Shannon entropy, with samples grouped by mutational signature (patient and sample counts shown). Right, intra- and inter-patient dissimilarity in T and NK cell cluster composition, with samples grouped by mutational signature, estimated using the Bray–Curtis distance. Pairwise dissimilarity is shown for all pairs of sites (patient and sample pair counts shown) excluding ascites (top) and for adnexal versus non-adnexal pairs of sites (bottom). g, Spatial density of CD8+ T cell phenotypes in adnexal and non-adnexal mpIF samples as a function of distance to the tumour–stroma interface, with samples grouped by mutational signature (Methods). In c and f, box plots and violin plots show the median, top and bottom quartiles; whiskers correspond to 1.5× IQR. Colours in f and g are analogous to those in ce. *P < 0.05, **P < 0.01, ***P < 0.001, ****P < 0.0001; brackets indicate two-sided Wilcoxon pairwise comparisons in c and f.
Fig. 5
Fig. 5. HLA loss as a mechanism of immune escape.
a, Left, distribution over cells of chromosome arm 6p BAF in scRNA-seq data with ranking by median 6p BAF per cell type. Right, allelic imbalance in 6p BAF across cancer cell clusters. White vertical lines indicate the median. Chr., chromosome. b, Left, percentage of cancer cells with 6p LOH per patient. Right, site- and clone-specific percentage of cancer cells with 6p LOH. Het., heterozygous. c, Percentage of cancer cells with 6p LOH per sample as a function of mutational signature. Pie charts show the fraction of samples with heterozygous, subclonal LOH and clonal LOH 6p status. d, Percentage of patients with LOH of any HLA class I gene in the MSK-IMPACT HGSOC cohort (n = 1,298 patients) for BRCA1-, BRCA2- and CDK12-mutant and CCNE1-amplified tumours, mapping to HRD-Dup, HRD-Del, TD and FBI signatures, respectively. Error bars, 95% binomial confidence intervals. e, Percentage of cancer cells with 6p LOH per sample as a function of anatomical site. Pie charts show the fraction of samples by 6p status. f, UMAP plots of cancer cells from representative HRD-Dup and FBI cases. Density plots show site-specific 6p BAF. g, Fraction of naive and dysfunctional T cells in CD45+ samples as a function of the 6p LOH clonality of cancer cells in matched CD45 samples. *P < 0.05; brackets indicate two-sided Wilcoxon pairwise comparisons. In bce and g, 6p LOH status is defined as follows: heterozygous, percentage 6p LOH ≤ 20%; subclonal LOH, 20% < percentage 6p LOH ≤ 80%; clonal LOH, percentage 6p LOH > 80%. In c, e and g, box plots and violin plots show the median, top and bottom quartiles; whiskers correspond to 1.5× IQR. In ae, only BAF estimates from cells with ≥10 reads aligning to 6p were considered and allelic imbalance states were assigned on the basis of the mean 6p BAF per cell as follows: balanced, BAF ≥ 0.35; imbalanced, 0.15 ≤ BAF < 0.35; LOH, BAF < 0.15 (Methods).
Fig. 6
Fig. 6. Spatial topologies of in situ cellular interactions.
a, Representative mpIF fields of view (FOVs) highlighting common features of the TME and showing one adnexal sample per mutational signature. First column, raw pseudocolour images; second column, cellular phenotypes of segmented cells; third and fourth columns, proximity of phenotype pairs, highlighting PD-L1–PD-1 interactions with colour-coded phenotypes and edges depicting nearest-neighbour distances. Only edges joining pairs of cells within 250 μm of each other are shown. b, Nearest-neighbour distance from CD8+ T cell phenotypes to panCK+PD-L1+ cancer cells aggregated across FOVs, with samples grouped by anatomical site and mutational signature. Vertical lines indicate the median nearest-neighbour distance.
Extended Data Fig. 1
Extended Data Fig. 1. Multi-site, multi-modal profiling of malignant cells and the TME.
a, Schematic of the MSK SPECTRUM specimen collection workflow including surgery, single-cell suspensions for scRNA-seq and biobanking of snap-frozen and FFPE samples. b, Cohort overview. Top panel, Oncoprint of selected somatic and germline mutations per patient and cohort-wide prevalence. Single nucleotide variants (SNVs), indels and fusions shown are detected by targeted panel sequencing (MSK-IMPACT). Focal amplifications and deletions are detected by whole-genome sequencing (WGS). Patient data include mutational signature subtype, patient age, staging following FIGO Ovarian Cancer Staging guidelines, and type of surgical procedure. Bottom panel, Sample and data inventory indicating number of co-registered multi-site datasets: single-cell RNA sequencing, H&E whole-slide images, multiplexed immunofluorescence, WGS and MSK-IMPACT.
Extended Data Fig. 2
Extended Data Fig. 2. Inference of SNV and SV mutational signatures by WGS.
a, Landscape of copy number gains and losses in the MSK SPECTRUM cohort (n = 40) and the HGSOC samples in the metacohort (n = 170). The fraction of tumour samples with gains or losses is shown on the y-axis, calculated in 500-kb genomic bins shown on the x-axis. b, First panel, Oncoprint of selected somatic and germline mutations per patient and cohort-wide prevalence by MSK-IMPACT. Patients are grouped by mutational signature. Second panel, heatmap of standardized probabilities for genomic features used to infer mutational signature subtypes from WGS using MMCTM. Features used for inference (in rows) are grouped into single nucleotide variant (SNV) and structural variation (SV) features. SV features include duplications (S-Dup, M-Dup, L-Dup), deletions (S-Del, L-Del), unclustered and clustered foldback inversions (FBI/Inv, Clust-FBI), clustered rearrangements (Clust-SV) and translocations (Tr). Third panel, standardized probabilities for SNV, indel and SV features used by HRDetect. Fourth panel, standardized probabilities for BRCA1- and BRCA2-like signatures used by CHORD. c, UMAP representation of SNV and SV features in the MSK SPECTRUM cohort (n = 40) and the HGSOC/TNBC metacohort (n = 309), coloured by signature strata. Patient identifiers of SPECTRUM cases are highlighted. d, Ranked SNV and SV feature importance in the classification of signature strata. Violin plots show permutation-based importance estimates over randomly shuffled signature strata. e, Paired violin plot of SNV and SV signature probabilities estimated by MMCTM, showing a comparison between the MSK SPECTRUM cohort and the HGSOC/TNBC metacohort. f, Chromosome 19 copy number shown using the log2 ratio (y-axis) for individual genomic bins (x-axis), coloured by the copy number state. A chromosome ideogram highlights the region of interest in chromosome 19. The CCNE1 locus is marked with a dashed line. Patients are annotated to show whether CCNE1 amplification was predicted by WGS. Only patients with a focal CCNE1 amplification called by WGS were included. g, Violin plot of single-cell expression of oncogenes in scRNA-seq, stratified by oncogene copy number in site-matched WGS. h, Correlation between log2 CN change in oncogenes profiled by WGS and mean expression in cancer cells based on matched scRNA-seq from CD45 samples. Spearman’s rank correlation coefficient for the linear fit is shown. Patients are coloured by mutational signature, and those highlighted have high-level amplifications detected by WGS. In d, e and g, box plots show the median, top and bottom quartiles; whiskers correspond to 1.5× IQR.
Extended Data Fig. 3
Extended Data Fig. 3. Quality control of scRNA-seq data and cell type abundance profiled by scRNA-seq, H&E and mpIF.
a, UMAPs of cells profiled by scRNA-seq coloured by different QC metrics: log2 transformed number of UMIs and genes, fraction of mitochondrial reads, cell cycle phase. b, Distributions of QC metrics per cell type. Box plots show the median, top and bottom quartiles; whiskers correspond to 1.5× IQR. c, Absolute and relative cell type compositions of CD45 (top) and CD45+ (bottom) sorted samples based on scRNA-seq, separated by patient, ranked by fraction of ovarian cancer cells and T cells respectively. d, Absolute and relative cell type compositions based on H&E, ranked by lymphocyte fractions for tumour-rich (top) and stroma-rich (bottom) compartments. Panel analogous to c. e, Absolute and relative cell type compositions based on mpIF, ranked by CD8+ T cell fractions in tumour-rich (top) and stroma-rich (bottom) compartments. Panel analogous to c. Colour legends for ce are shown along the bottom of the figure. f, Correlation between the fraction of lymphocytes in tumour and stroma regions of H&E slides (left panel) and the fraction of CD8+ and CD68+ cells in mpIF slides (right panel).
Extended Data Fig. 4
Extended Data Fig. 4. Intra-patient heterogeneity of HGSOC tumour microenvironments.
a, Cell type composition based on scRNA-seq for CD45 samples (left) and CD45+ samples (right). Dot plot of sample ranks grouped by patient. Coloured arrows indicate enrichment (red) or depletion (blue) of ovarian cancer cells (left) and T cells (right) in non-adnexal over adnexal samples. b, Cell type composition based on H&E with lymphocyte ranks in tumour-rich (left) and stroma-rich (right) compartments. Panels analogous to a. c, Cell type composition based on mpIF with CD8+ T cell ranks in tumour-rich (left) and stroma-rich (right) compartments. Panels analogous to a.
Extended Data Fig. 5
Extended Data Fig. 5. Marker gene expression of T, NK and myeloid cell phenotypes.
a, Heatmap of scaled marker gene expression (averaged per cluster) for coarse-grained T and NK cell clusters, showing differentially expressed genes in columns and clusters in rows. Genes are grouped by cluster. Top 5 genes per cluster are highlighted. b, Panel analogous to a, for fine-grained T and NK cell clusters. Top 3 genes per cluster are highlighted. c, Comparison of SPECTRUM T cell clusters (this study) and published T cell clusters using hypergeometric test to assess statistical significance of cluster marker gene overlap. d, Marker gene expression heatmap for myeloid cells (dendritic cells, mast cells and macrophage clusters). Top 5 genes per cluster are highlighted. e, Comparison of SPECTRUM macrophage clusters (this study) and published macrophage clusters using hypergeometric test to assess statistical significance of cluster marker gene overlap.
Extended Data Fig. 6
Extended Data Fig. 6. Anatomic site specificity of myeloid cell phenotypes.
a, Left, UMAP of dendritic cells and mast cells. Clusters are coloured and numbered to reference cluster labels. Right, dot plot panel shows site-specific enrichment of DC and mast cell cluster composition using GLM. Colour gradient indicates log2 odds ratios (enrichment: red, depletion: blue) and sizes indicate the Bonferroni-corrected −log10(P value). c, Pairwise site differences in kernel density estimates in UMAP space for macrophages. d, Intra-sample diversity of myeloid cell clusters estimated by Shannon entropy grouped by site; and intra- and inter-patient dissimilarity of myeloid cell cluster composition between pairs of samples, estimated using the Bray-Curtis distance. Pairwise dissimilarity is shown between all heterotypic pairs of sites (i.e. adnexa/non-adnexa, adnexa/ascites, non-adnexa/ascites). Box plots show the median, top and bottom quartiles; whiskers correspond to 1.5× IQR. Brackets indicate two-sided Wilcoxon pairwise comparisons. *P < 0.05, **P < 0.01, ***P < 0.001, ****P < 0.0001.
Extended Data Fig. 7
Extended Data Fig. 7. Intra-patient and inter-site heterogeneity of T, NK and myeloid cell phenotypes.
a, T/NK cell cluster composition based on scRNA-seq, ranked by fraction of T naive/memory clusters (left) or fraction of T dysfunctional clusters (right). Panels analogous to Fig. 1g–i. b, Site-specific enrichment of coarse-grained T/NK cell clusters using GLM. Colour gradient indicates log2 odds ratios and sizes indicate the Bonferroni-corrected -log10(P value). c, Dimensionality reduction of the dissimilarity in T/NK cluster composition between pairs of samples using NMDS (Methods). Convex hulls highlight differences between samples based on the anatomic site. Size indicates the Shannon entropy in cluster composition per sample. d, Genes of interest in subsets of CD8+ T cells as a function of pseudotime inferred from diffusion components. e, Scaled module scores with respect to pseudotime, grouped by tumour site. f, Myeloid cell cluster composition. Ranked by fraction of cDC2 (left), M1.S1008 cells (middle) and M2.SELENOP cells (right). Panels analogous to Fig. 1g–i. g, Site-specific enrichment of coarse-grained myeloid cell clusters using GLM analogous to b. h, Dimensionality reduction of the dissimilarity in myeloid cluster composition between pairs of samples using NMDS (Methods). Convex hulls highlight differences between samples based on the anatomic site. Size indicates the Shannon entropy in cluster composition per sample.
Extended Data Fig. 8
Extended Data Fig. 8. Mutational signatures impacting cancer cell-intrinsic signaling.
a, Heatmap of scaled marker gene expression (averaged per cluster) for cancer cell clusters, showing differentially expressed genes in columns and clusters in rows. Genes are grouped by cluster. Top 5 genes per cluster are highlighted. b, Relative entropy of cell type subclusters to identify patient-specific clusters. c, Single cell distributions of PROGENy pathway activity per patient. d, Single-cell distributions of PROGENy pathway activity per cancer cell cluster (top subpanel), and as a function of HR status across all clusters (bottom subpanel). e, Heatmap of average HLA gene expression across clusters in adnexal, non-adnexal and ascites samples. f, Single cell distributions of HLA class II and class II gene expression per patient. g, Single cell distributions of HLA gene expression per cancer cell cluster (top subpanel), and as a function of HR status across all clusters (bottom subpanel). h, CD274 (PD-L1) gene expression in UMAP space (left) and as box plot distributions (right) with respect to cluster and mutational signature respectively. i, Dimensionality reduction of the dissimilarity in cancer cell cluster composition between pairs of samples using NMDS. Convex hulls highlight differences between samples based on the anatomic site and mutational signature. Size indicates the Shannon entropy in cluster composition per sample. In c, d and fh, box plots show the median, top and bottom quartiles; whiskers correspond to 1.5× IQR. Paired brackets in d and g show two-sided Wilcoxon pairwise tests. Group comparisons in d, g and h show one-sided Wilcoxon test. *P < 0.05, **P < 0.01, ***P < 0.001, ****P < 0.0001.
Extended Data Fig. 9
Extended Data Fig. 9. Clonal heterogeneity of chromosomal gains and losses in cancer cells.
a, Copy number heatmap shows chromosomal gains and losses in cancer cells. Each column corresponds to an individual cell grouped by patient (x-axis), and chromosomes are arranged vertically (y-axis). Each patient’s dataset is downsampled to 50 cancer cells to facilitate visualization of the whole cohort. b, Examples of copy number heatmaps for all cancer cells from three patients. Rows correspond to individual cells grouped by patient (y-axis), and chromosomes are arranged horizontally (x-axis). c, Median JAK-STAT pathway activity in cancer cells, aggregated by patient (x-axis). From top to bottom (y-axis), median pathway scores are shown for cells grouped by inferCNV clone (top), transcriptional cancer cell cluster (middle) and median across all cancer cells (bottom).
Extended Data Fig. 10
Extended Data Fig. 10. HR deficiency and tumour immunogenicity impact T cell phenotypes.
a, Single cell distributions of T cell module scores per sample. Box plots are grouped by patient and coloured by mutational signature subtype. Samples are annotated based on the anatomic site of origin. b, Site and signature-specific enrichment of coarse-grained CD4+ T, CD8+ T and NK cell clusters using GLM. Colour gradient indicates log2 odds ratios and sizes indicate the Bonferroni-corrected −log10(P value). c, Dimensionality reduction of the dissimilarity in T/NK cluster composition between pairs of samples using NMDS (Methods). Convex hulls highlight differences between samples based on the anatomic site and mutational signature. d, Spatial density of CD8+ T cells in adnexal and non-adnexal samples as a function of distance to the tumour-stroma interface, grouped by mutational signature. Counts within 10 μm distance bands are grouped across FOVs from each mutational signature subtype, and are normalized by the total number of cells. Error bars denote the standard error of the proportion (Methods).
Extended Data Fig. 11
Extended Data Fig. 11. HR deficiency impacts myeloid cell phenotypes.
a, Estimated effects of mutational signature on dendritic and macrophage cell cluster compositions using GLM. b, Left, intra-sample diversity of myeloid cell clusters in adnexal and non-adnexal samples estimated by Shannon entropy, with samples grouped by mutational signature (patient and sample counts shown). Right, intra- and inter-patient dissimilarity in myeloid cell cluster composition, with samples grouped by mutational signature, estimated using the Bray–Curtis distance. Pairwise dissimilarity is shown for all pairs of sites (patient and sample pair counts shown) excluding ascites (top) and for adnexal versus non-adnexal pairs of sites (bottom). c, Fraction of macrophages expressing CD274 (PDL1) and CXCL10 and JAK-STAT pathway activity with respect to mutational signature. d, Spatial density of CD68+PDL1+ macrophages in adnexal and non-adnexal mpIF samples as a function of distance to the tumour-stroma interface, grouped by mutational signature. Counts within 10 μm distance bands are grouped across FOVs from each mutational signature subtype, and are normalized by the total number of CD68+ cells. Error bars denote the standard error of the proportion (Methods). e, Site and signature-specific enrichment of coarse-grained myeloid cell clusters using GLM. Colour gradient indicates log2 odds ratios and sizes indicate the Bonferroni-corrected −log10(P value). f, Dimensionality reduction of the dissimilarity in myeloid cluster composition between pairs of samples using NMDS (Methods). Convex hulls highlight differences between samples based on the anatomic site and mutational signature. g, Spatial density of CD68+ macrophages in adnexal and non-adnexal samples as a function of distance to the tumour-stroma interface, grouped by mutational signature. Counts within 10 μm distance bands are grouped across FOVs from each mutational signature subtype, and are normalized by the total number of cells. Error bars denote the standard error of the proportion (Methods). h, Correlation between the fraction of dendritic cells expressing interferon regulating factors and JAK-STAT signaling scores in cancer cells, T cells and macrophages. In b and c, brackets indicate two-sided Wilcoxon pairwise comparisons. *P < 0.05, **P < 0.01, ***P < 0.001, ****P < 0.0001.
Extended Data Fig. 12
Extended Data Fig. 12. Intratumour heterogeneity of HLA loss of heterozygosity.
a, UMAP of cancer cells profiled by scRNA-seq coloured by BAF of chromosome arm 6p. b, Allelic state of chromosome arm 6p. Allelic imbalance states per cell are assigned based on the mean 6p BAF per cell as balanced (BAF ≥ 0.35), imbalanced (0.15 ≤ BAF < 0.35) or LOH (BAF < 0.15) (Methods). c, Validation of 6p LOH estimates in cancer cells profiled by scRNA-seq using HLA LOH status in site-matched WGS samples (top) and site-matched MSK-IMPACT samples (bottom). 32 out of 41 patients profiled by scRNA-seq have site-matched WGS data, and 31 out of 41 patients have site-matched MSK-IMPACT data. Box plots show the median, top and bottom quartiles; whiskers correspond to 1.5× IQR. d, Correlation between arm-level BAF estimates inferred by scRNA-seq and WGS. e, Rarefaction curve of the arm-level LOH landscape detected by scRNA-seq, correlating the landscape of events at increasing cancer cell fractions in scRNA-seq to WGS (top) and MSK-IMPACT (bottom). f, Correlation between the fraction of samples with arm-level LOH in scRNA-seq and WGS (top), and in scRNA-seq and MSK-IMPACT (bottom), at increasing scRNA-seq cancer cell fractions. g, Normalized density contours of 6p BAF and JAK-STAT pathway activity in cancer cells for each patient. hi, Normalized density contours of 6p BAF and JAK-STAT pathway activity in cancer cells comparing mutational signatures (h) and anatomic sites of origin (i). In ci, only scRNA-seq BAF estimates from cells with ≥ 10 reads aligning to chromosome arm 6p are considered, and allelic imbalance states are assigned per cell based on the mean 6p BAF per cell as balanced (BAF ≥ 0.35), imbalanced (0.15 ≤ BAF < 0.35) or LOH (BAF < 0.15) (Methods).
Extended Data Fig. 13
Extended Data Fig. 13. Site-specific determinants of spatial interactions between cancer cells, T cells and macrophages.
a, Representative mpIF fields of view (FOVs) from adnexal, bowel and omentum specimens from patient 007 (HRD-Dup), indicating spatial intra-patient variation in ligand-receptor interactions between PD-L1 and PD-1. First column, raw pseudocolour images; second column, cellular phenotypes of segmented cells; remaining columns, proximity of pairs of phenotypes, highlighting ligand-receptor interactions between PD-L1 and PD-1 with colour-coded phenotypes, and edges depicting nearest-neighbour distances. Only edges joining pairs of cells within 250 μm are shown. bc, Nearest-neighbour distance from CD8+ T cell phenotypes to panCK+PD-L1+ cancer cells aggregated across FOVs, grouped by anatomic site. Vertical lines indicate the median nearest-neighbour distance. de, Nearest-neighbour distance from CD8+ T cell phenotypes to CD68+PD-L1+ macrophages aggregated across FOVs, grouped by anatomic site. Vertical lines indicate the median nearest-neighbour distance. f, Interaction network diagrams depicting ligand-receptor co-expression across cell types, grouped by mutational signature. Nodes show mean PD-1 (PDCD1) expression in CD4+ T, CD8+ T and NK clusters, and mean PD-L1 (CD274) expression in myeloid cell clusters in scRNA-seq data, depicted by circle size. Arrows join ligand-expressing sender clusters to receptor-expressing receiver clusters and are weighted by frequency of PD-1 and PD-L1 co-expression.
Extended Data Fig. 14
Extended Data Fig. 14. Mutational processes impacting spatial interactions between cancer cells, T cells and macrophages.
a, Proximity analysis between CD8+ T cell phenotypes (green dots) and panCK+PD-L1+ cancer cells in their periphery (pink dots) based on mpIF data. Samples are ranked by the fraction of CD8+PD-1TOX T cells (left), CD8+PD-1+TOX T cells (middle) or CD8+PD-1+TOX+ T cells (right) with ≥ 1 panCK+PD-L1+ cell within 30 μm. Upper panels, absolute abundance of CD8+ T cell states. Middle panels, fraction of CD8+ T cell phenotypes with ≥ 1 panCK+PD-L1+ cell within 30 μm. Lower panels, box plot distributions of sample ranks with respect to mutational signature. b, Nearest-neighbour distance from CD8+ T cell phenotypes to panCK+PD-L1+ cancer cells aggregated across fields of view (FOVs), grouped by anatomic site and mutational signature subtype. Vertical lines indicate the median nearest-neighbour distance. c, Representative mpIF FOVs highlighting common features of the tumour microenvironment, showing one adnexal sample per mutational signature subtype. First column: Raw pseudocolour images; second and third columns: proximity of pairs of phenotypes, highlighting ligand-receptor interactions between PD-L1 and PD-1 with colour-coded phenotypes, and edges depicting nearest-neighbour distances. Only edges joining pairs of cells within 250 μm are shown. d, Proximity analysis between CD8+ T cell phenotypes (green dots) and CD68+PD-L1+ macrophages (yellow dots) based on mpIF data, ranking samples by the fraction of CD8+PD-1TOX T cells (left), CD8+PD-1+TOX T cells (middle) or fraction of CD8+PD-1+TOX+ T cells (right) with ≥ 1 CD68+PD-L1+ cell within 30 μm. Vertically aligned subpanels share the same x-axis. Upper panels, bar graphs show absolute abundance of CD8+ T cell states. Middle panels, bar graphs show the fraction of CD8+ T cell phenotypes with ≥ 1 CD68+PD-L1+ cell within 30 μm. Lower panels, box plot distributions of sample ranks with respect to mutational signature. e,f, Nearest-neighbour distance from CD8+ T cell phenotypes to CD68+PD-L1+ macrophages aggregated across FOVs, grouped by anatomic site and mutational signature subtype. Vertical lines indicate the median nearest-neighbour distance.

Comment in

References

    1. Patch A-M, et al. Whole-genome characterization of chemoresistant ovarian cancer. Nature. 2015;521:489–494. doi: 10.1038/nature14410. - DOI - PubMed
    1. Li Y, et al. Patterns of somatic structural variation in human cancer genomes. Nature. 2020;578:112–121. doi: 10.1038/s41586-019-1913-9. - DOI - PMC - PubMed
    1. Drews RM, et al. A pan-cancer compendium of chromosomal instability. Nature. 2022;606:976–983. doi: 10.1038/s41586-022-04789-9. - DOI - PMC - PubMed
    1. Wang YK, et al. Genomic consequences of aberrant DNA repair mechanisms stratify ovarian cancer histotypes. Nat. Genet. 2017;49:856–865. doi: 10.1038/ng.3849. - DOI - PubMed
    1. Funnell, T. et al. Single-cell genomic variation induced by mutational processes in cancer. Nature10.1038/s41586-022-05249-0 (2022). - PMC - PubMed

Publication types

Substances