. 2022 Dec;612(7941):707-713.
doi: 10.1038/s41586-022-05523-1. Epub 2022 Dec 14.

Logged tropical forests have amplified and diverse ecosystem energetics

Affiliations

Logged tropical forests have amplified and diverse ecosystem energetics

Yadvinder Malhi et al. Nature. 2022 Dec.

Abstract

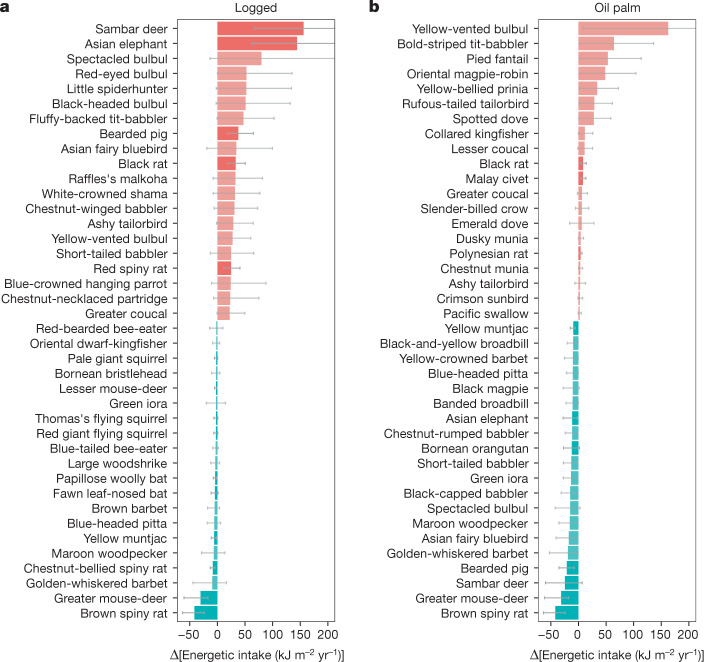
Old-growth tropical forests are widely recognized as being immensely important for their biodiversity and high biomass1. Conversely, logged tropical forests are usually characterized as degraded ecosystems2. However, whether logging results in a degradation in ecosystem functions is less clear: shifts in the strength and resilience of key ecosystem processes in large suites of species have rarely been assessed in an ecologically integrated and quantitative framework. Here we adopt an ecosystem energetics lens to gain new insight into the impacts of tropical forest disturbance on a key integrative aspect of ecological function: food pathways and community structure of birds and mammals. We focus on a gradient spanning old-growth and logged forests and oil palm plantations in Borneo. In logged forest there is a 2.5-fold increase in total resource consumption by both birds and mammals compared to that in old-growth forests, probably driven by greater resource accessibility and vegetation palatability. Most principal energetic pathways maintain high species diversity and redundancy, implying maintained resilience. Conversion of logged forest into oil palm plantation results in the collapse of most energetic pathways. Far from being degraded ecosystems, even heavily logged forests can be vibrant and diverse ecosystems with enhanced levels of ecological function.


Conflict of interest statement

The authors declare no competing interests.

Figures

Fig. 1
Fig. 1. Maps of the study sites in Sabah, Borneo.
ad, Maps showing locations of NPP plots and biodiversity surveys in old-growth forest, logged forest and oil palm plantations in the Stability of Altered Forest Ecosystems Project landscape (a), Maliau Basin (b), Danum Valley (c) and Sepilok (d). The inset in a shows the location of the four sites in Sabah. The shade of green indicates old-growth (dark green), twice-logged (intermediate green) or heavily logged (light green) forests. The camera and trap grid includes cameras and small mammal traps. White areas indicate oil palm plantations.
Fig. 2
Fig. 2. Variation of ecosystem energetics along the disturbance gradient from old-growth forest through logged forest to oil palm.
a, Total NPP along the gradient (mean of intensive 1-ha plots; n = 4 for old growth (OG), n = 5 for logged and n = 1 for oil palm (OP); error bars are 95% confidence intervals derived from propagated uncertainty in the individually measured NPP components), with individual plot data points overlaid. b,c, Total body mass (bars, left axis) and number of species counted (blue dots and line, right axis) of birds (b) and mammals (c). d,e, Total direct energetic food intake by birds (d) and mammals (e). f,g, Percentage of NPP directly consumed by birds (f) and mammals (g). In be, body mass and energetics were estimated for individual bird and mammal species, with the bars showing the sum. Error bars denote 95% confidence intervals derived from 10,000 Monte Carlo simulation estimates incorporating uncertainty in body mass, population density, the daily energy expenditure equation, assimilation efficiency of the different food types, composition of the diet of each species and NPP. In f,g, the grey bars indicate direct consumption of NPP, white bars denote the percentage of NPP indirectly supporting bird and mammal food intake when the mean trophic level of consumed invertebrates is assumed to be 2.5, with the error bars denoting assumed mean trophic levels of 2.4 and 2.6. Note the log scale of the y axis in f,g. Numbers for d,e provided in Supplementary Data Tables 1, 2.
Fig. 3
Fig. 3. Magnitude and species diversity of energetic pathways in old-growth forest, logged forest and oil palm.
The size of the circles indicates the magnitude of energy flow, and the colour indicates birds or mammals. S, number of species; E, ESWI, an index of species redundancy and, therefore, resilience (high values indicate high redundancy; see main text). For clarity, guilds with small energetic flows are not shown, but are listed in Supplementary Data 4. Images created by J. Bentley.
Fig. 4
Fig. 4. Changes in energy consumption by species in logged forest and oil palm relative to old-growth forest.
a,b, Changes in energy consumption by species in logged forest relative to old-growth forest (a) and in oil palm relative to old-growth forest (b). The 20 species experiencing the largest increase (red) and decrease (blue) in both habitat types are shown. Bird species are shown in a lighter tone and mammal species are shown in a darker tone. The error bars denote 95% confidence intervals, derived from 10,000 Monte Carlo simulation estimates incorporating uncertainty in body mass, population density, the daily energy expenditure equation, assimilation efficiency of the different food types and composition of the diet of each species.
Extended Data Fig. 1
Extended Data Fig. 1. Distribution of sampling locations across the gradient of logging intensity in the study landscape, characterised using aboveground dry biomass (t/ha).
We estimate biomass from a spatially-explicit surface of carbon density (30 m resolution) derived from airborne Light Detection and Ranging (LiDAR) data (see for full sampling details) and convert carbon to dry biomass using a conversion factor of 0.47 (). To provide a representative sample of local habitat conditions, biomass was extracted as mean values from 100 m radii buffers around each sampling point. At this resolution there are a broad range of dry biomass values in both old growth and logged forests, but the mean values are clearly distinguished. The histogram top-left shows the biomass and habitat type extracted at each sampling location for all focal taxa combined. The taxa-specific plots simply break that information down to each focal group: the sampling points for vegetation primary productivity (points at top of top-left panel), bats (top-right), birds (bottom-left) and terrestrial mammals (bottom-right) span this gradient well.
Extended Data Fig. 2
Extended Data Fig. 2. The dominant bird and mammal species in terms of food energy consumption in old-growth forest, logged forest and oil palm plantation.
Species-level resource consumption in birds (a-c) and mammals (d-f) (top 20 consumers in each forest type). Error bars denote 95% confidence intervals, derived from 10,000 Monte Carlo simulation estimates incorporating uncertainty in body mass, population density, the daily energy expenditure equation, assimilation efficiency of the different food types and composition of the diet of each species. Data for all species in the study are provided in Supplementary Data 1.
Extended Data Fig. 3
Extended Data Fig. 3. Variation of energy intake by birds and mammals by size class.
Direct energetic intake of birds (a) and mammals (b) by body mass class (logarithmic scale) in old growth forest (OG), logged forest and oil palm plantation (OP). The numbers next to the bars indicate the number of species in each class. Error bars denote 95% confidence intervals, derived from 10,000 Monte Carlo simulation estimates incorporating uncertainty in body mass, population density, the daily energy expenditure equation, assimilation efficiency of the different food types and composition of the diet of each species. Data provided in Supplementary Data 4.
Extended Data Fig. 4
Extended Data Fig. 4. Simulations of the effects of hunting on the total biomass and energy intake of birds and mammals.
Body mass of birds (a) and mammals (b) and energetic food intake of birds (c) and mammals (d) in old growth forest (OG, dark grey, no hunting) and in logged forest (light grey) under four different hunting scenarios: observed low hunting pressure (baseline) and simulated 50% reduction in population density of targeted hunted species, indiscriminately hunted species and both targeted and indiscriminately hunted species. Targeted hunted species include commercially valuable birds, and gun-hunted mammals (bearded pig, ungulates, banteng and mammals with medicinal value). Indiscriminately hunted species include birds and mammals likely to be trapped with nets and snares. For the list of species in each category see Supplementary Data 1. Note that this is not an exhaustive analysis of the hunting pressure in the study area but an illustrative estimate of the potential impact of hunting on trophic energetics. Targeted hunted bird species potentially include 13% of bird species, which account for 17% of bird body mass and 14% of bird energy consumption under the observed low hunting pressure. Targeted hunted mammal species potentially include 10% of mammal species, which account for 46% of body mass, 42% of mammal energy consumption under the observed low hunting pressure. Indiscriminately hunted bird species potentially include 72% of bird species, which account for 78% of bird body mass and 82% of bird energy consumption under the observed low hunting pressure. Indiscriminately hunted mammal species potentially include 22% of mammal species, which account for 2% of mammal body mass and 2% of mammal energy consumption. With both hunting pressures applied simultaneously, hunted bird species potentially include 86% of species, 95% of bird body mass and 96% of bird energy consumption under the observed low hunting pressure, and hunted mammal species potentially include 32% of mammal species, 48% of mammal body mass and 44% of mammal energy consumption under the observed low hunting pressure. Data provided in Supplementary Data 6.
Extended Data Fig. 5
Extended Data Fig. 5. Variation of bird and mammal biomass and energy intake across individual old-growth forest sites and logging intensities.
Body mass and species richness of birds (a) and mammals (b) and energetic food intake of birds (c) and mammals (d) across old growth forests (OG), logged forests and oil palm plantations (OP). OG forest data were analysed separately by four OG sites for birds and two sites for mammals (see Fig 1 for map), and the logged forest data were split into twice logged and heavily logged areas. For mammals, only species studied using camera traps and harp traps were included (63%, 63% and 77% of mammal species, and 53%, 45% and 63% of total energetic food intake in OG, logged forest and OP, respectively). Error bars are 95% confidence intervals derived from 10,000 Monte Carlo simulation estimates incorporating uncertainty in body mass, population density, the daily energy expenditure equation, assimilation efficiency of the different food types and composition of the diet of each species. Data provided in Supplementary Data 7.
Extended Data Fig. 6
Extended Data Fig. 6. Sources of uncertainty in estimation of energetic intake.
Sources of contribution to uncertainty in energetic intake (a) and proportion of net primary productivity (NPP) consumed (b) for birds and mammals across the habitat types of old growth forest (OG), logged forest and oil palm plantation (OP). We assumed there was uncertainty in the following variables: body mass of species, population density, the daily energy expenditure (DEE) equation, assimilation efficiency of the different food types, fractional composition of the diet of each species, and NPP. Uncertainty estimates were derived from 10,000 Monte Carlo simulations, and the contribution of each variable to the total uncertainty was assessed by running the simulations assuming uncertainty in all variables simultaneously and in one variable at a time. Data provided in Supplementary Data 5.
Extended Data Fig. 7
Extended Data Fig. 7. The proportion of uncertainity in total energetic uptake contributed by individual bird or mammal species.
The proportion of total uncertainty contributed by each species ranked by energy consumption for birds (a) and mammals (b).

Comment in

References

    1. Gibson L, et al. Primary forests are irreplaceable for sustaining tropical biodiversity. Nature. 2011;478:378–381. doi: 10.1038/nature10425. - DOI - PubMed
    1. Malhi Y, Gardner TA, Goldsmith GR, Silman MR, Zelazowski P. Tropical forests in the Anthropocene. Annu. Rev. Environ. Resour. 2014;39:125–159. doi: 10.1146/annurev-environ-030713-155141. - DOI
    1. Meijaard E, Sheil D. A logged forest in Borneo is better than none at all. Nature. 2007;446:974. doi: 10.1038/446974a. - DOI - PubMed
    1. Bergius M, Benjaminsen TA, Maganga F, Buhaug H. Green economy, degradation narratives, and land-use conflicts in Tanzania. World Dev. 2020;129:104850. doi: 10.1016/j.worlddev.2019.104850. - DOI
    1. Giam X, Clements GR, Aziz SA, Chong KY, Miettinen J. Rethinking the ‘back to wilderness’ concept for Sundaland’s forests. Biol. Conserv. 2011;144:3149–3152. doi: 10.1016/j.biocon.2011.10.001. - DOI

Publication types