. 2022 Dec;612(7941):739-747.
doi: 10.1038/s41586-022-05525-z. Epub 2022 Dec 14.

A microbiome-dependent gut-brain pathway regulates motivation for exercise

Affiliations

A microbiome-dependent gut-brain pathway regulates motivation for exercise

Lenka Dohnalová et al. Nature. 2022 Dec.

Abstract

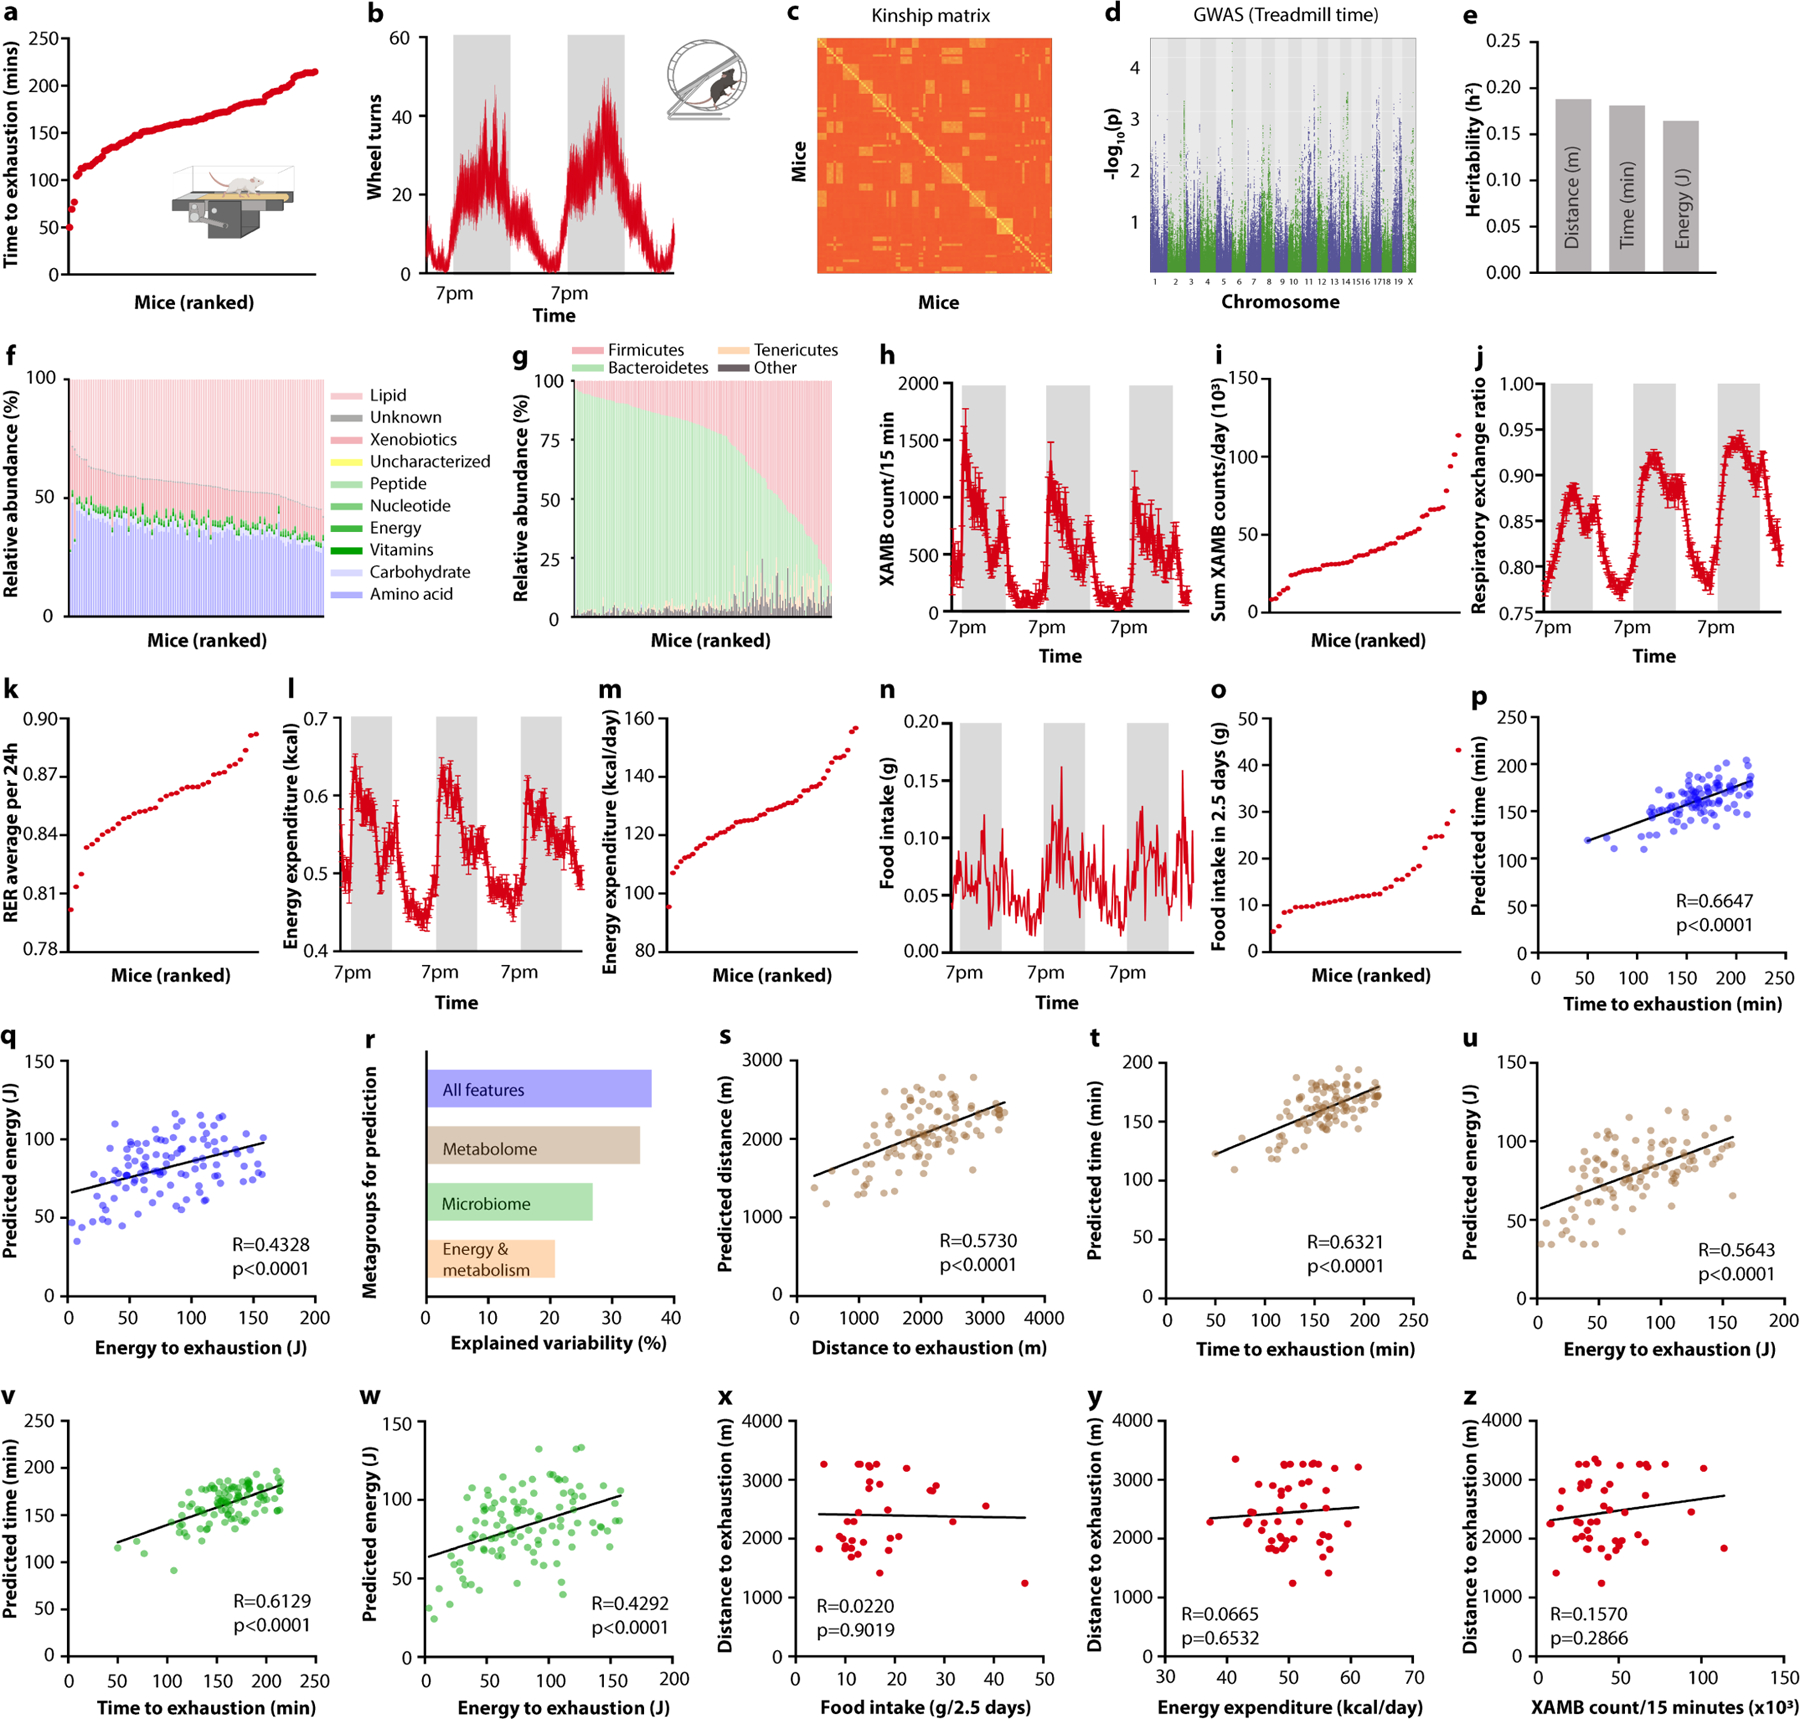
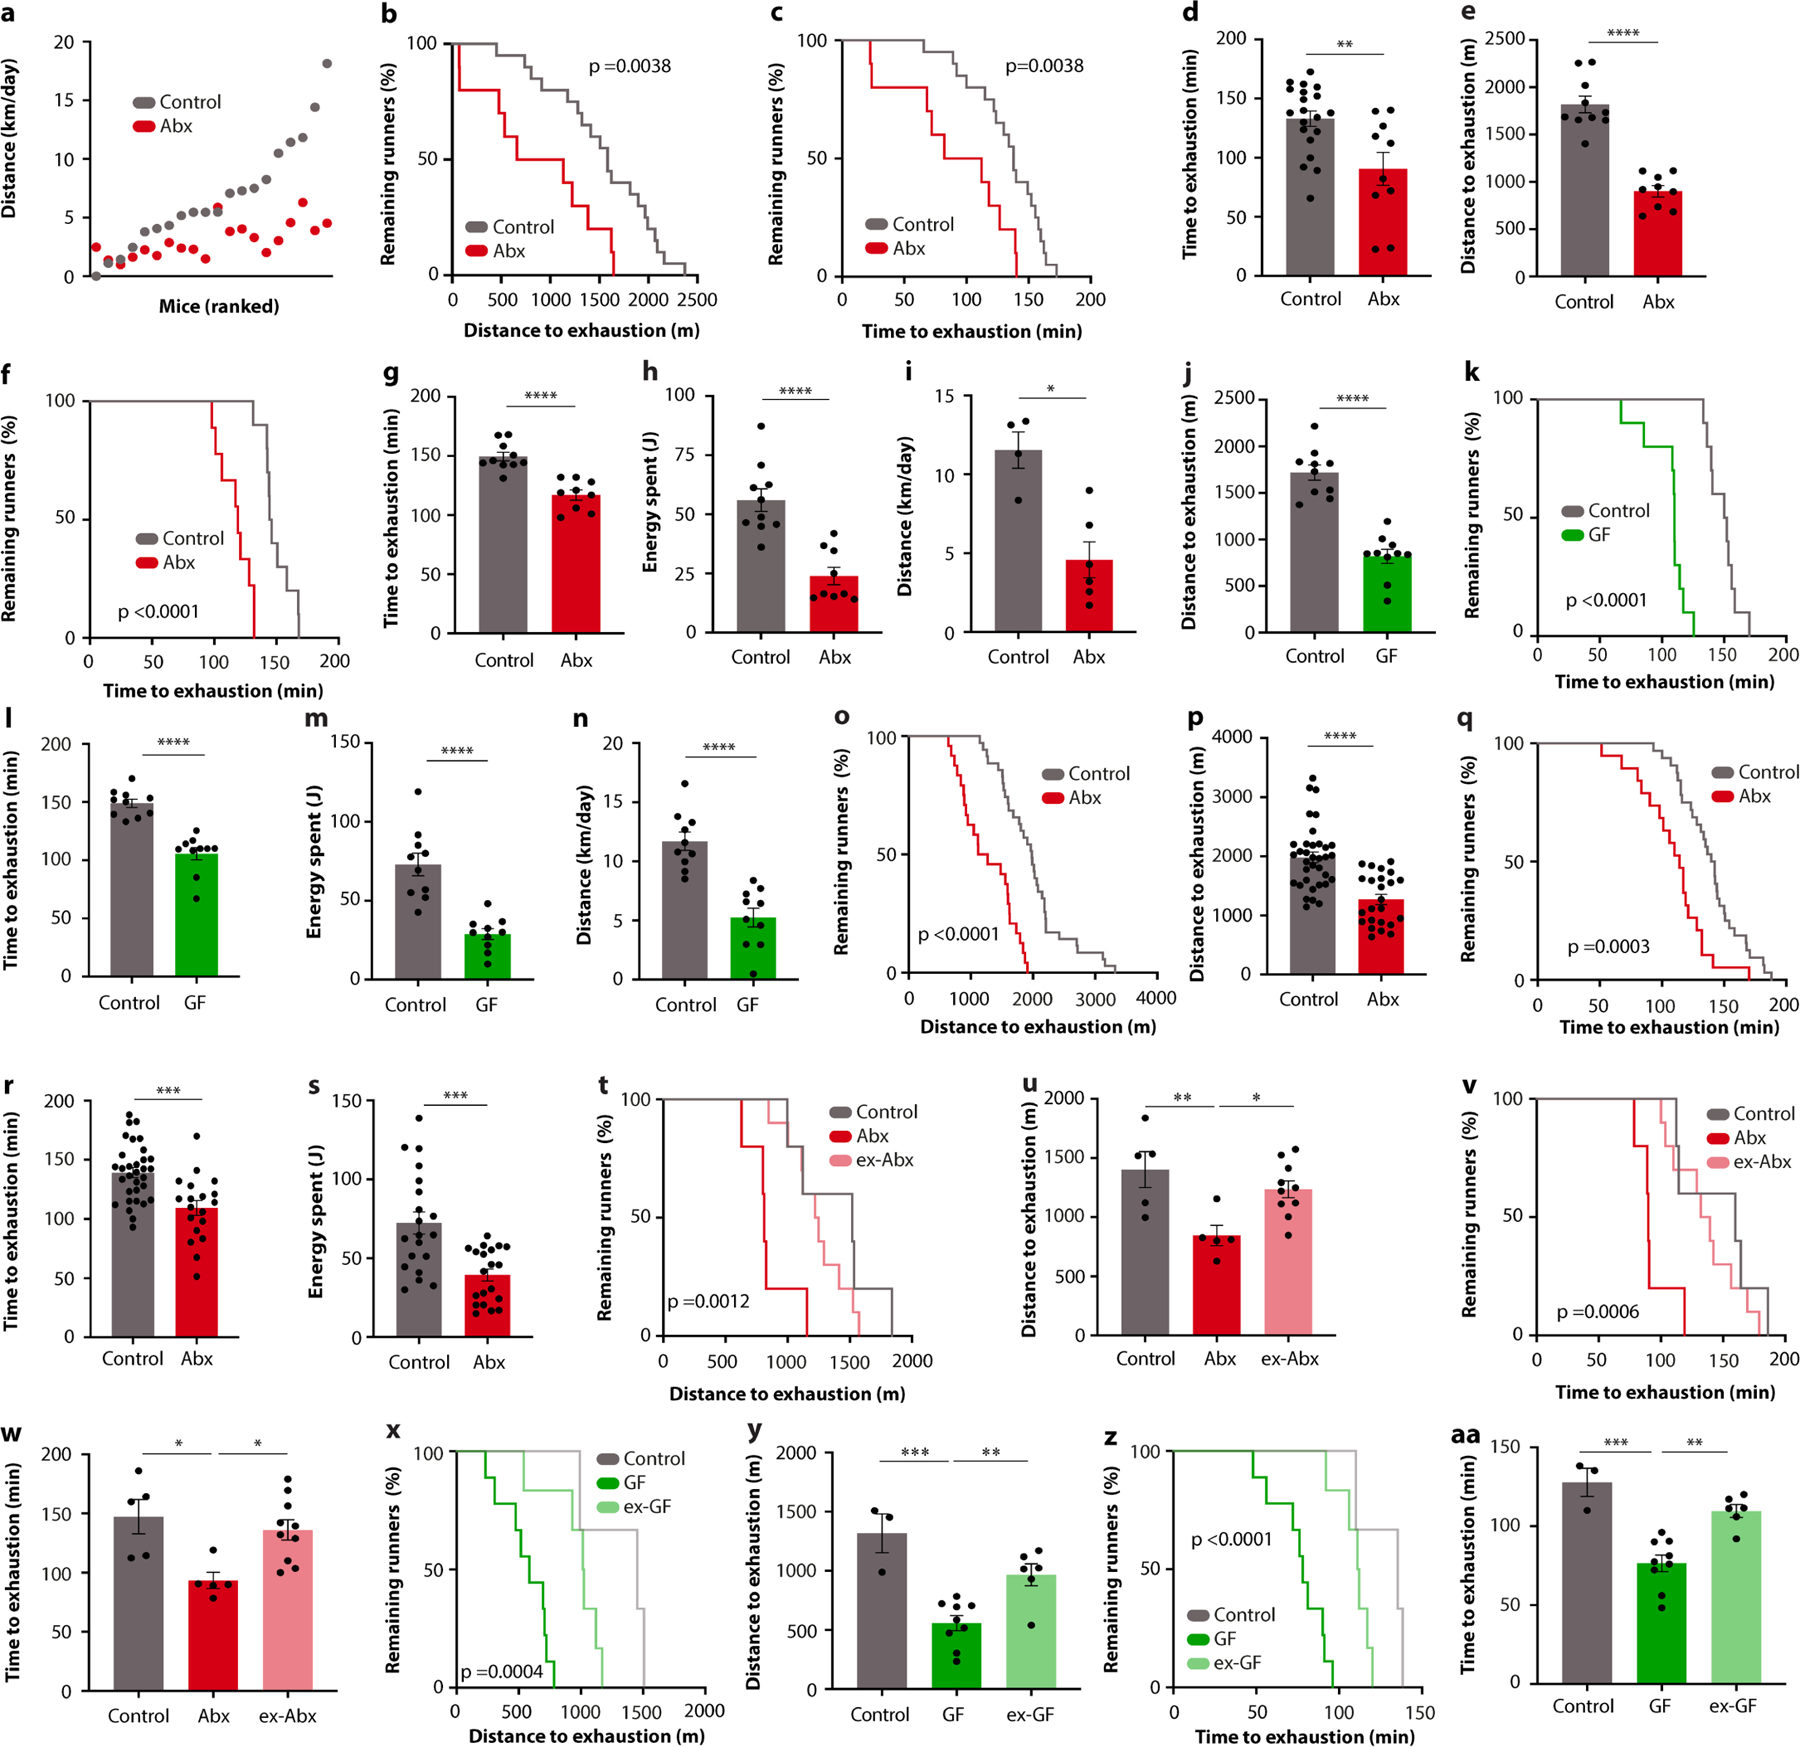
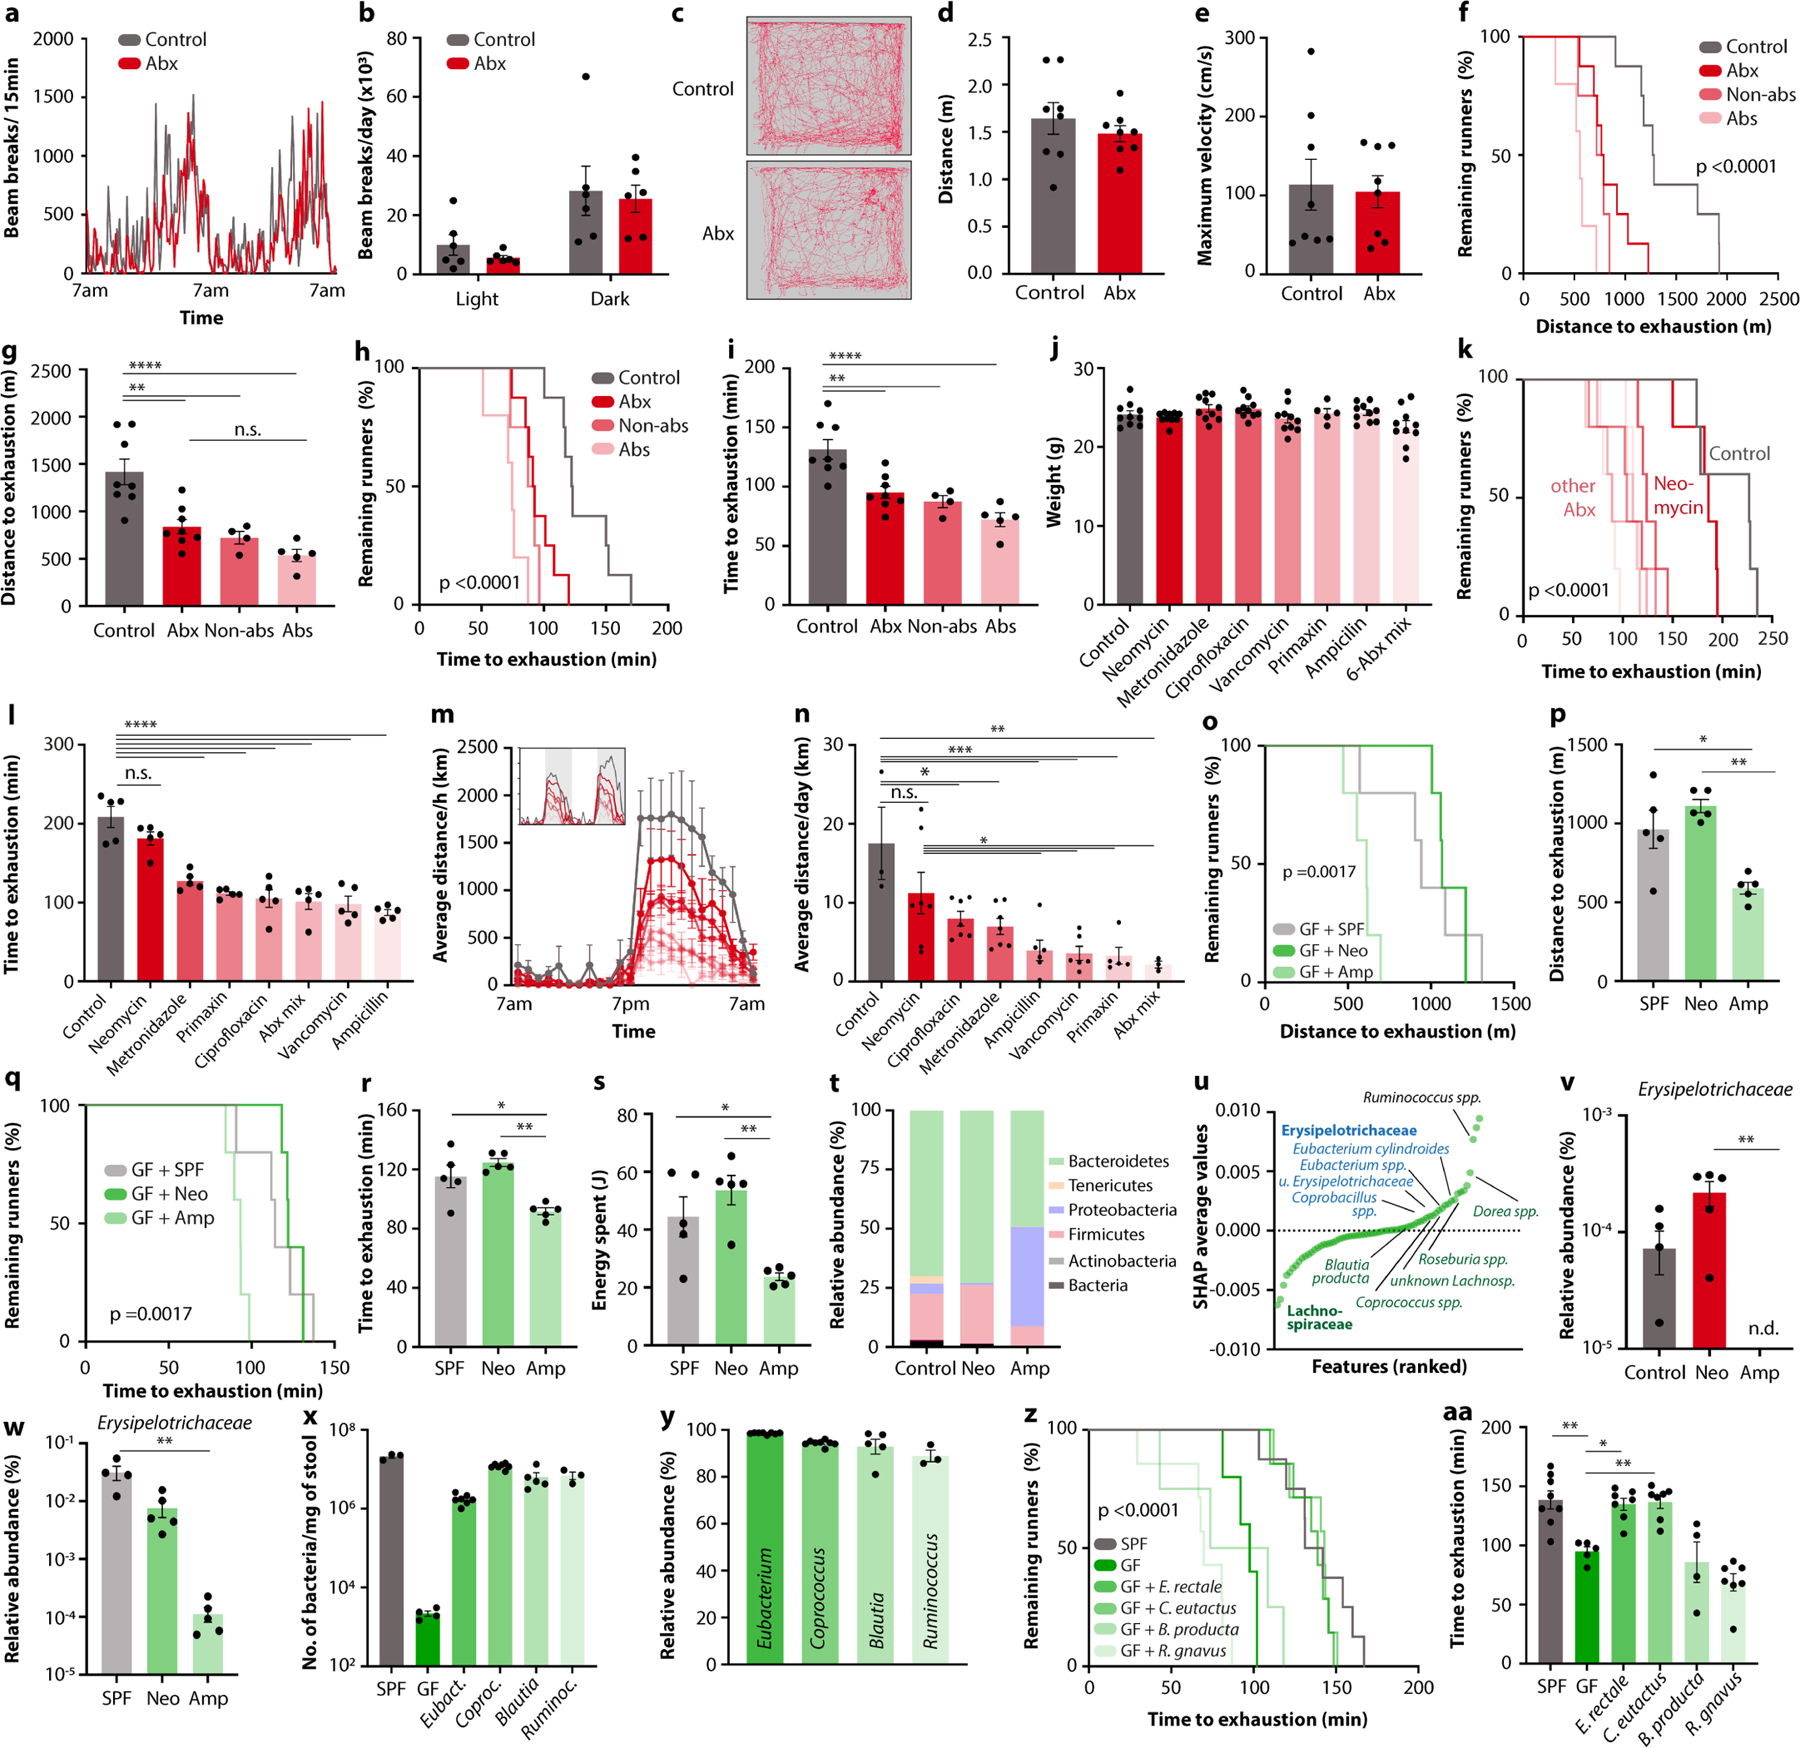
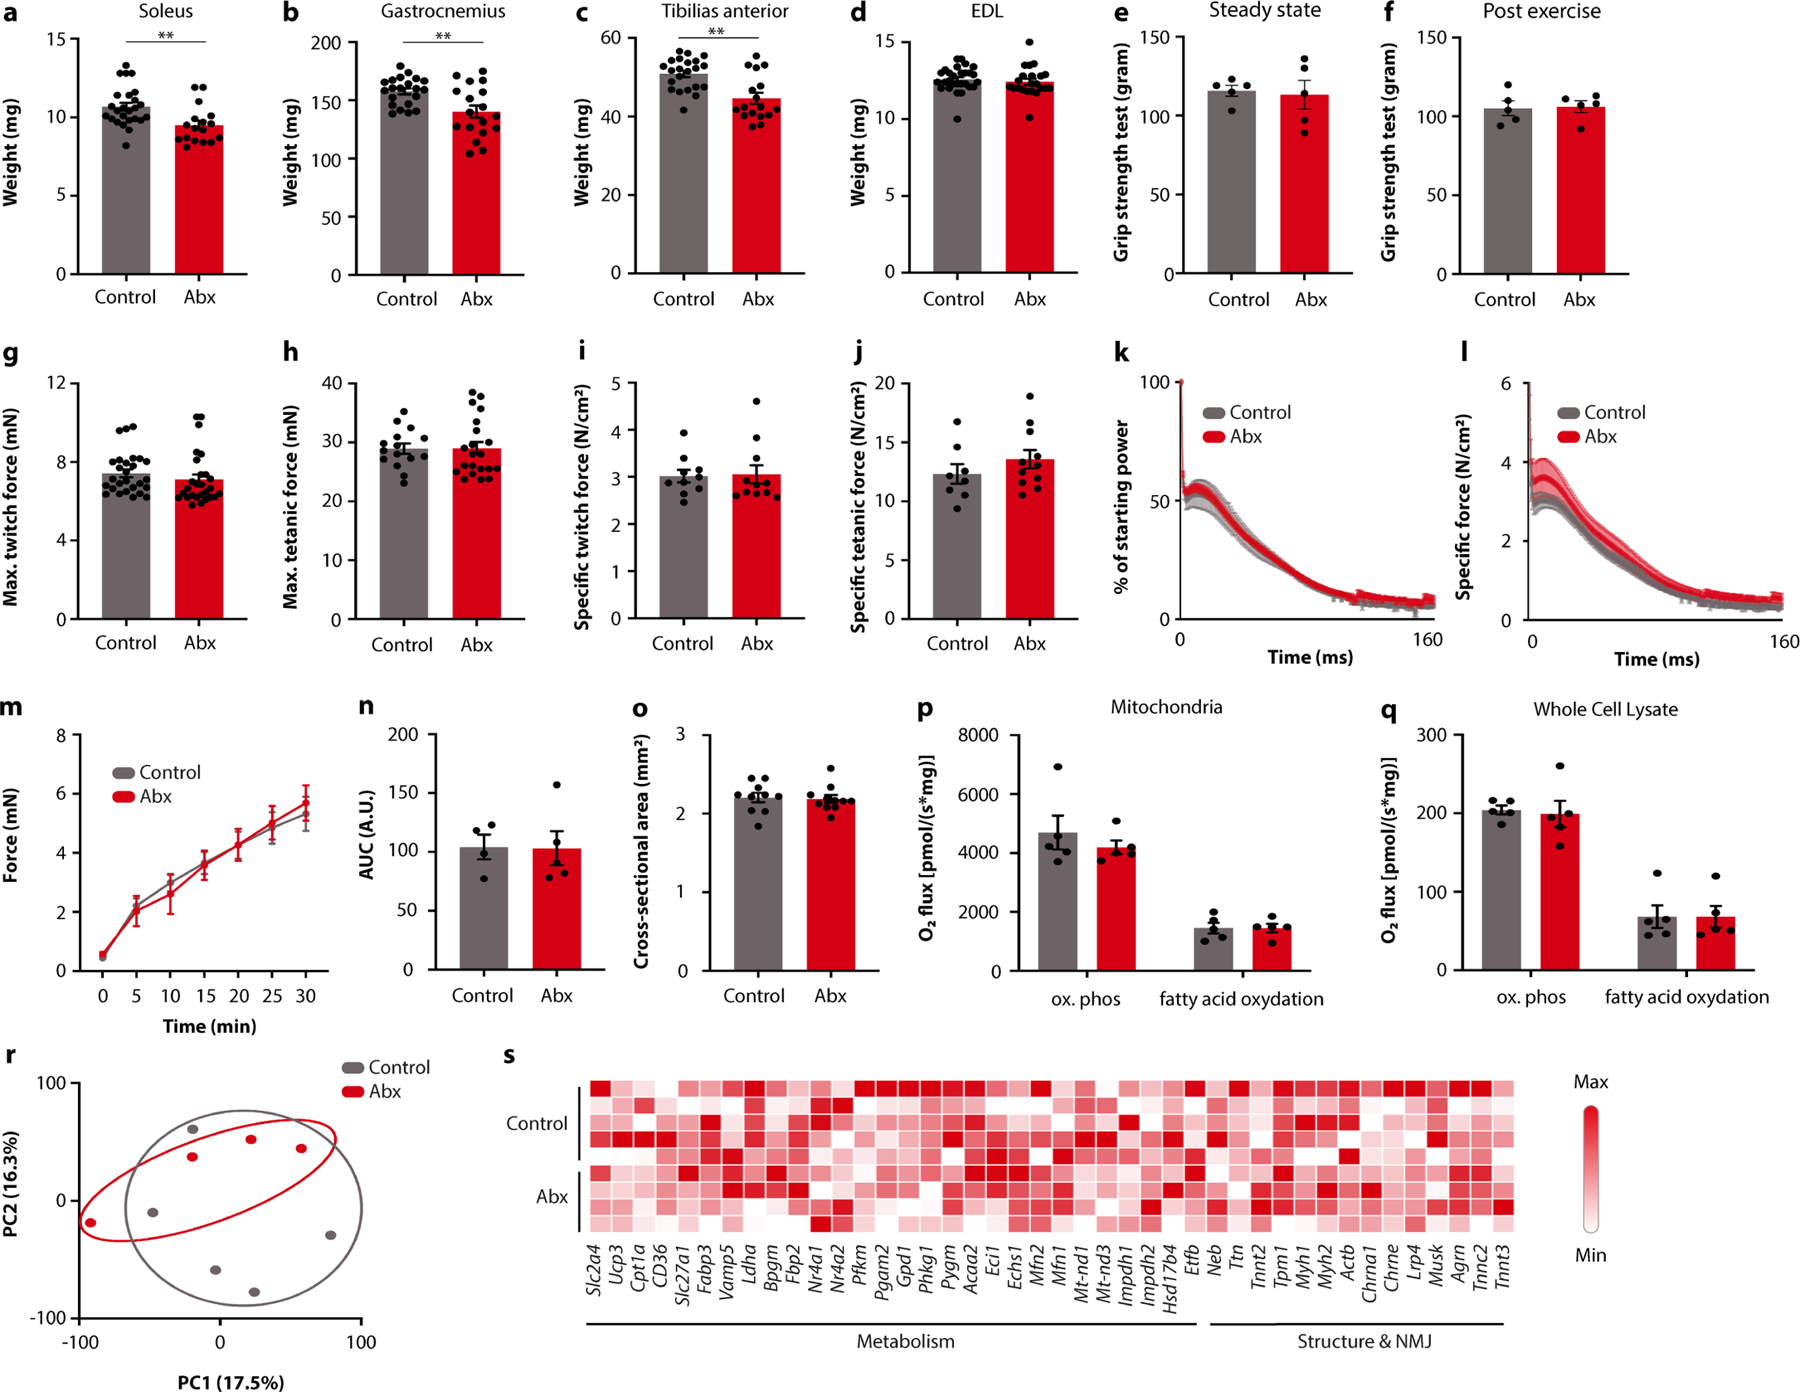
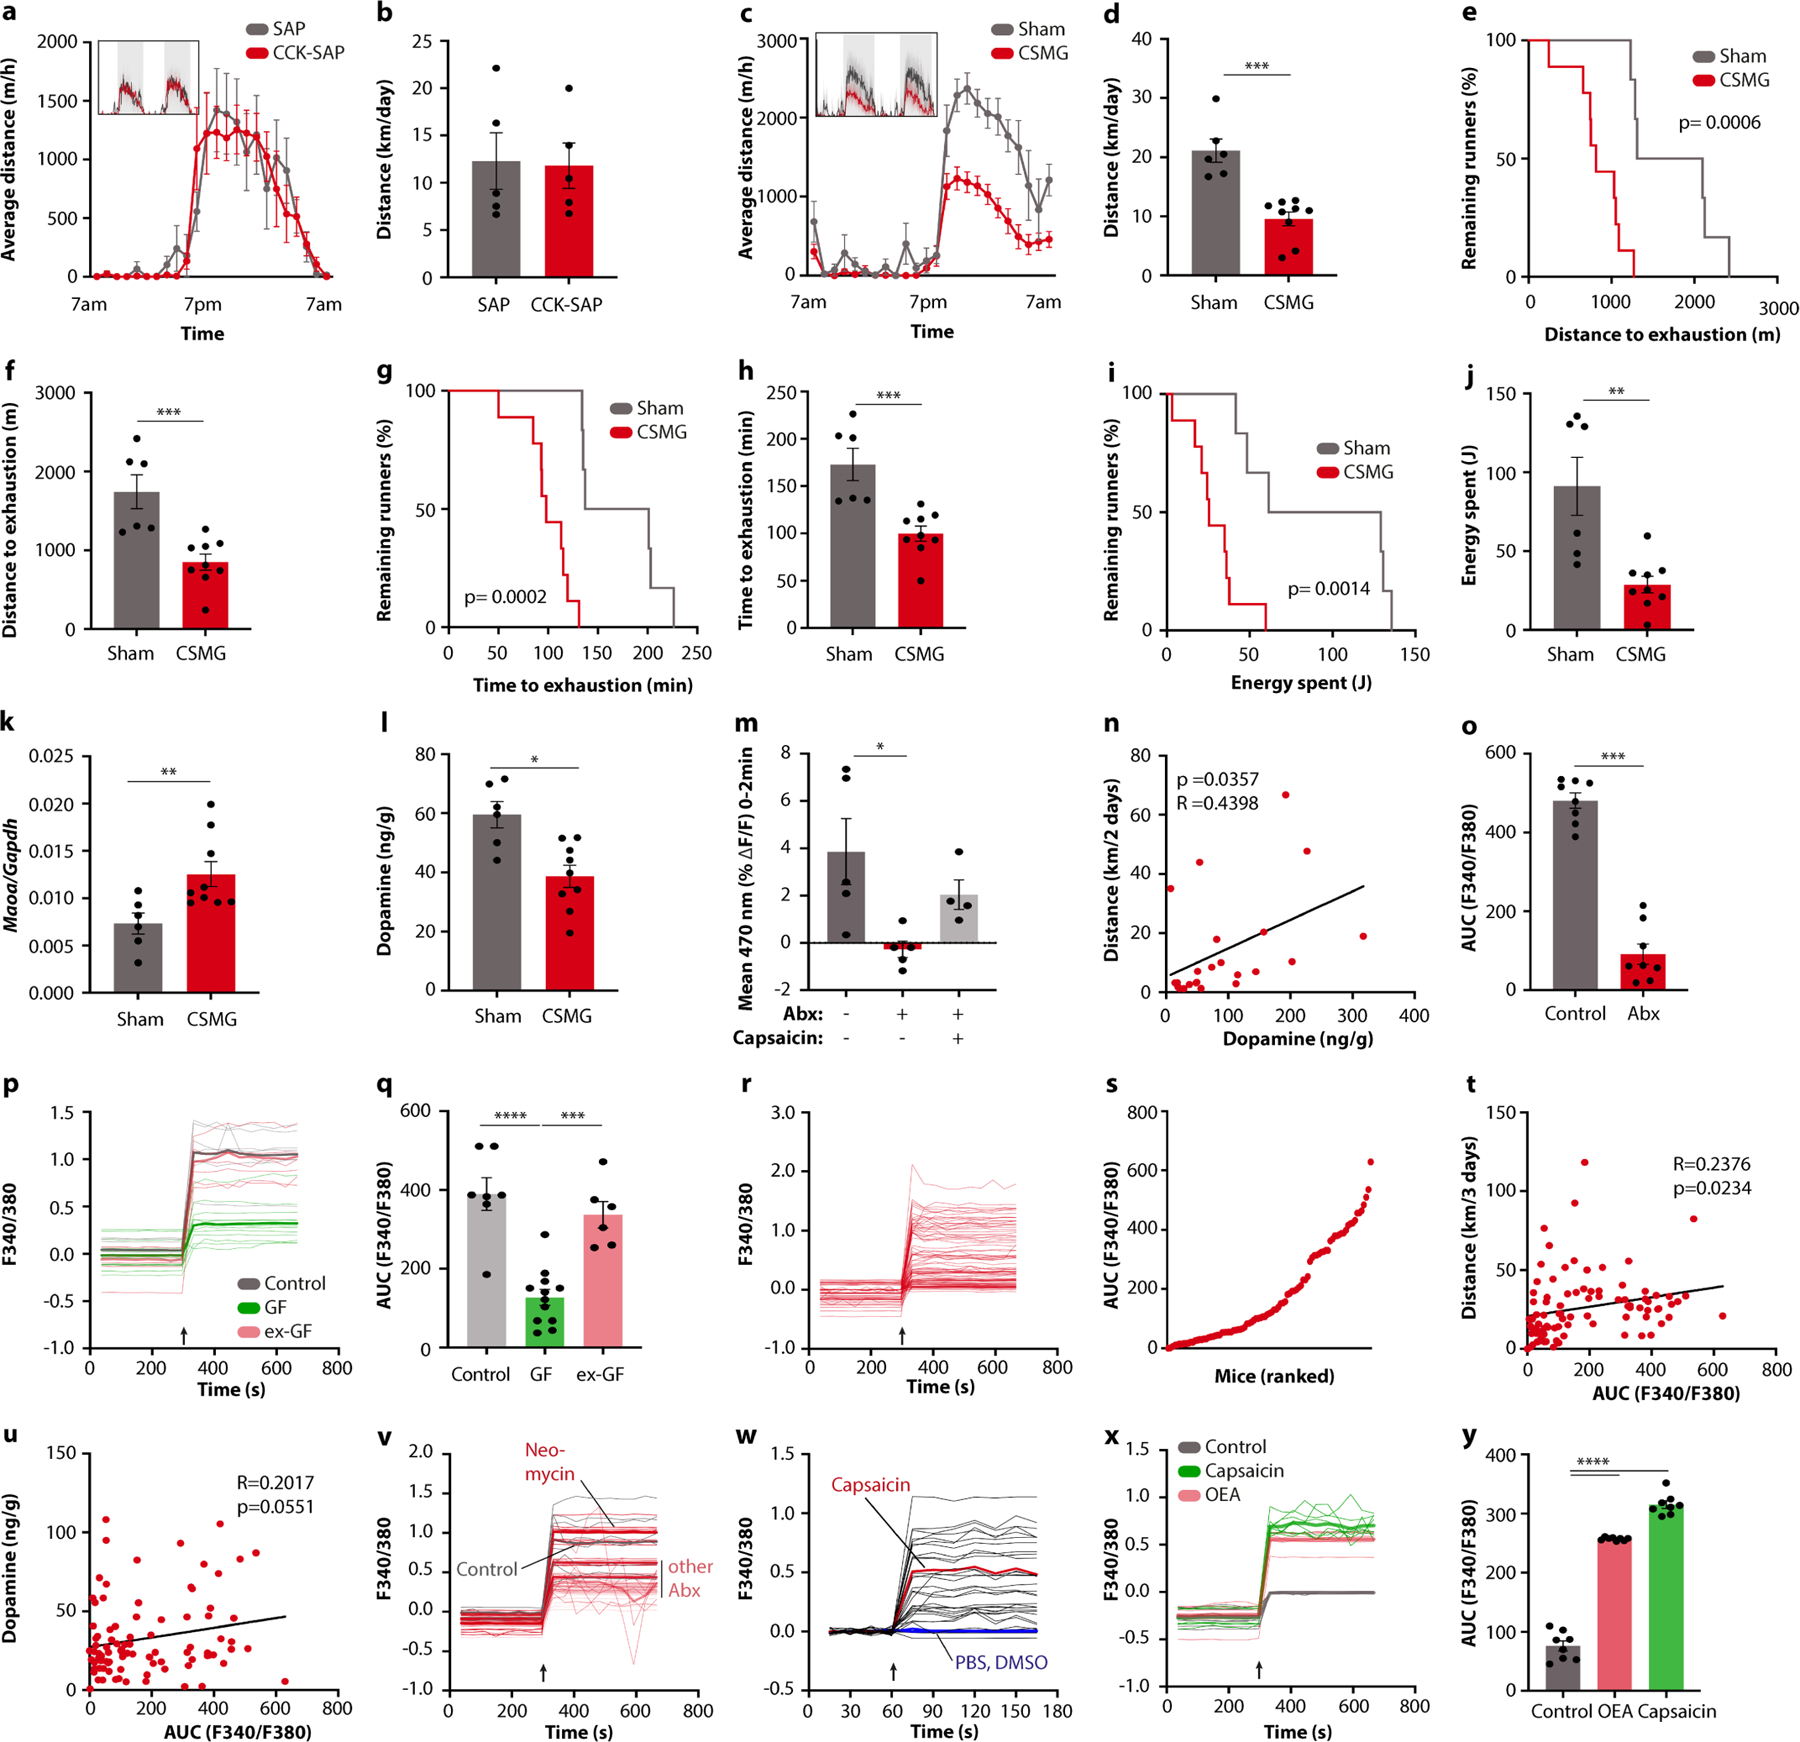
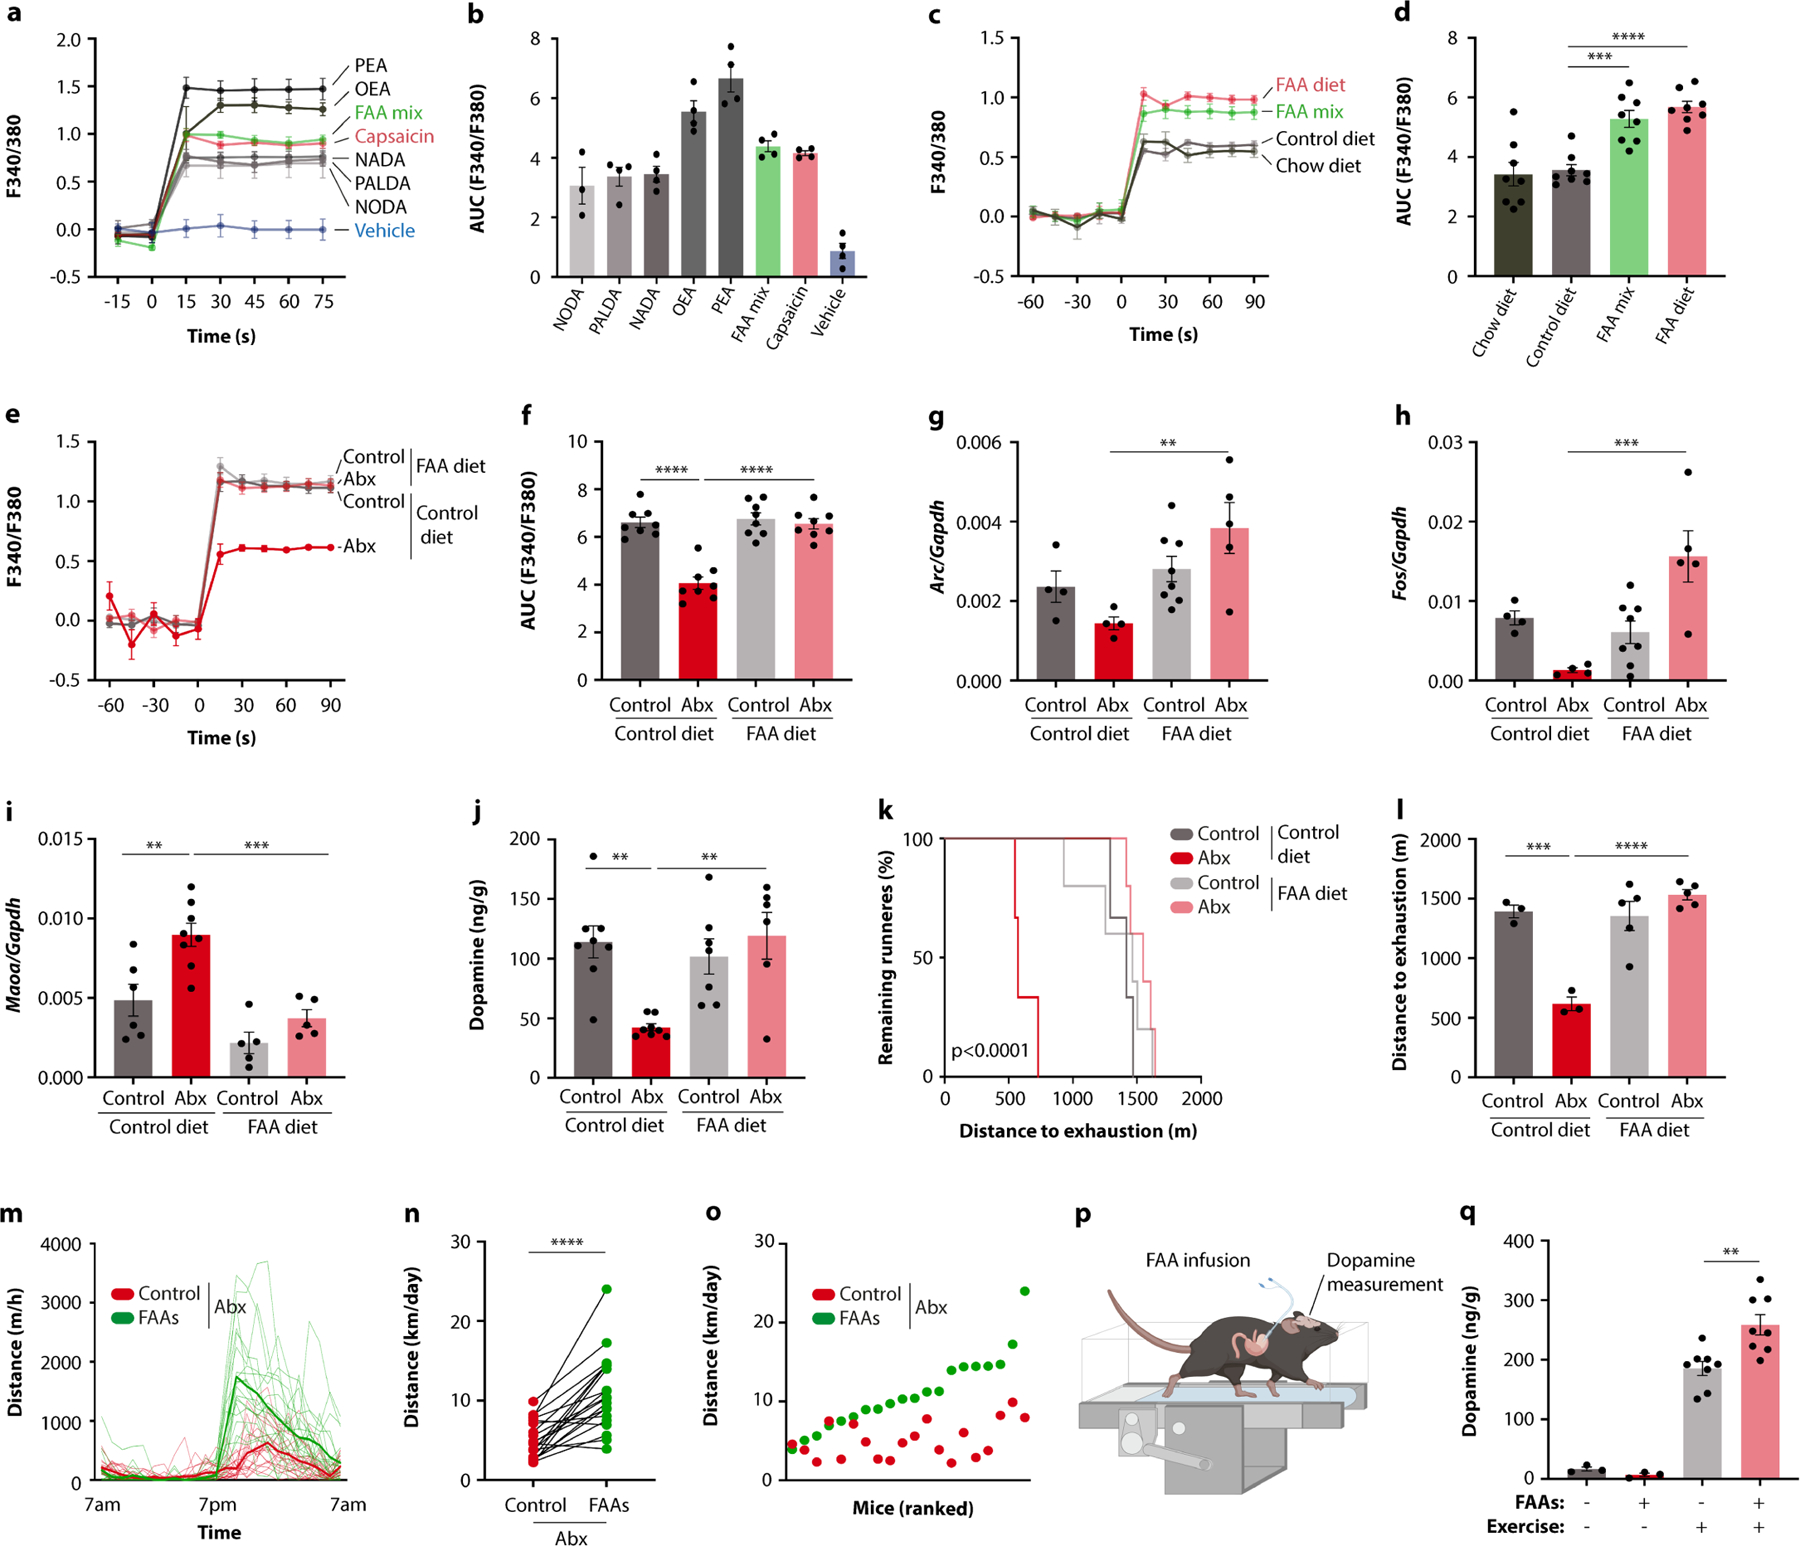
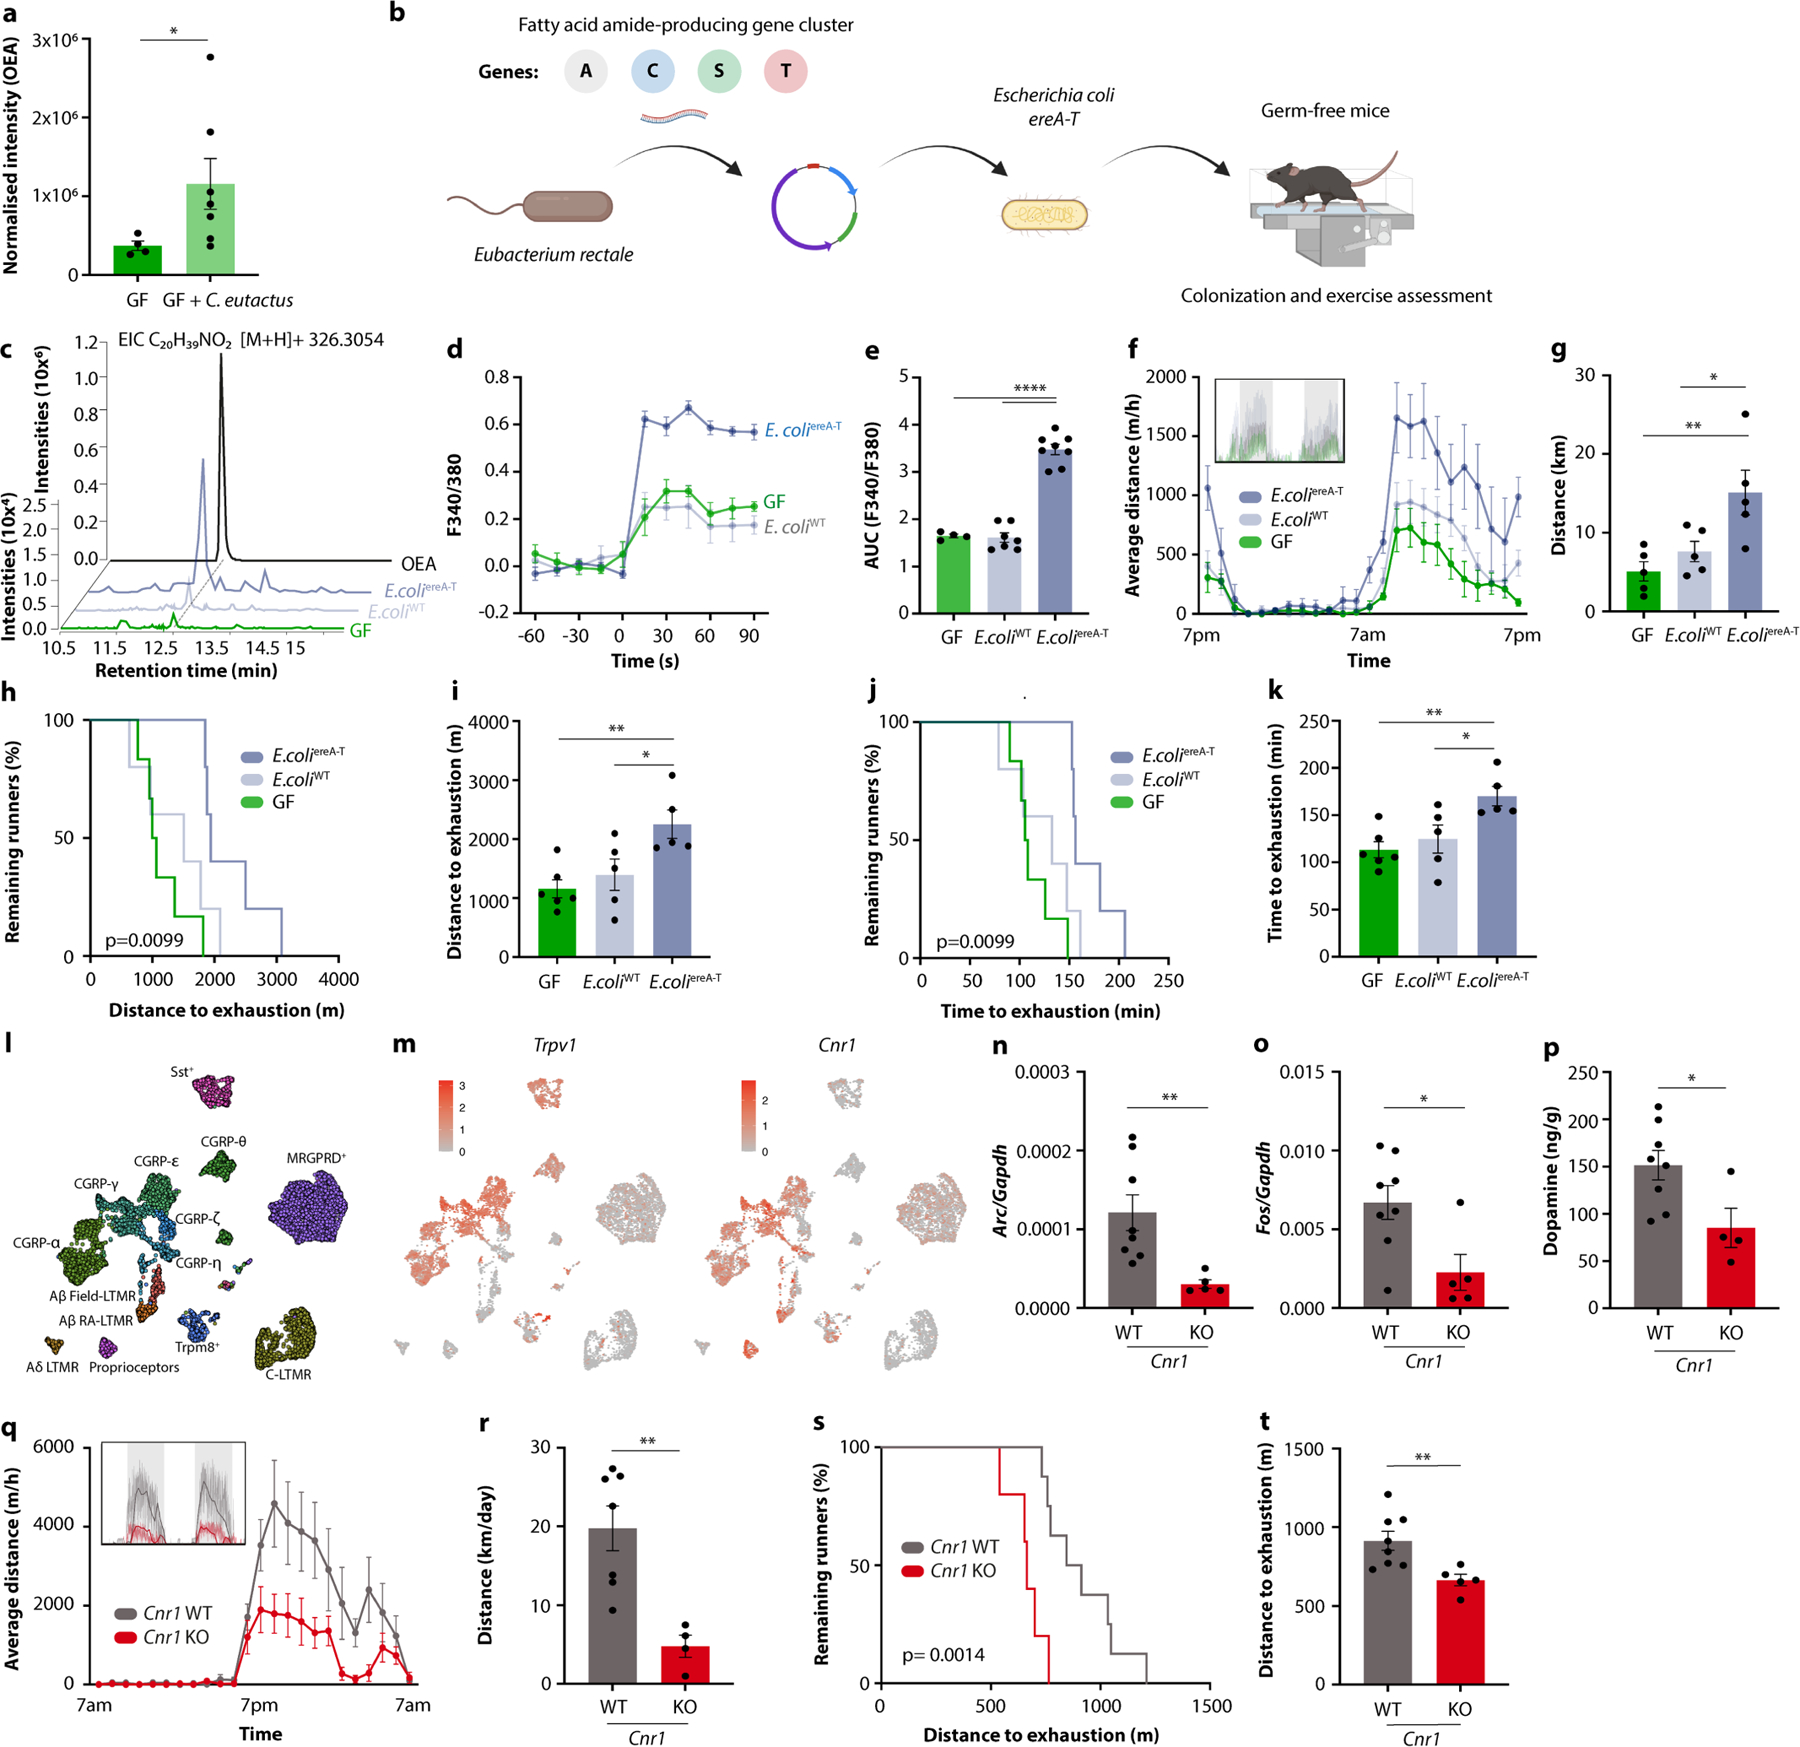
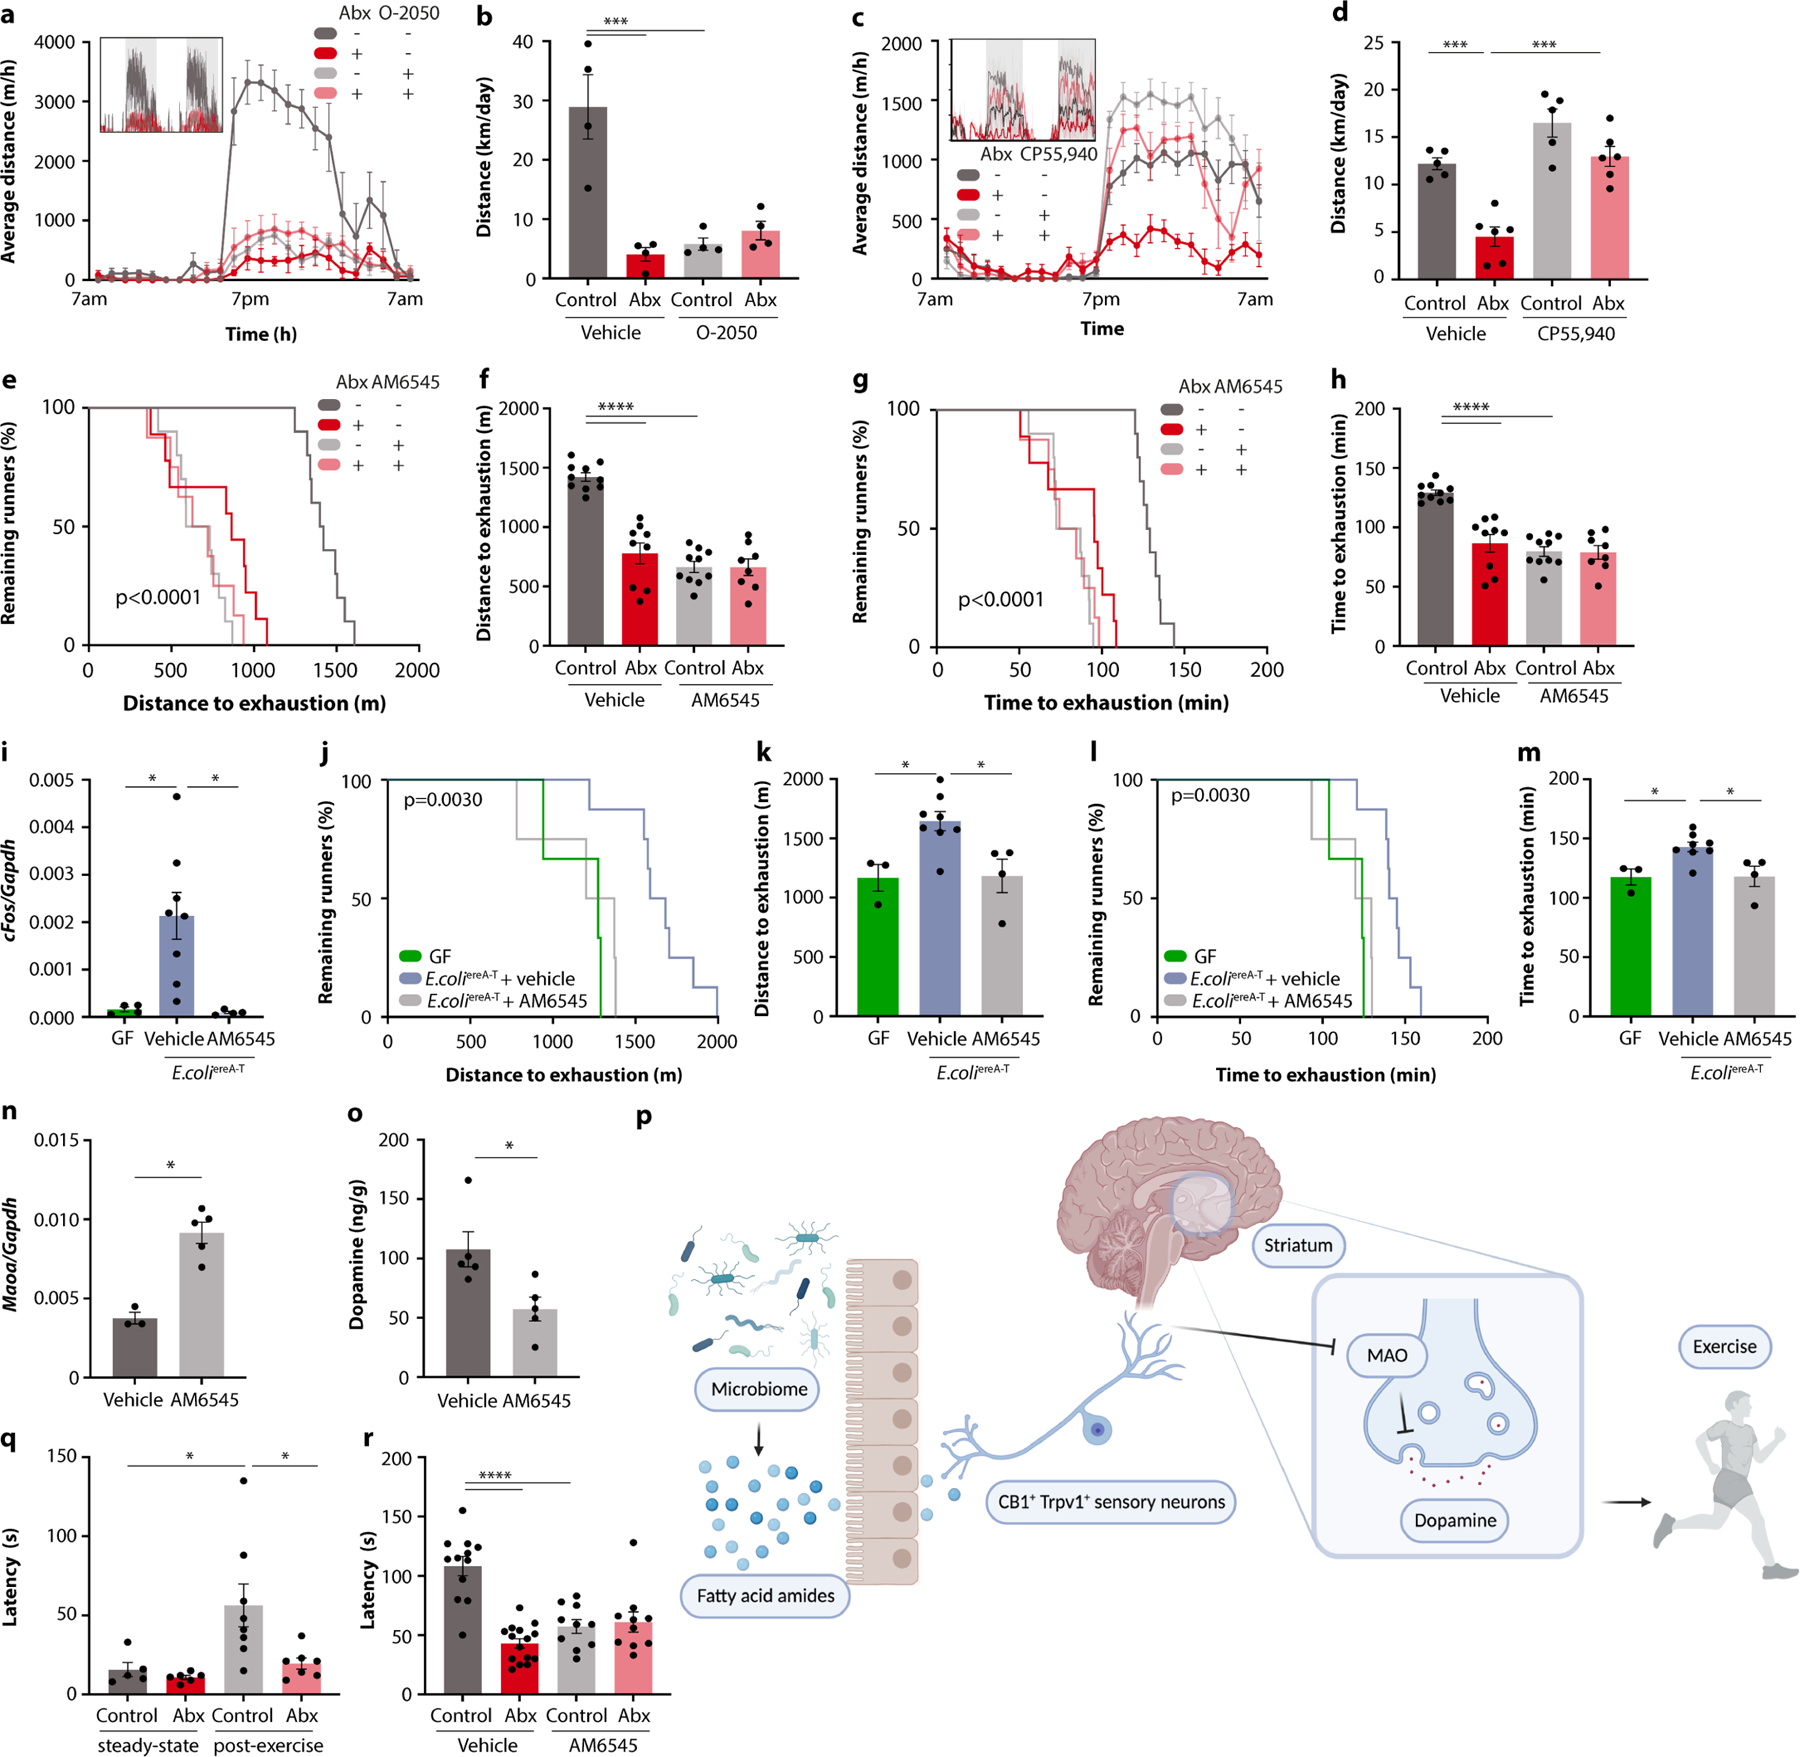
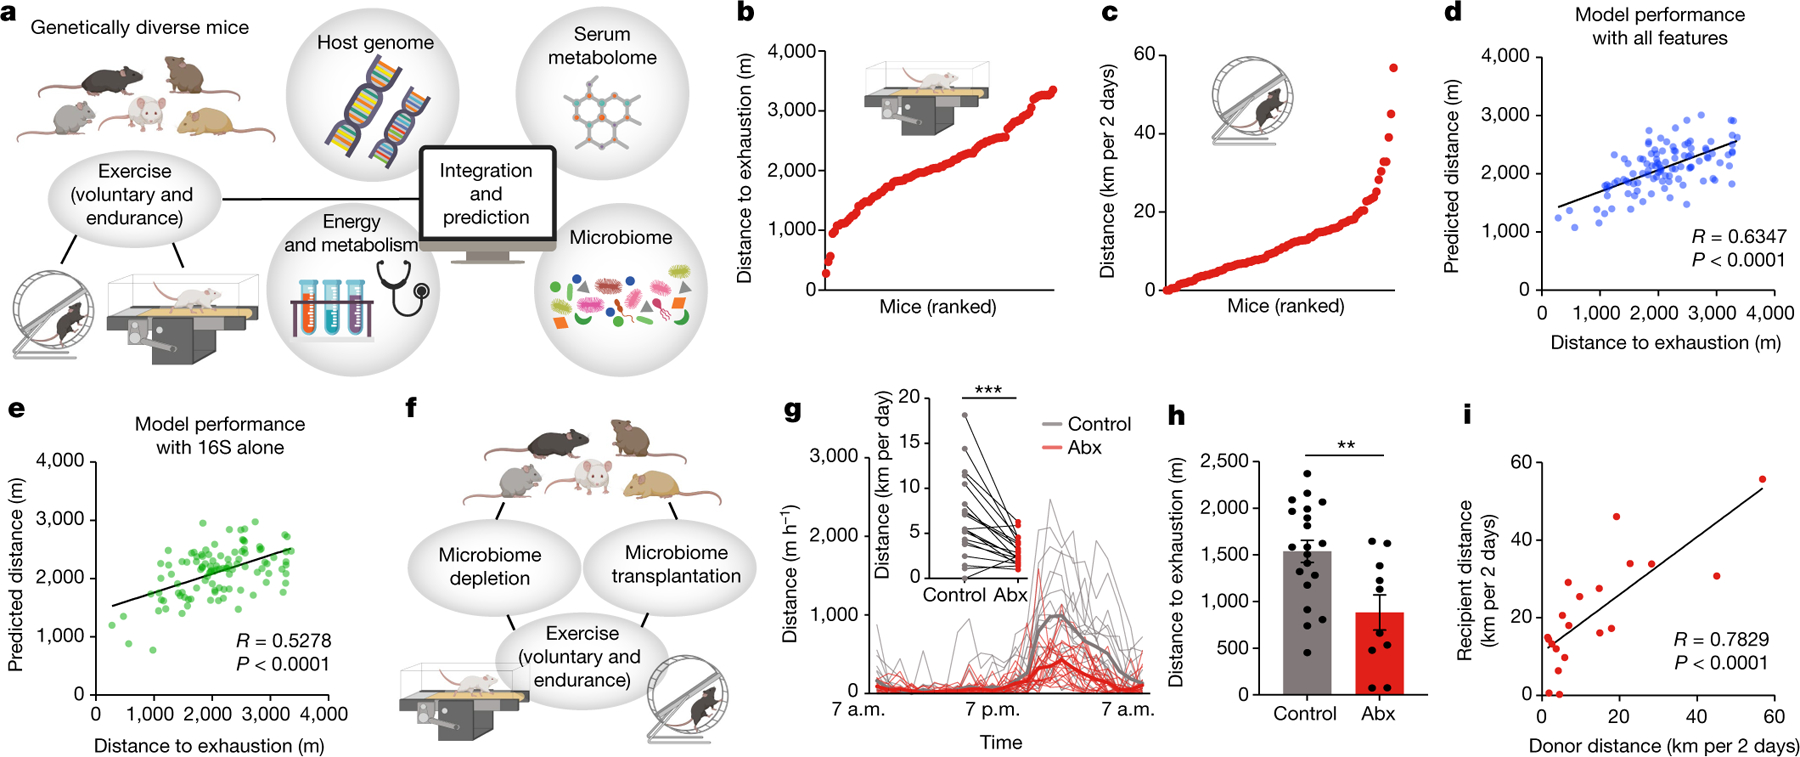
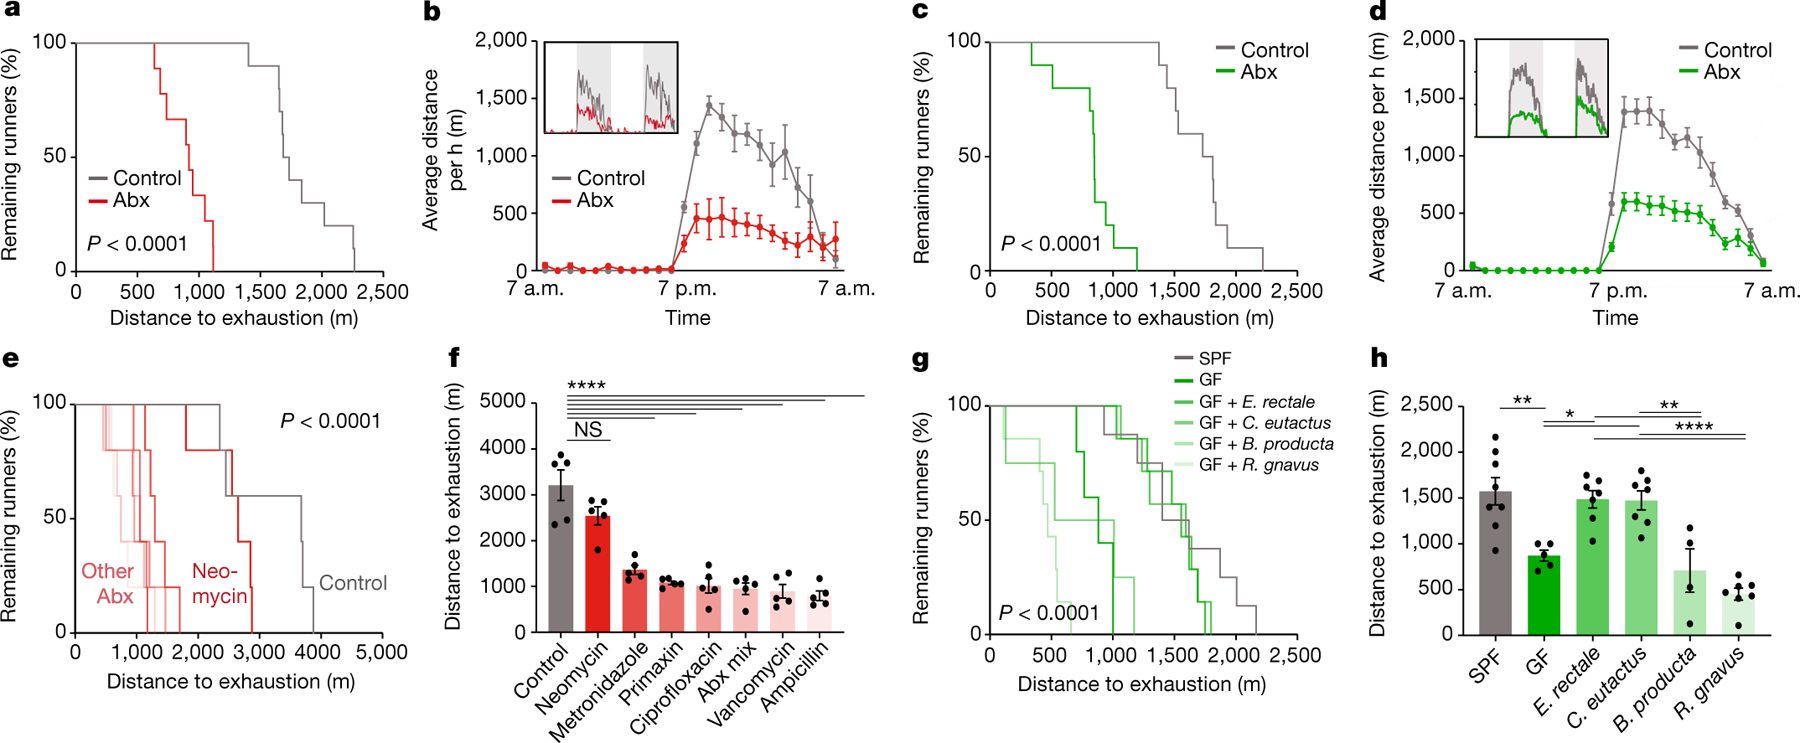
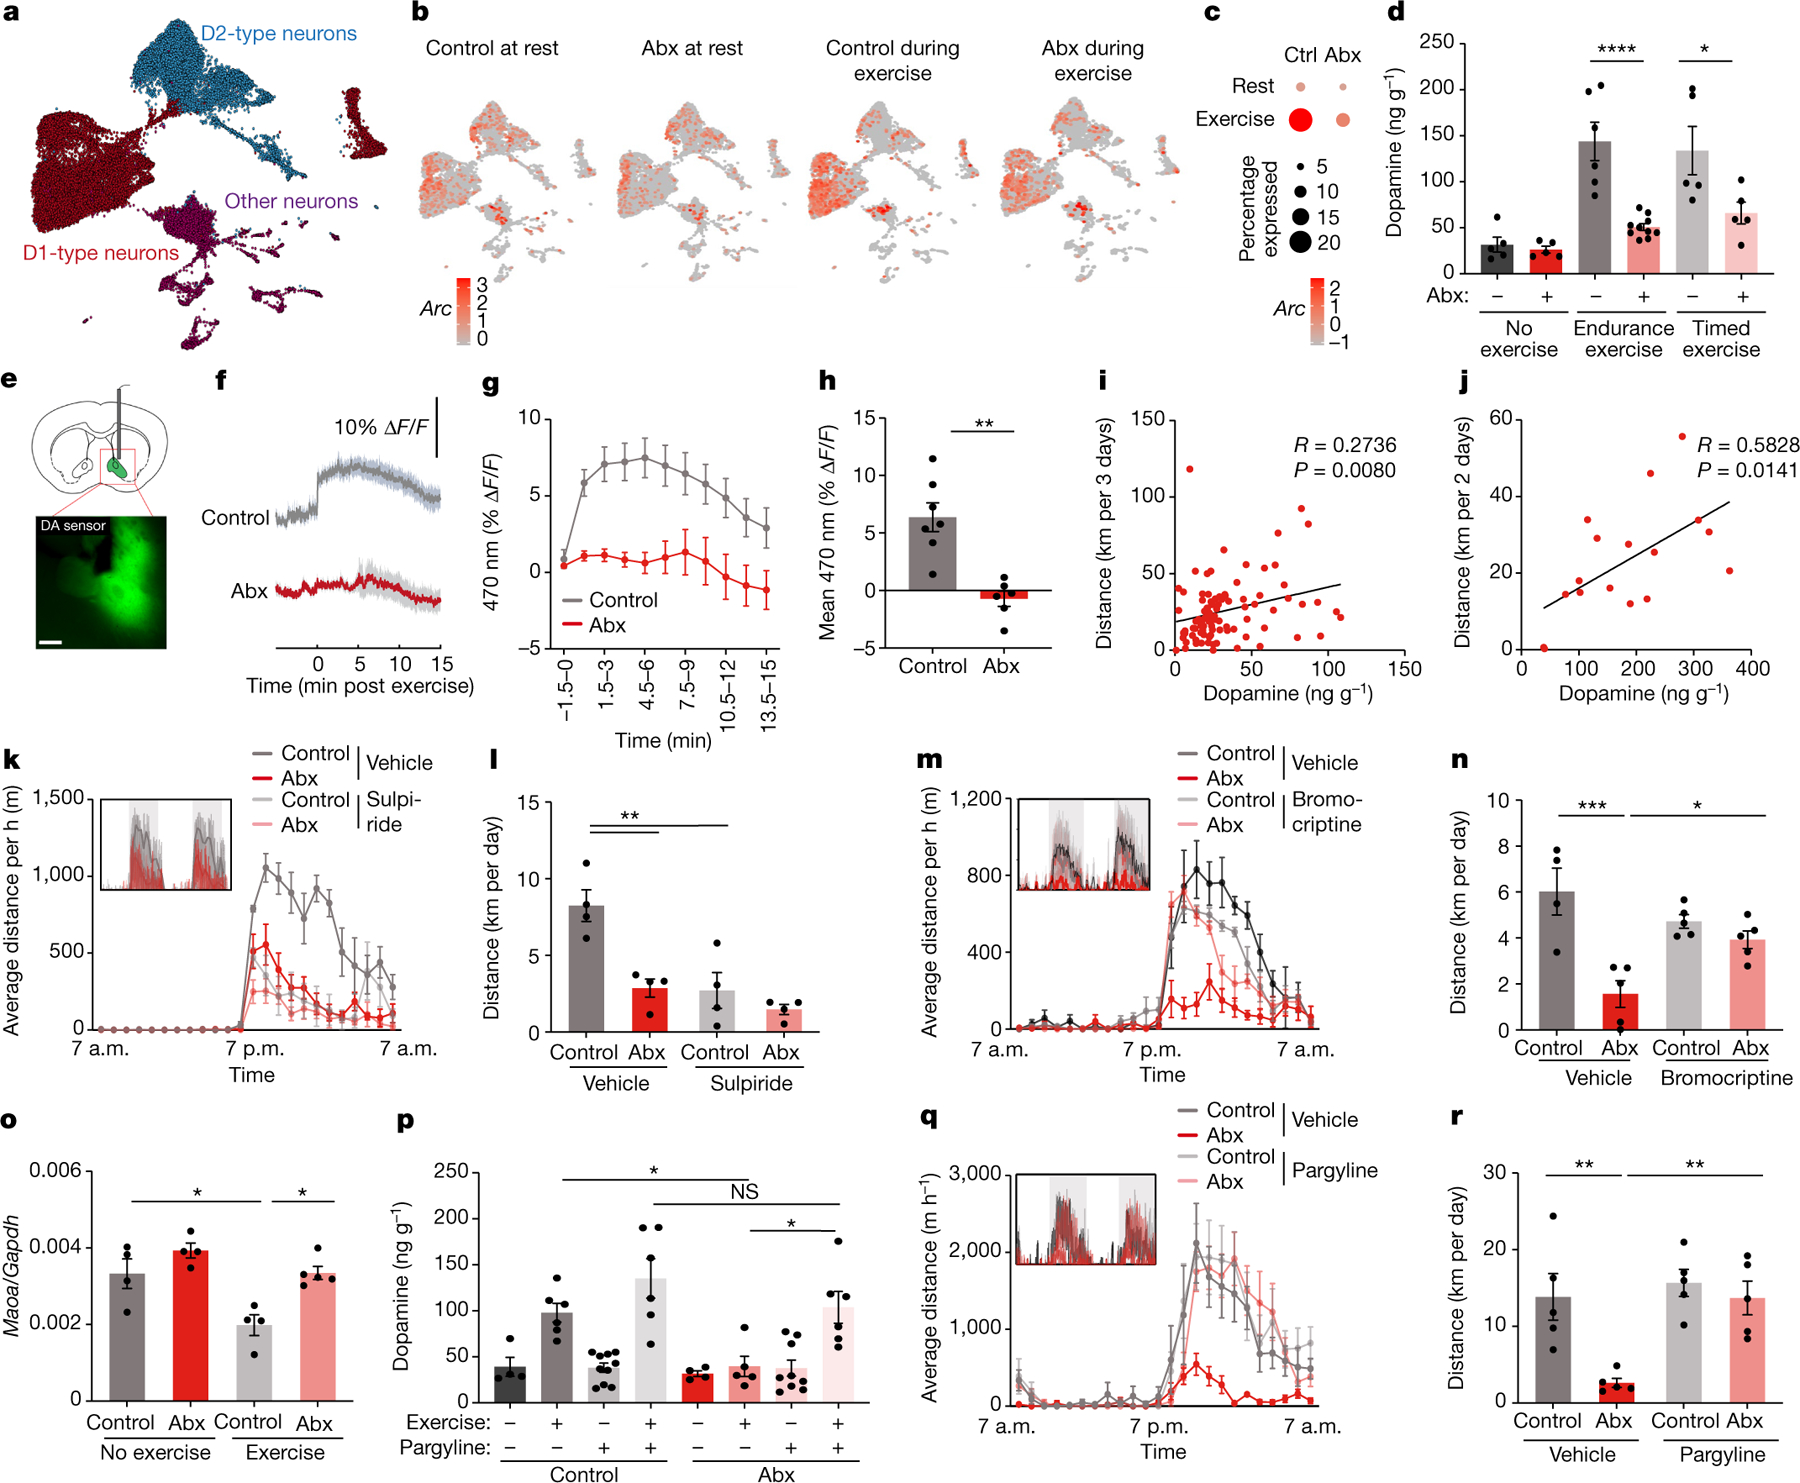
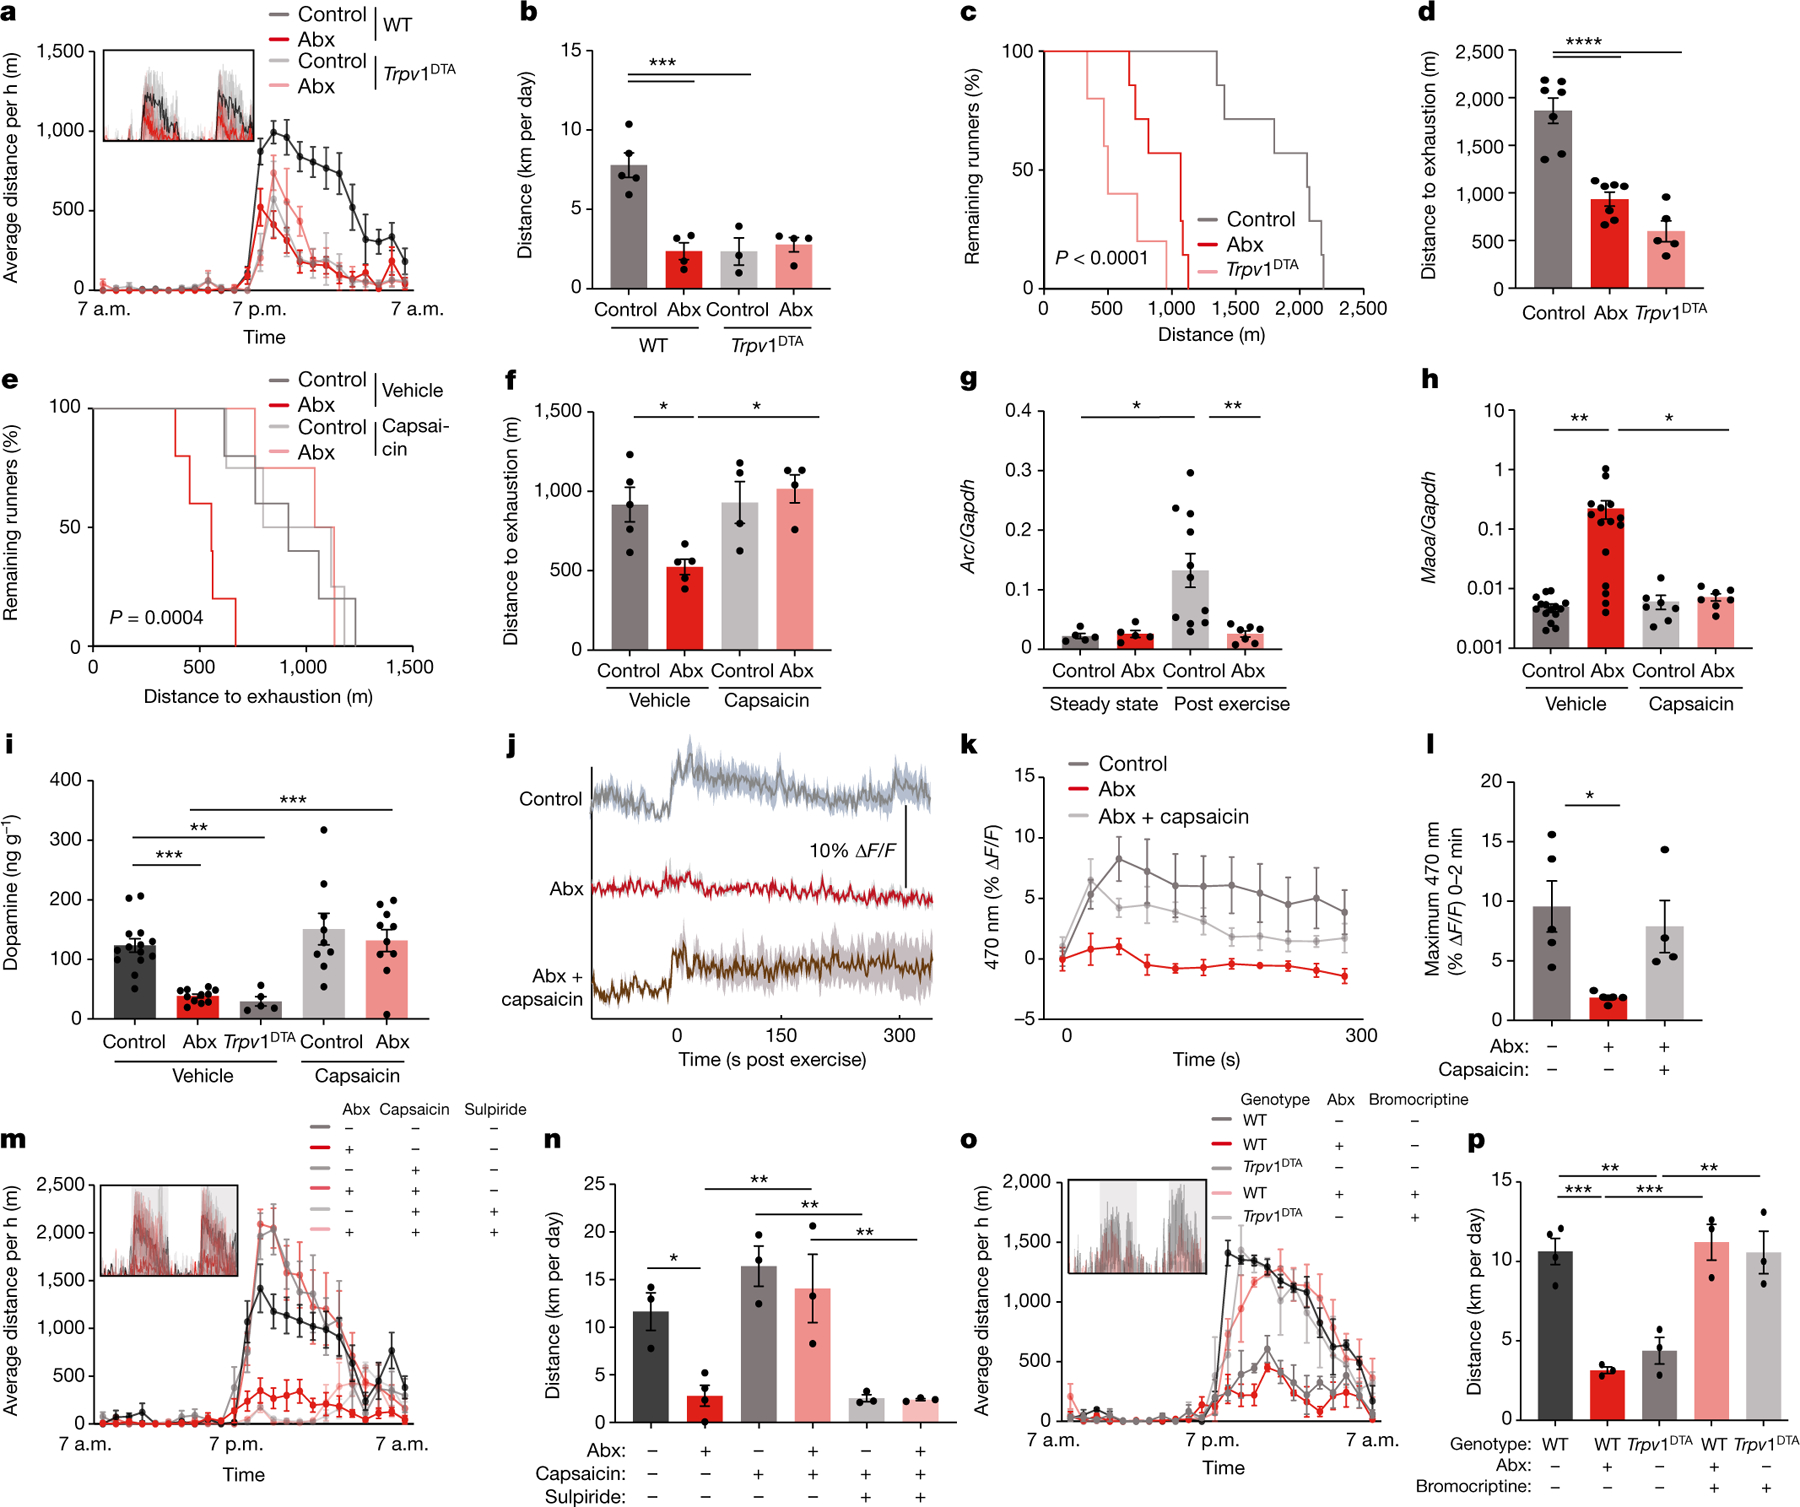
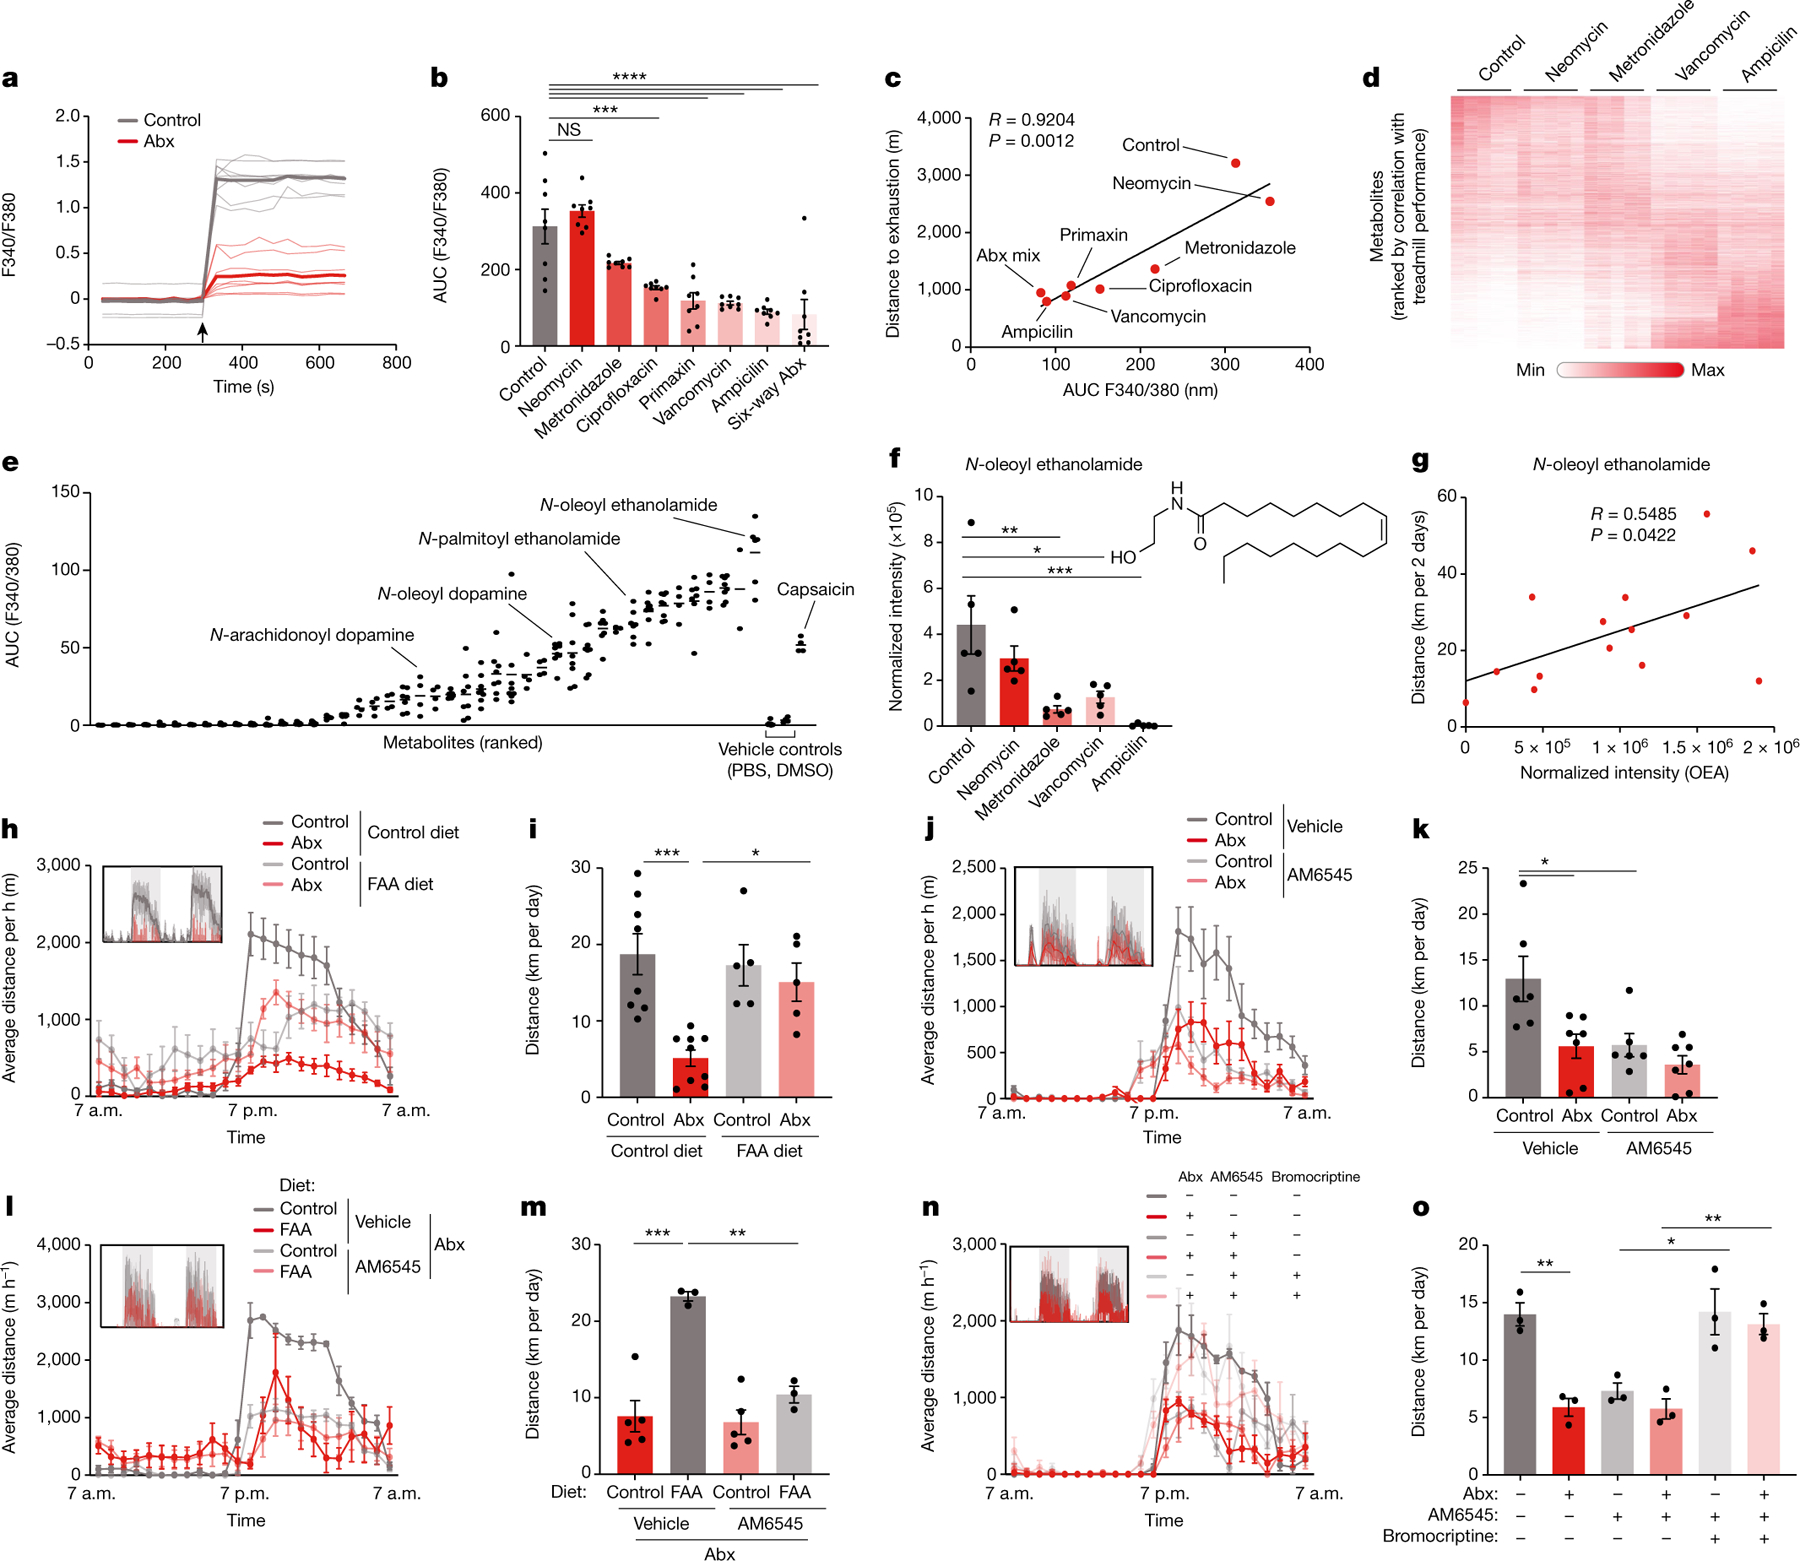
Exercise exerts a wide range of beneficial effects for healthy physiology1. However, the mechanisms regulating an individual's motivation to engage in physical activity remain incompletely understood. An important factor stimulating the engagement in both competitive and recreational exercise is the motivating pleasure derived from prolonged physical activity, which is triggered by exercise-induced neurochemical changes in the brain. Here, we report on the discovery of a gut-brain connection in mice that enhances exercise performance by augmenting dopamine signalling during physical activity. We find that microbiome-dependent production of endocannabinoid metabolites in the gut stimulates the activity of TRPV1-expressing sensory neurons and thereby elevates dopamine levels in the ventral striatum during exercise. Stimulation of this pathway improves running performance, whereas microbiome depletion, peripheral endocannabinoid receptor inhibition, ablation of spinal afferent neurons or dopamine blockade abrogate exercise capacity. These findings indicate that the rewarding properties of exercise are influenced by gut-derived interoceptive circuits and provide a microbiome-dependent explanation for interindividual variability in exercise performance. Our study also suggests that interoceptomimetic molecules that stimulate the transmission of gut-derived signals to the brain may enhance the motivation for exercise.


Figures

Extended Data Fig. 1 |
Extended Data Fig. 1 |. Prediction of exercise performance in diversity-outbred mice.
a, Ranking of diversity-outbred (DO) mice by time spent on treadmill until exhaustion. b, Wheel turn recording of DO mice over two consecutive days. c, Kinship matrix of DO mice. d, GWAS for time spent on treadmill during endurance exercise of DO mice. d, (D) Heritability (h2) calculated for distance, time, and energy spent on treadmills. f, Classification of serum metabolomes of DO mice. g, Taxonomies based on 16S rDNA sequencing of DO mice. h-o, Recording traces (h, j, l, n) and quantification (i, k, m, o) of horizontal movement (h, i), respiratory exchange ratio ( j, k), energy expenditure (l, m), and food intake (n, o) of DO mice. p, q, Algorithm-predicted versus measured treadmill time (p) and energy (q) based on a model including all assessed non-genetic features. r, Explained variability for “metagroups” of non-genetic variables used for prediction. s-w, Algorithm-predicted versus measured treadmill distance (s), time (t, v), and energy (u, w) based on a model including the serum metabolome (s-u), and microbiota features (v, w). x-z, Correlation of food intake (x), energy expenditure (y), and spontaneous locomotion (z) with treadmill distance. Error bars indicate means ± SEM. Exact n and p-values are presented in Supplementary Table 2.
Extended Data Fig. 2 |
Extended Data Fig. 2 |. The microbiome impact on exercise performance.
a, Ranked plot of treadmill distance of DO mice, with and without antibiotic (Abx) treatment. b-d, Kaplan-Meier plots for distance (b) and time (c) to exhaustion, and time quantification (d) for treadmill exercise of DO mice, with and without Abx treatment. e-h, Quantifications (e, g, h) and Kaplan-Meier plot (f) of treadmill distance (e), time (f, g) and energy (h) of antibiotics (Abx)-treated female mice. i, Wheel running quantification of Abx-treated mice. j-m, Quantifications ( j, l, m) and Kaplan-Meier plot (k) of treadmill distance ( j), time (k, l) and energy (m) of germ-free (GF) mice. n, Wheel running quantification of GF mice. o-s, Kaplan-Meier plots (o, q) and quantifications (p, r, s) of treadmill distance (o, p), time (q, r) and energy (s) of Abx-treated male mice. t-w, Kaplan-Meier plots (t, v) and quantifications (u, w) of distance (t, u) and time (v, w) on treadmill of Abx-treated mice or mice after Abx cessation (ex-Abx). x-aa, Kaplan-Meier plots (x, z) and quantifications (y, aa) of distance (x, y) and time (z, aa) on treadmill of GF mice and conventionalized (ex-GF) mice. Error bars indicate means ± SEM. * p < 0.05, ** p < 0.01, *** p < 0.001, **** p < 0.0001. Exact n and p-values are presented in Supplementary Table 2.
Extended Data Fig. 3 |
Extended Data Fig. 3 |. Taxonomic analysis of microbiome features associated with exercise performance.
a, b, Recording (a) and quantification (b) of free horizontal movement measured in metabolic cages for two consecutive days in Abx-treated mice and controls. c-e, Open field locomotion (c), distance quantification (d) and velocity quantification (e) of Abx-treated mice and controls. f-i, Kaplan-Meier plots (f, h) and quantifications (g, i) of distance (f, g) and time (h, i) on treadmill of mice treated with either absorbable (Abs) or non-absorbable (Non-abs) antibiotics, or a broad-spectrum mixture (Abx). j-n, Body weight ( j), Kaplan-Meier plot (k) and quantification (l) of time on treadmill, averaged hourly distance (m) and quantification (n) of voluntary wheel activity of mice treated with the indicated antibiotics. Inset shows representative recording traces. o-s, Kaplan-Meier plots (o, q), and quantifications (p, r, s) of treadmill distance (o, p), time (q, r) and energy (s) of GF mice colonized with microbiome samples from conventional (SPF), neomycin-treated (Neo) or ampicillin-treated (Amp) mice. t, Phylum-level taxonomic microbiome composition of neomycin- and ampicillin-treated mice. u, SHAP-value ranking of all microbiota features contributing to prediction of exercise performance in DO mice. v, w, Relative abundance of Erysipelotrichaceae in neomycin- and ampicillin-treated mice (v) and GF mice receiving their microbiome samples (w). x-aa, Bacterial load (x), taxonomic composition (y), treadmill distance, Kaplan-Meier plot (z) and quantification (aa) of SPF mice, GF mice, and GF mice mono-colonized with the indicated bacterial species. Error bars indicate means ± SEM. * n.s. not significant, * p < 0.05, ** p < 0.01, *** p<0.001, **** p < 0.0001. Exact n and p-values are presented in Supplementary Table 2.
Extended Data Fig. 4 |
Extended Data Fig. 4 |. The impact of the microbiome on muscle physiology.
a-d, Weight of soleus (a), gastrocnemius (b), tibilias anterior (c), and extensor digitorum longus (EDL) muscles in Abx-treated mice and controls. e, f, Grip strength of Abx-treated mice and controls before (e) and after (f) exercise. g-j, Maximum twitch (g), tetanic force (h), specific twitch force (i), and specific tetanic force ( j) of EDL muscle from Abx-treated mice and controls. k-n, Decrease in power (k) and specific muscle force (l), force recovery over time (m) and force recovery quantification (n) of EDL muscle from Abx-treated mice and controls. o, EDL muscle cross-sectional area in Abx-treated mice and controls. p, q, Quantification of oxidative phosphorylation and fatty acid oxidation of isolated mitochondria (p) and whole cell lysates (q) from EDL muscle obtained from either Abx-treated mice or controls. r, s, PCA plot (r) and heatmap of selected genes (s) from EDL transcriptomes obtained from Abx-treated mice and controls. NMJ, neuro-muscular junction. Error bars indicate means ± SEM. ** p < 0.01. Exact n and p-values are presented in Supplementary Table 2.
Extended Data Fig. 5 |
Extended Data Fig. 5 |. Single-nucleus sequencing of the striatum.
a, UMAP clustering of all cell types identified in the striatum. b-h, Feature plots for each cluster-identifying marker. i, UMAP of neuronal subcluster showing expression of Drd1 and Drd2. j, k, UMAP plots ( j) and quantification (k) of Fos expression in striatal neurons from control and Abx-treated mice before and during exercise.
Extended Data Fig. 6 |
Extended Data Fig. 6 |. The role of microbiome-mediated dopamine responses in exercise performance.
a, Schematic depicting in vivo fibre photometry of dopamine sensor fluorescence in the nucleus accumbens of mice during treadmill running. b-d, Fibre photometry recording of dopamine dynamics at the end of exercise in the ventral striatum (b), the dorsal striatum (c), and the ventral striatum after different durations of exercise (d). e, f, Glutamate (e) and acetylcholine (f) levels in the brain of Abx-treated mice and controls, at steady-state and after endurance exercise. g, Post-exercise dopamine levels in brain tissue of GF mice, and GF mice colonized with stool from SPF, neomycin- or ampicillin-treated mice. h-k, Kaplan-Meier plots (h, j) and quantifications (i, k) of distance (h, i) and time ( j, k) on treadmill of Abx-treated Slc6a3hM4Di mice, with or without CNO treatment. l, m, Averaged hourly distance (l) and quantification (m) of voluntary wheel activity of Abx-treated Slc6a3hM4Di mice, with or without CNO treatment. Inset shows representative recording traces. n-r, Schematic (n), recording traces (o), quantification (p), mean signals (q), and maximum signals (r) of fibre photometry recording from the VTA of Slc6a3-Cre mice injected with a GCamp6-expressing virus. Mice were recorded at the end of the exercise protocol. Error bars indicate means ± SEM. * p < 0.05, ** p < 0.01, *** p < 0.001, **** p<0.0001. Exact n and p-values are presented in Supplementary Table 2.
Extended Data Fig. 7 |
Extended Data Fig. 7 |. Mechanisms of microbiome-mediated control of striatal dopamine responses.
a-d, Kaplan-Meier plots (a, c) and quantifications (b, d) of distance (a, b) and time (c, d) on treadmill of Abx-treated mice, with or without leptin injection i.p. or into the VTA. e-h, Kaplan-Meier plots (e, g) and quantifications (f, h) of distance (e, f) and time (g, h) on treadmill of Abx-treated mice, with or without pargyline treatment. i, Heatmap of differentially abundant serum metabolites between Abx-treated mice and controls. j, Correlation of fold-change of serum metabolite abundance between Abx-treated mice and controls with the correlation of the same metabolites with treadmill distance in the DO cohort. k-p, Kaplan-Meier plots (k, m, o) and quantifications (l, n, p) of time (k, l, o, p) and distance (m, n) on treadmill of Trpv1DTA mice (k, l) and CNO-injected of Trpv1hM4Di mice (m-p). q, r, Averaged hourly distance (q) and quantification (r) of voluntary wheel activity of Abx-treated mice, with or without capsaicin treatment. Inset shows representative recording traces. s, t, Kaplan-Meier plot (s) and quantifications (t) time on treadmill of Abx-treated mice, with or without capsaicin treatment. Error bars indicate means ± SEM. ** p < 0.01, *** p < 0.001, **** p<0.0001. Exact n and p-values are presented in Supplementary Table 2.
Extended Data Fig. 8 |
Extended Data Fig. 8 |. The impact of exercise and the microbiome on sensory neuron activity.
a, Representative RNAScope images of dorsal root and nodose ganglia before and after exercise, with and without Abx treatment. b, Number of cFos+ cells in dorsal root ganglia before and after exercise. c, Proportion of cFos+ cells in dorsal root ganglia from exercised mice that are TRPV1+ and TRPV1. d-g, Number of TRPV1+ (d, f) and cFos+ TRPV1+ (e, g) cells in the dorsal root ganglia (d, e) and nodose ganglia (f, g) in exercised Abx-treated mice and controls. h, i, Expression of Fos (h) and Homer1 (i) in the dorsal root ganglia of sedentary and post-exercise mice, with or without Abx treatment. Error bars indicate means ± SEM. * p < 0.05, ** p < 0.01, *** p < 0.001, **** p<0.0001. Exact n and p-values are presented in Supplementary Table 2.
Extended Data Fig. 9 |
Extended Data Fig. 9 |. Contribution of spinal and vagal afferents to exercise performance.
a-d, Averaged hourly distance (a, c) and quantifications (b, d) of voluntary wheel activity of mice receiving CCK-SAP injection into the nodose ganglia (a, b) and mice with surgical resection of the celiac/superior mesenteric ganglion (CSMG) (c, d). Insets show representative recording traces. e-j, Kaplan-Meier plots (e, g, j) and quantifications (f, h, i) of distance (e, f), time (g, h), and energy (I, j) spent on treadmills by mice with surgical resection of the CSMG. k, l, Expression of Maoa (k) and dopamine levels in the striatum (l) after exercise of mice with surgical resection of the CSMG. m, Mean dopamine indicator signal in post-exercise Abx-treated mice, with or without capsaicin treatment. n, Correlation of striatal dopamine levels with distance in running wheels of Trpv1DTA mice, Abx-treated mice, and controls, with or without capsaicin treatment. o, Quantification of calcium imaging of DRG neurons exposed to stool filtrates from Abx-treated mice and controls. p, q, Recording traces (p) and quantification (q) of calcium imaging of DRG neurons exposed to stool filtrates from GF mice and controls. Arrow indicates treatment time. r-u, Recording traces (r), quantification (s), correlation with wheel running (t), and correlation with post-exercise dopamine levels in the striatum (u) of calcium imaging of DRG neurons exposed to stool filtrates from DO mice. Arrow indicates treatment time. v, w, Recording traces of calcium imaging of DRG neurons exposed to stool filtrates from mice treated with different Abx (v) and to individual metabolites (w). Arrow indicates treatment time. x, y, Recording traces (x) and quantification (y) of calcium imaging of DRG neurons exposed to oleoylethanolamide (OEA) or capsaicin. Error bars indicate means ± SEM. * p < 0.05, ** p < 0.01, *** p<0.001, **** p<0.0001. Exact n and p-values are presented in Supplementary Table 2.
Extended Data Fig. 10 |
Extended Data Fig. 10 |. Dietary supplementation of fatty acid amides enhances exercise performance.
a-f, Averaged recording traces (a, c, e) and quantifications (b, d, f) of calcium imaging of DRG neurons exposed to individual metabolites (a, b), a fatty acid amide (FAA)-supplemented diet (c, d), or stool extracts from mice fed a FAA-supplemented diet (e, f). g-l, Post-exercise expression of Arc and Fos in DRGs (g, h), post-exercise expression of Maoa and dopamine levels in the striatum (I, j), and Kaplan-Meier plot and quantification of distance on treadmill (k, l) by Abx-treated mice and control, fed a FAA-supplemented or control diet. m-o, Wheel running of Abx-treated DO mice, fed a FAA-supplemented or control diet. p, q, Schematic (p) and striatal dopamine levels (q) of Abx-treated mice receiving gastric infusion of FAA, with or without treadmill exercise. Error bars indicate means ± SEM. ** p < 0.01, *** p < 0.001, **** p < 0.0001. Exact n and p-values are presented in Supplementary Table 2.
Extended Data Fig. 11 |
Extended Data Fig. 11 |. Microbiome engineering to enhance fatty acid amide production and exercise performance.
a, OEA levels in GF mice and GF mice mono-colonized with Coprococcus eutactus. b, Schematic of generation of Escherichia coli expressing the ereA-T gene cluster from Eubacterium rectale. c, OEA levels in GF mice and GF mice mono-colonized with either E. coliereA−T or the empty vector-containing strain E. coliWT. d, e, Averaged recording traces (d) and quantification (e) of calcium imaging of DRG neurons exposed to in stool extracts from GF mice and GF mice mono-colonized with either E. coliereA−T or E. coliWT. f, g, Averaged hourly distance (f) and quantification (g) of voluntary wheel activity of GF mice and GF mice mono-colonized with either E. coliereA−T or E. coliWT. Inset shows representative recording traces. h-k, Kaplan-Meier plots (h, j) and quantifications (i, k) of distance (h, i) and time ( j, k) on treadmills by GF mice and GF mice mono-colonized with either E. coliereA−T or E. coliWT. l, m, UMAP plot of all cell types identified in DRGs (l) and expression of Trpv1 and Cnr1 (m). n-p, Expression of Arc (n) and Fos (o) in the dorsal root ganglia, and dopamine levels in the striatum (p) of exercised Cnr1-deficient mice and controls. q, r, Averaged hourly distance (q) and quantification (r) of voluntary wheel activity of Cnr1-deficient mice and controls. Inset shows representative recording traces. s, t, Kaplan-Meier plot (s) and quantification (t) of distance on treadmills by Cnr1-deficient mice and controls. Error bars indicate means ± SEM. * p < 0.05, ** p < 0.01, **** p < 0.0001. Exact n and p-values are presented in Supplementary Table 2.
Extended Data Fig. 12 |
Extended Data Fig. 12 |. Stimulation of peripheral endocannabinoid receptors drives exercise performance.
a-d, Averaged hourly distance (a, c) and quantifications (b, d) of voluntary wheel activity of Abx-treated mice and controls, with or without treatment with the CB1 inhibitor O-2050 (a, b) or the CB1 agonist CP55,940 (c, d). Insets show representative recording traces. e-h, Kaplan-Meier plots (e, g) and quantifications (f, h) of distance (e, f) and time (g, h) on treadmills by Abx-treated mice and controls, with or without treatment with the peripheral CB1 inhibitor AM6545. i-m, Fos expression in DRGs (i), Kaplan-Meier plots ( j, l) and quantifications (k, m) of distance ( j, k) and time (l, m) on treadmills by GF mice and GF mice mono-colonized with E. coliereA−T, with and without AM6545 treatment. n, o, Expression of Maoa (n) and dopamine levels in the striatum (o) of AM6545-treated mice after treadmill exercise. p, Schematic of pathway model linking the intestinal microbiome to exercise performance. q, r, Latency to paw withdrawal on a hot plate by Abx-treated mice and controls before and after exercise (q) and after exercise, with and without AM6545 treatment (r). Error bars indicate means ± SEM. * p < 0.05, *** p < 0.001, **** p < 0.0001. Exact n and p-values are presented in Supplementary Table 2.
Fig. 1 |
Fig. 1 |. The impact of the intestinal microbiome on exercise performance in genetically and metagenomically diverse mice.
a, DO mice were profiled for genome, microbiome, metabolome and energy metabolism and assessed for exercise performance. b,c, Diversity of performance parameters on a treadmill (b) and running wheels (c). d,e, Algorithm-predicted versus measured treadmill distance based on a model including all assessed non-genetic features (d) and only features from 16S rDNA sequencing (e). f, Schematic of interventions to test for microbiome causality in DO mice. g,h, Wheel (g) and treadmill (h) running of DO mice treated with antibiotics (Abx). i, Correlation of treadmill running by donors and recipients of microbiome transfers from DO mice to germ-free mice. Error bars indicate means ± s.e.m. **, P < 0.01; ***, P < 0.001. Exact n and P values are presented in Supplementary Table 2.
Fig. 2 |
Fig. 2 |. Members of the microbiota contributing to exercise performance.
a, Kaplan–Meier plot of distance on treadmill of broad-spectrum antibiotic (Abx)-treated mice and controls. b, Averaged hourly distance of voluntary wheel activity of Abx mice and controls. Inset shows representative recording traces. c, Kaplan–Meier plot of distance on treadmill of germ-free (GF) mice and controls. d, Averaged hourly distance of voluntary wheel activity of GF mice and controls. Inset shows representative recording traces. e,f, Kaplan–Meier plot (e) and quantification (f) of distance on treadmill of mice treated with the indicated antibiotics. g,h, Kaplan–Meier plot (g) and quantification (h) of distance on treadmill of SPF mice, GF mice and GF mice mono-colonized with the indicated bacterial species. Error bars indicate means ± s.e.m. NS, not significant; *, P < 0.05; **, P < 0.01; ****, P < 0.0001. Exact n and P values are presented in Supplementary Table 2.
Fig. 3 |
Fig. 3 |. The microbiome impacts exercise-induced dopamine responses in the striatum.
a, Uniform Manifold Approximation and Projection (UMAP) plot of neurons from single-nucleus RNA-seq of the striata of control and Abx-treated mice before and during exercise. b,c, UMAP plots (b) and quantification (c) of Arc expression in striatal neurons from control and Abx-treated mice before and during exercise. d, Dopamine levels in the brains of Abx-treated mice and controls, at steady state, after exhaustion from endurance exercise and after 60 min of timed exercise. eh, Schematic (e), recording traces (f), quantification (g) and mean signals (h) of fibre photometry recording of a dopamine sensor injected into the nucleus accumbens. Mice were recorded at the end of the exercise protocol. i,j, Correlation of striatal dopamine concentration and distance ran in voluntary exercise by DO mice (i) and germ-free recipients of microbiota samples from DO mice ( j). kn, Averaged hourly distance (k,m) and quantification (l,n) of voluntary wheel activity of Abx-treated mice injected with sulpiride (k,l) or bromocriptine (m,n). Insets show representative recording traces. o, Expression of Maoa in the striatum before and after exercise in control and Abx-treated mice. p, Dopamine levels in the brain of Abx-treated and control mice, both steady state and post-exercise, injected intraperitoneally with vehicle or the MAO inhibitor pargyline. q,r, Averaged hourly distance (q) and quantification (r) of voluntary wheel activity of Abx-treated mice injected with the MAO inhibitor pargyline. Inset shows representative recording traces. Error bars indicate means ± s.e.m. *, P < 0.05; **, P < 0.01; ***, P < 0.001; ****, P < 0.0001. Exact n and P values are presented in Supplementary Table 2.
Fig. 4 |
Fig. 4 |. The microbiome influences exercise performance via afferent sensory neurons.
a,b, Averaged hourly distance (a) and quantification (b) of voluntary wheel activity of wild-type (WT) and Trpv1DTA mice, with and without Abx treatment. Inset shows representative recording traces. c,d, Kaplan–Meier plot (c) and quantification (d) of distance on treadmill of controls, Abx-treated mice and Trpv1DTA mice. e,f, Kaplan–Meier plot (e) and quantification (f) of treadmill distance of Abx-treated mice and controls, with or without capsaicin treatment. g, Expression of Arc in the DRG of sedentary and post-exercise mice, with or without Abx treatment. h, Expression of Maoa in the striatum of post-exercise Abx-treated and control mice, with or without capsaicin treatment. i, Dopamine levels in the brain of control mice, Abx-treated mice and Trpv1DTA mice, with or without capsaicin treatment. jl, Recording traces ( j), quantification (k) and maximal signals (l) of post-exercise Abx-treated mice and controls, with or without capsaicin treatment. m,n, Averaged hourly distance (m) and quantification (n) of voluntary wheel activity of Abx-treated mice and controls, with or without capsaicin and sulpiride treatment. o,p, Averaged hourly distance (o) and quantification (p) of voluntary wheel activity of Abx-treated and Trpv1DTA mice, with or without bromocriptine treatment. Insets show representative recording traces. Error bars indicate means ± s.e.m. *, P < 0.05; **, P < 0.01; ***, P < 0.001; ****, P < 0.0001. Exact n and P values are presented in Supplementary Table 2.
Fig. 5 |
Fig. 5 |. Peripheral endocannabinoids drive exercise performance.
a, Recording traces of calcium imaging of DRG neurons exposed to stool filtrates from Abx-treated mice and controls. Arrow indicates treatment time. b,c, Quantification (b) and correlation with treadmill distance (c) of calcium imaging of DRG neurons exposed to stool filtrates from mice treated with different Abx. Arrow indicates treatment time. d, Heatmap of metabolites detected in caecal contents from mice treated with different Abx. e, Quantifications of calcium imaging of DRG neurons exposed to individual metabolites. f, Normalized abundance of OEA in caecal contents from mice treated with different Abx. g, Correlation between OEA abundance and wheel running in DO mice. ho, Averaged hourly distance (h,j,l,n) and quantification (i,k,m,o) of voluntary wheel activity of Abx mice and controls, fed a FAA-supplemented or control diet (h,i,l,m), with or without treatment with the peripheral CB1 antagonist AM6545 ( jo) and the dopamine receptor agonist bromocriptine (n,o). Insets show representative recording traces. Error bars indicate means ± s.e.m. *, P < 0.05; ** P < 0.01; *** P < 0.001; ****, P < 0.0001. Exact n and P values are presented in Supplementary Table 2.

Comment in

References

    1. Neufer PD et al. Understanding the cellular and molecular mechanisms of physical activity-induced health benefits. Cell Metab. 22, 4–11 (2015). - PubMed
    1. Hawley JA, Hargreaves M, Joyner MJ & Zierath JR Integrative biology of exercise. Cell 159, 738–749 (2014). - PubMed
    1. Churchill GA, Gatti DM, Munger SC & Svenson KL The diversity outbred mouse population. Mamm. Genome 23, 713–718 (2012). - PMC - PubMed
    1. Kelly SA & Pomp D Genetic determinants of voluntary exercise. Trends Genet. 29, 348–357 (2013). - PMC - PubMed
    1. Scheiman J et al. Meta-omics analysis of elite athletes identifies a performance-enhancing microbe that functions via lactate metabolism. Nat. Med. 25, 1104–1109 (2019). - PMC - PubMed

Publication types

MeSH terms