. 2022 Dec;612(7941):795-801.
doi: 10.1038/s41586-022-05530-2. Epub 2022 Dec 14.

Structural insights into the mechanism of the sodium/iodide symporter

Affiliations

Structural insights into the mechanism of the sodium/iodide symporter

Silvia Ravera et al. Nature. 2022 Dec.

Abstract

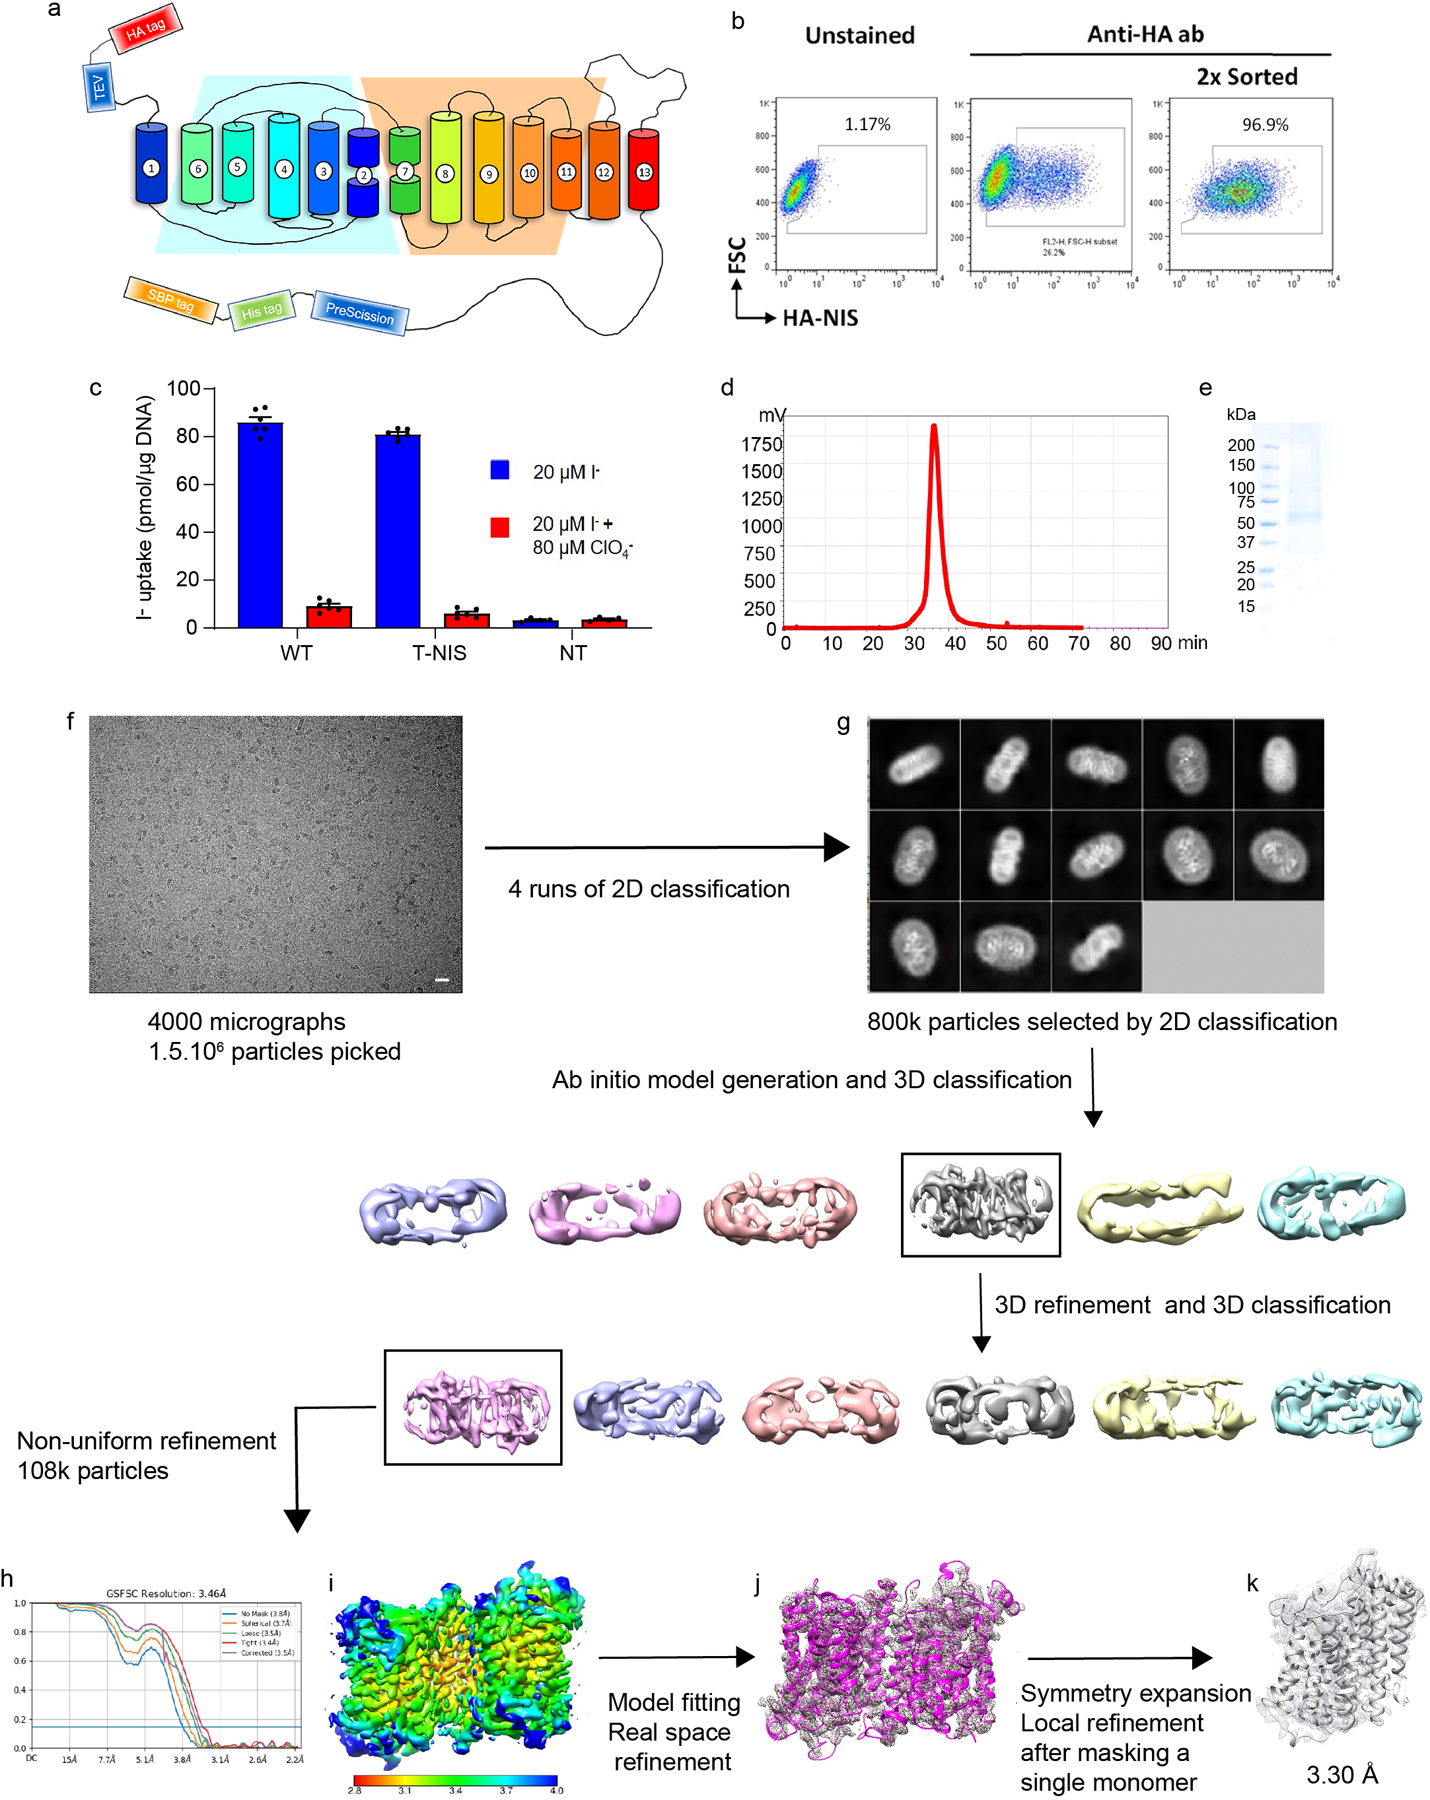
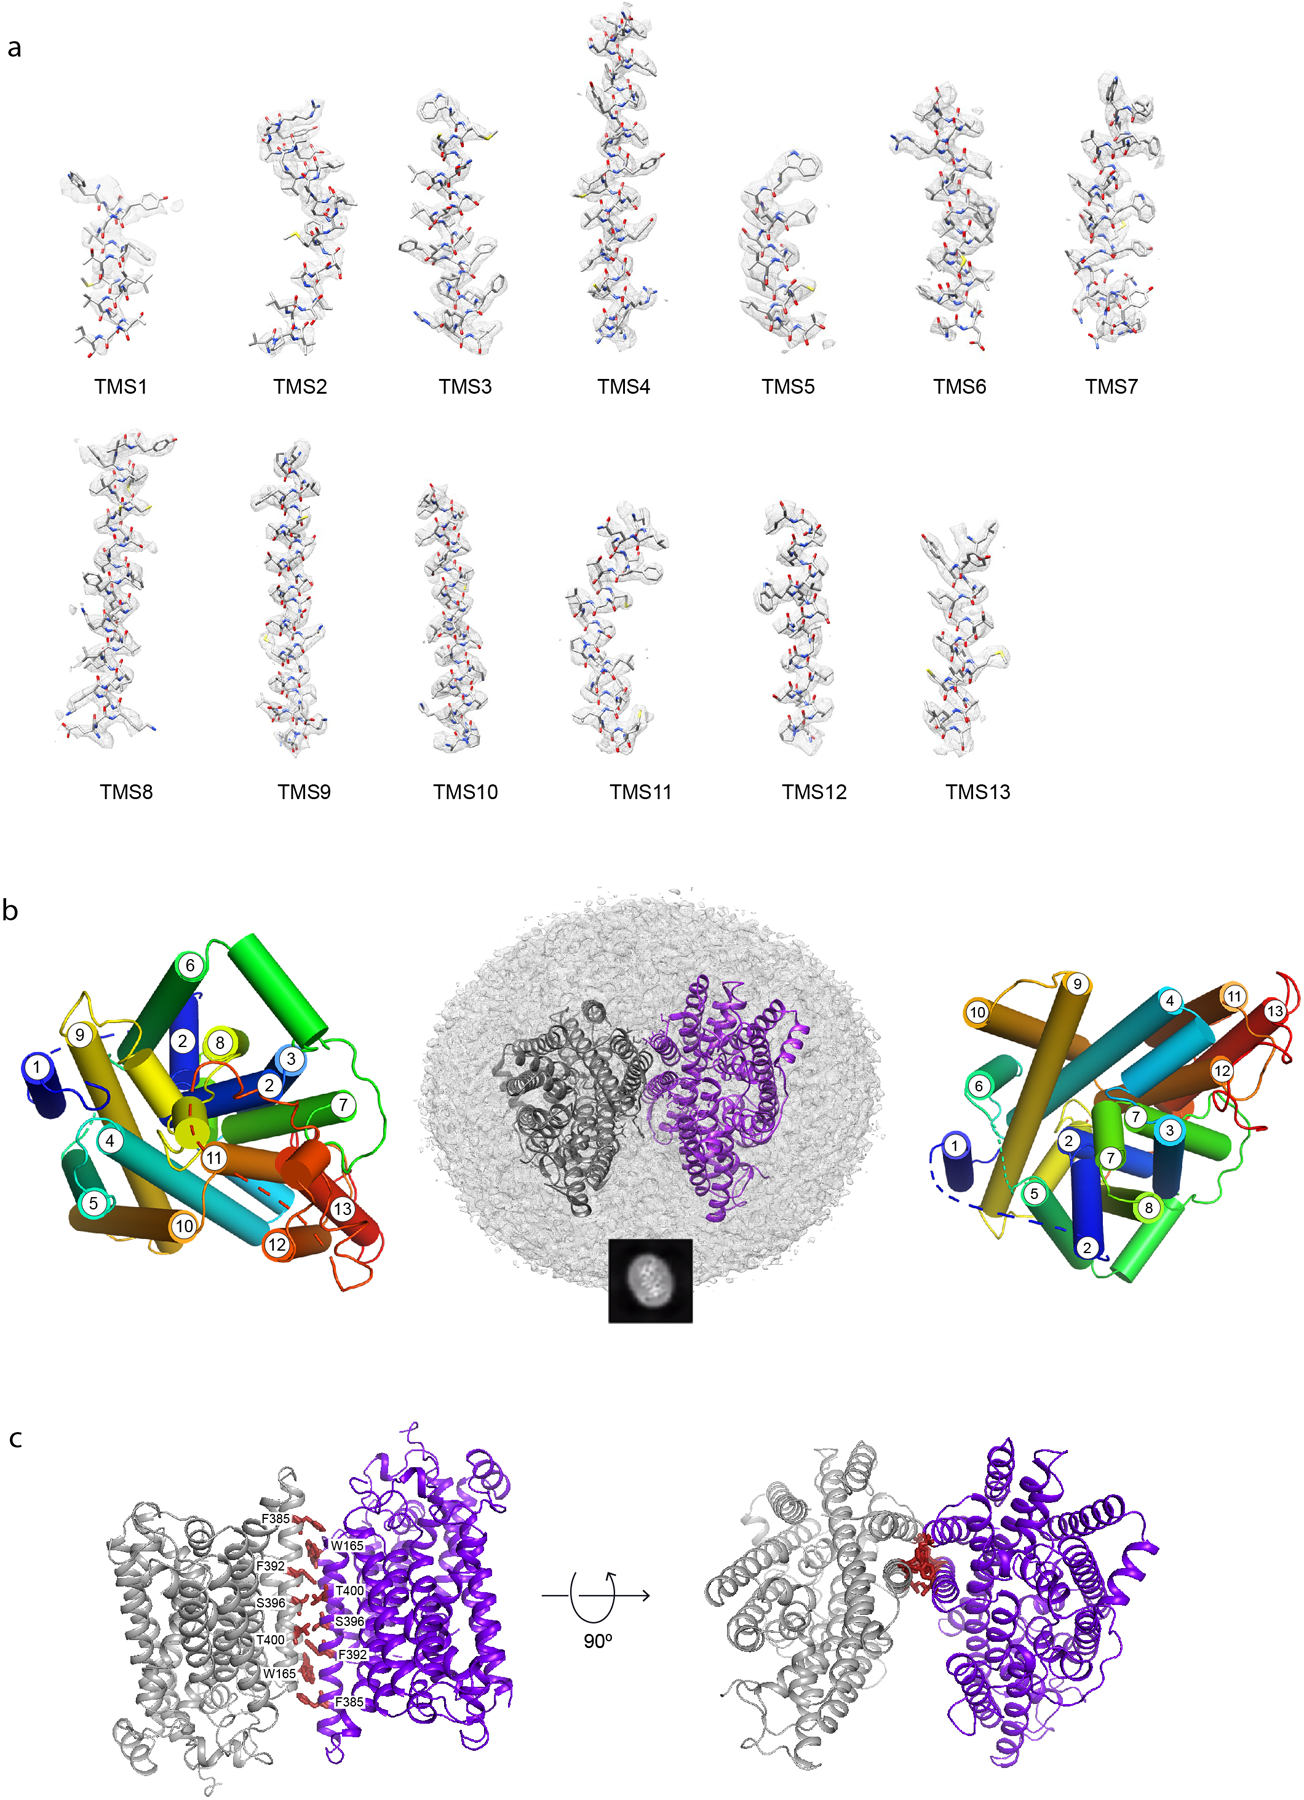
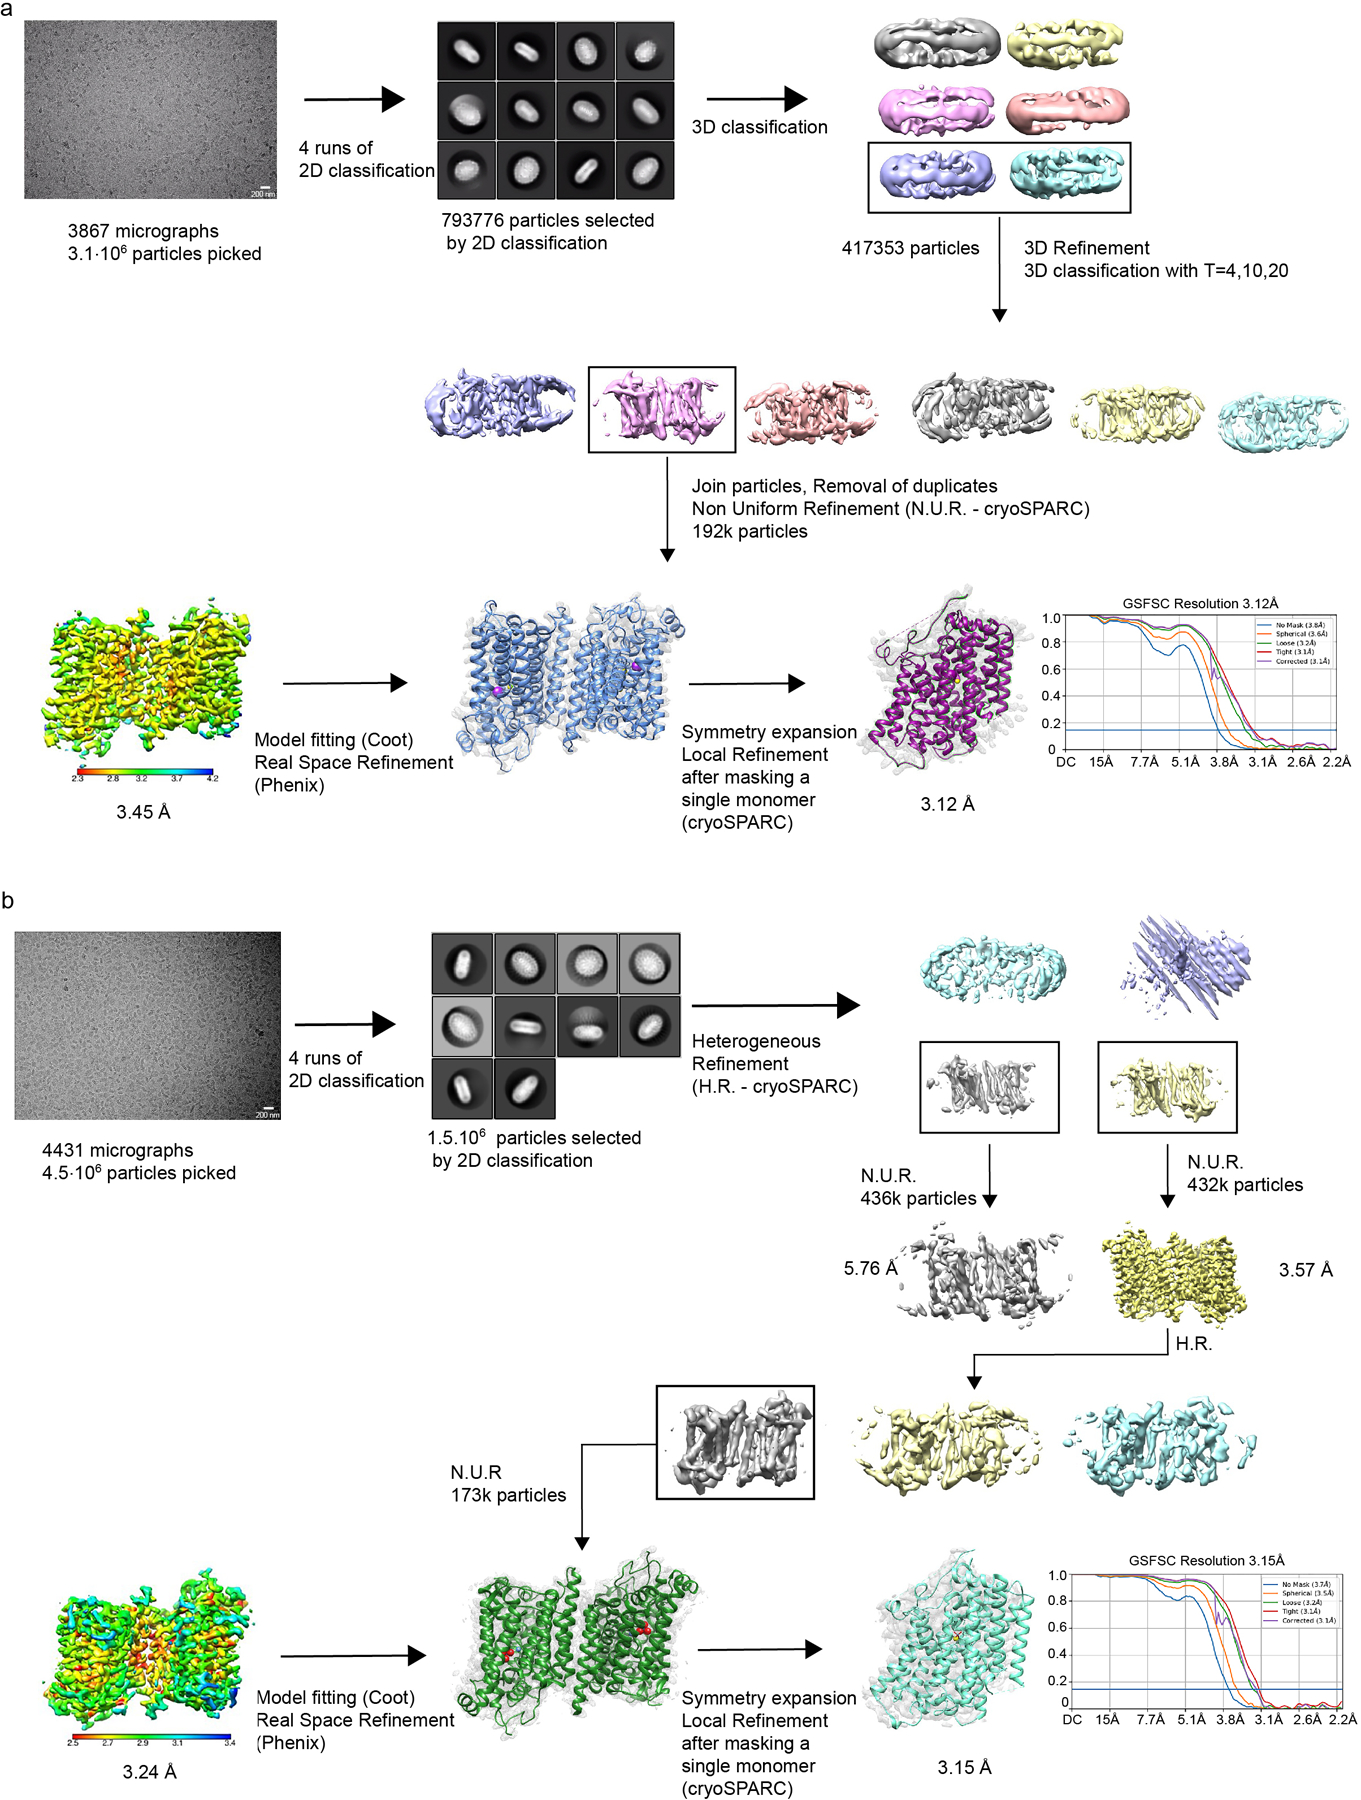
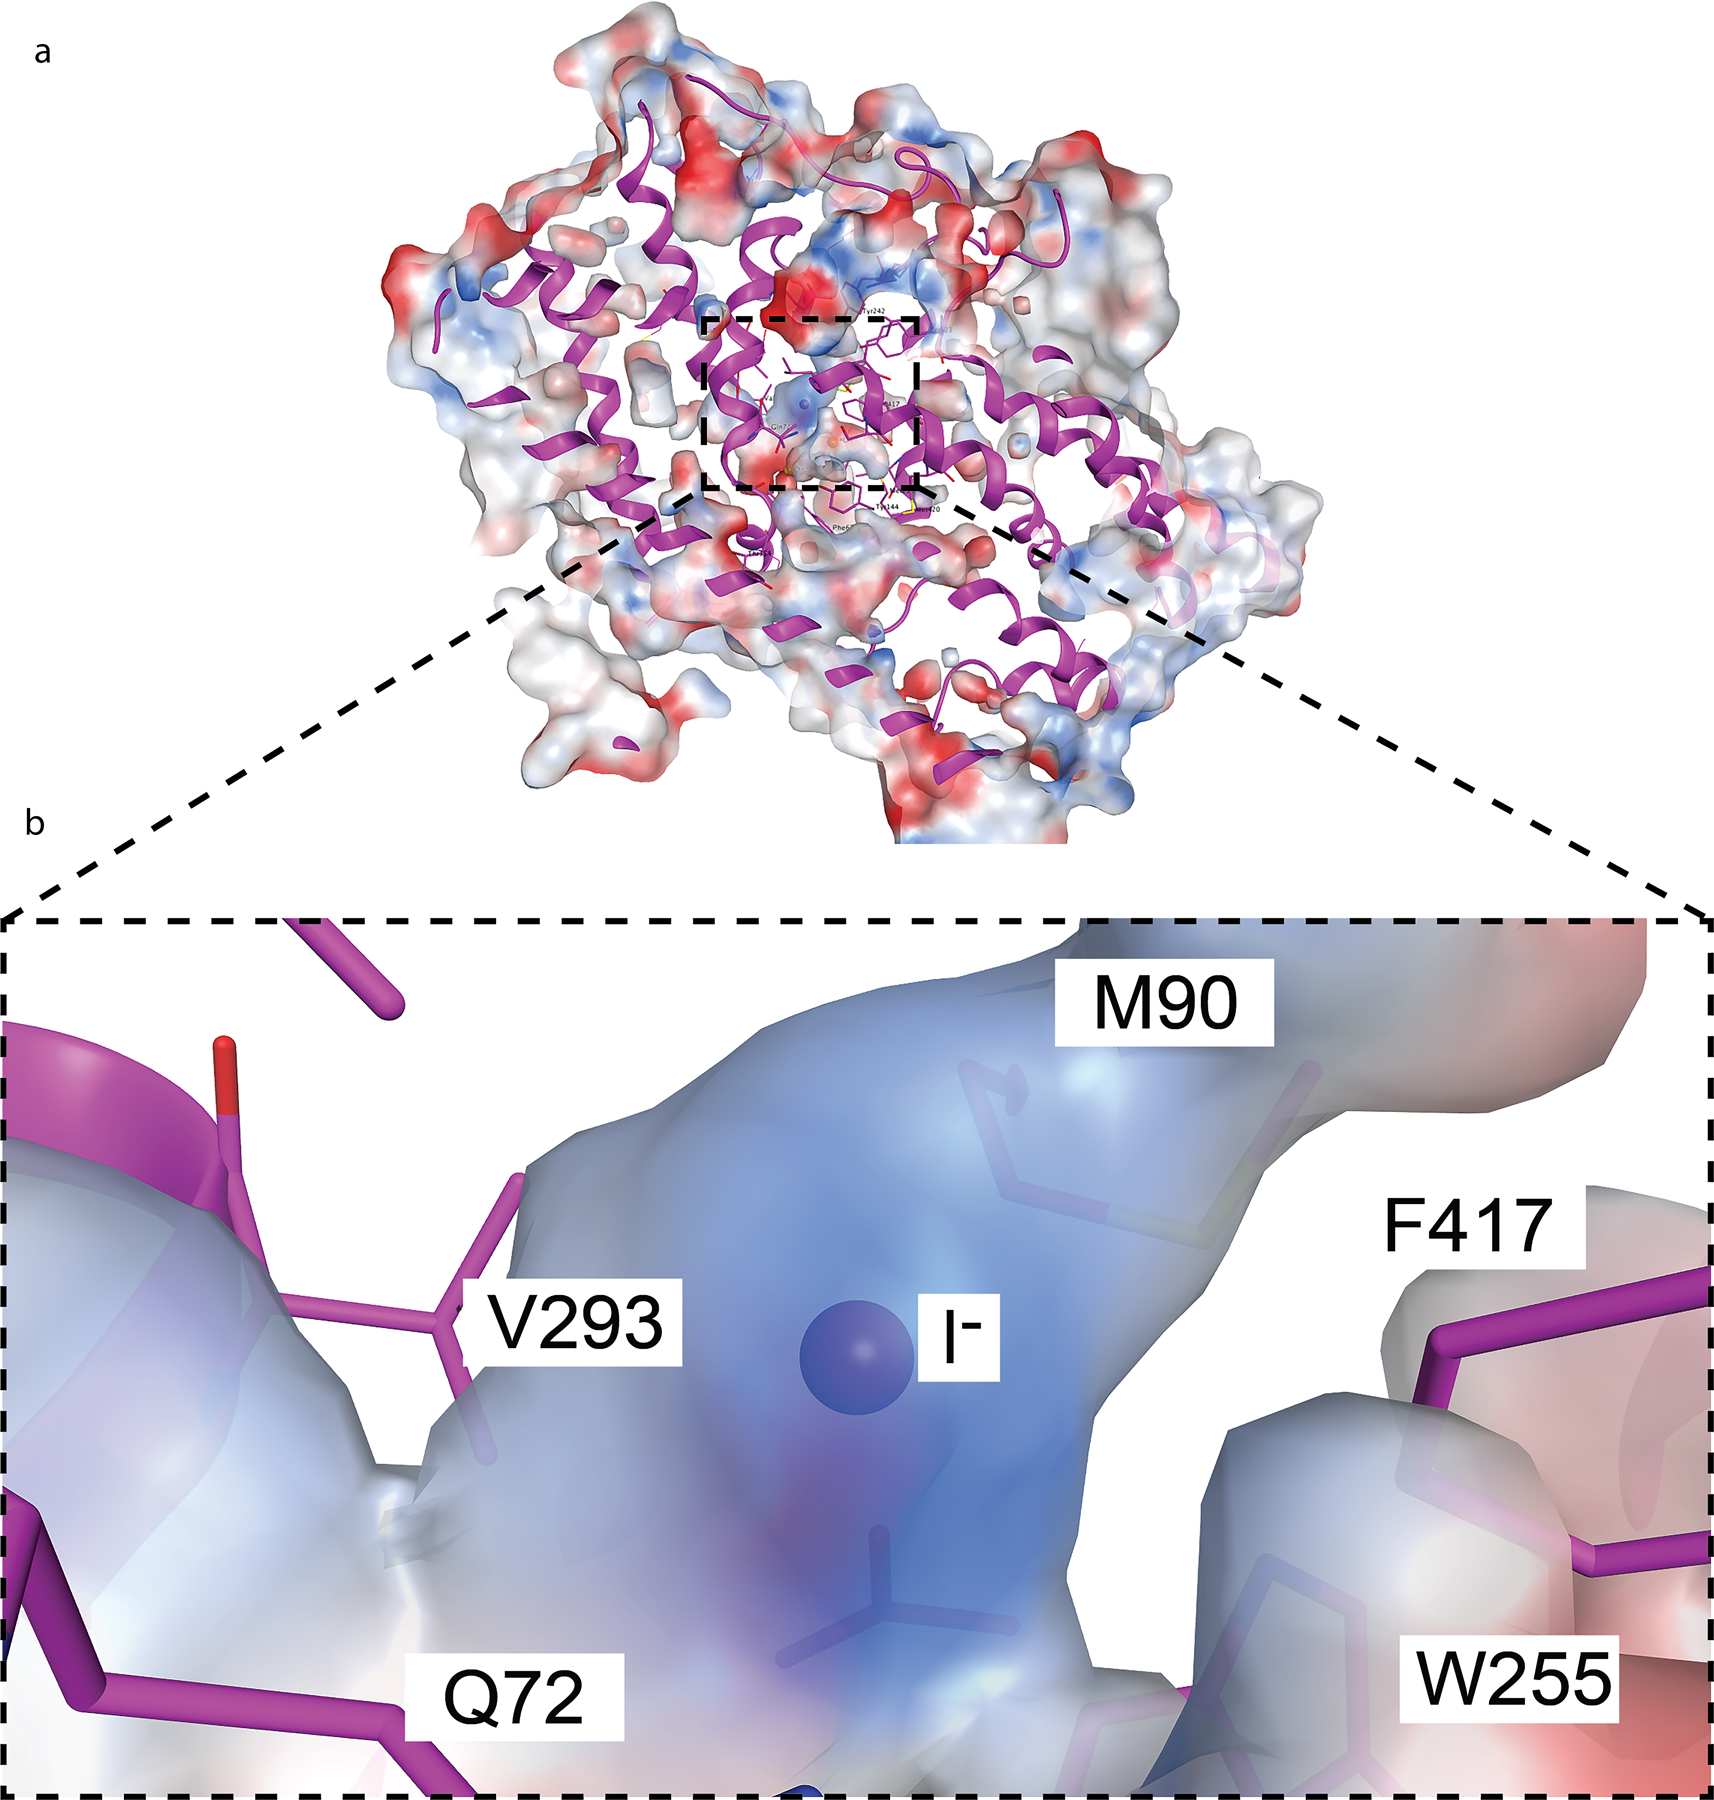
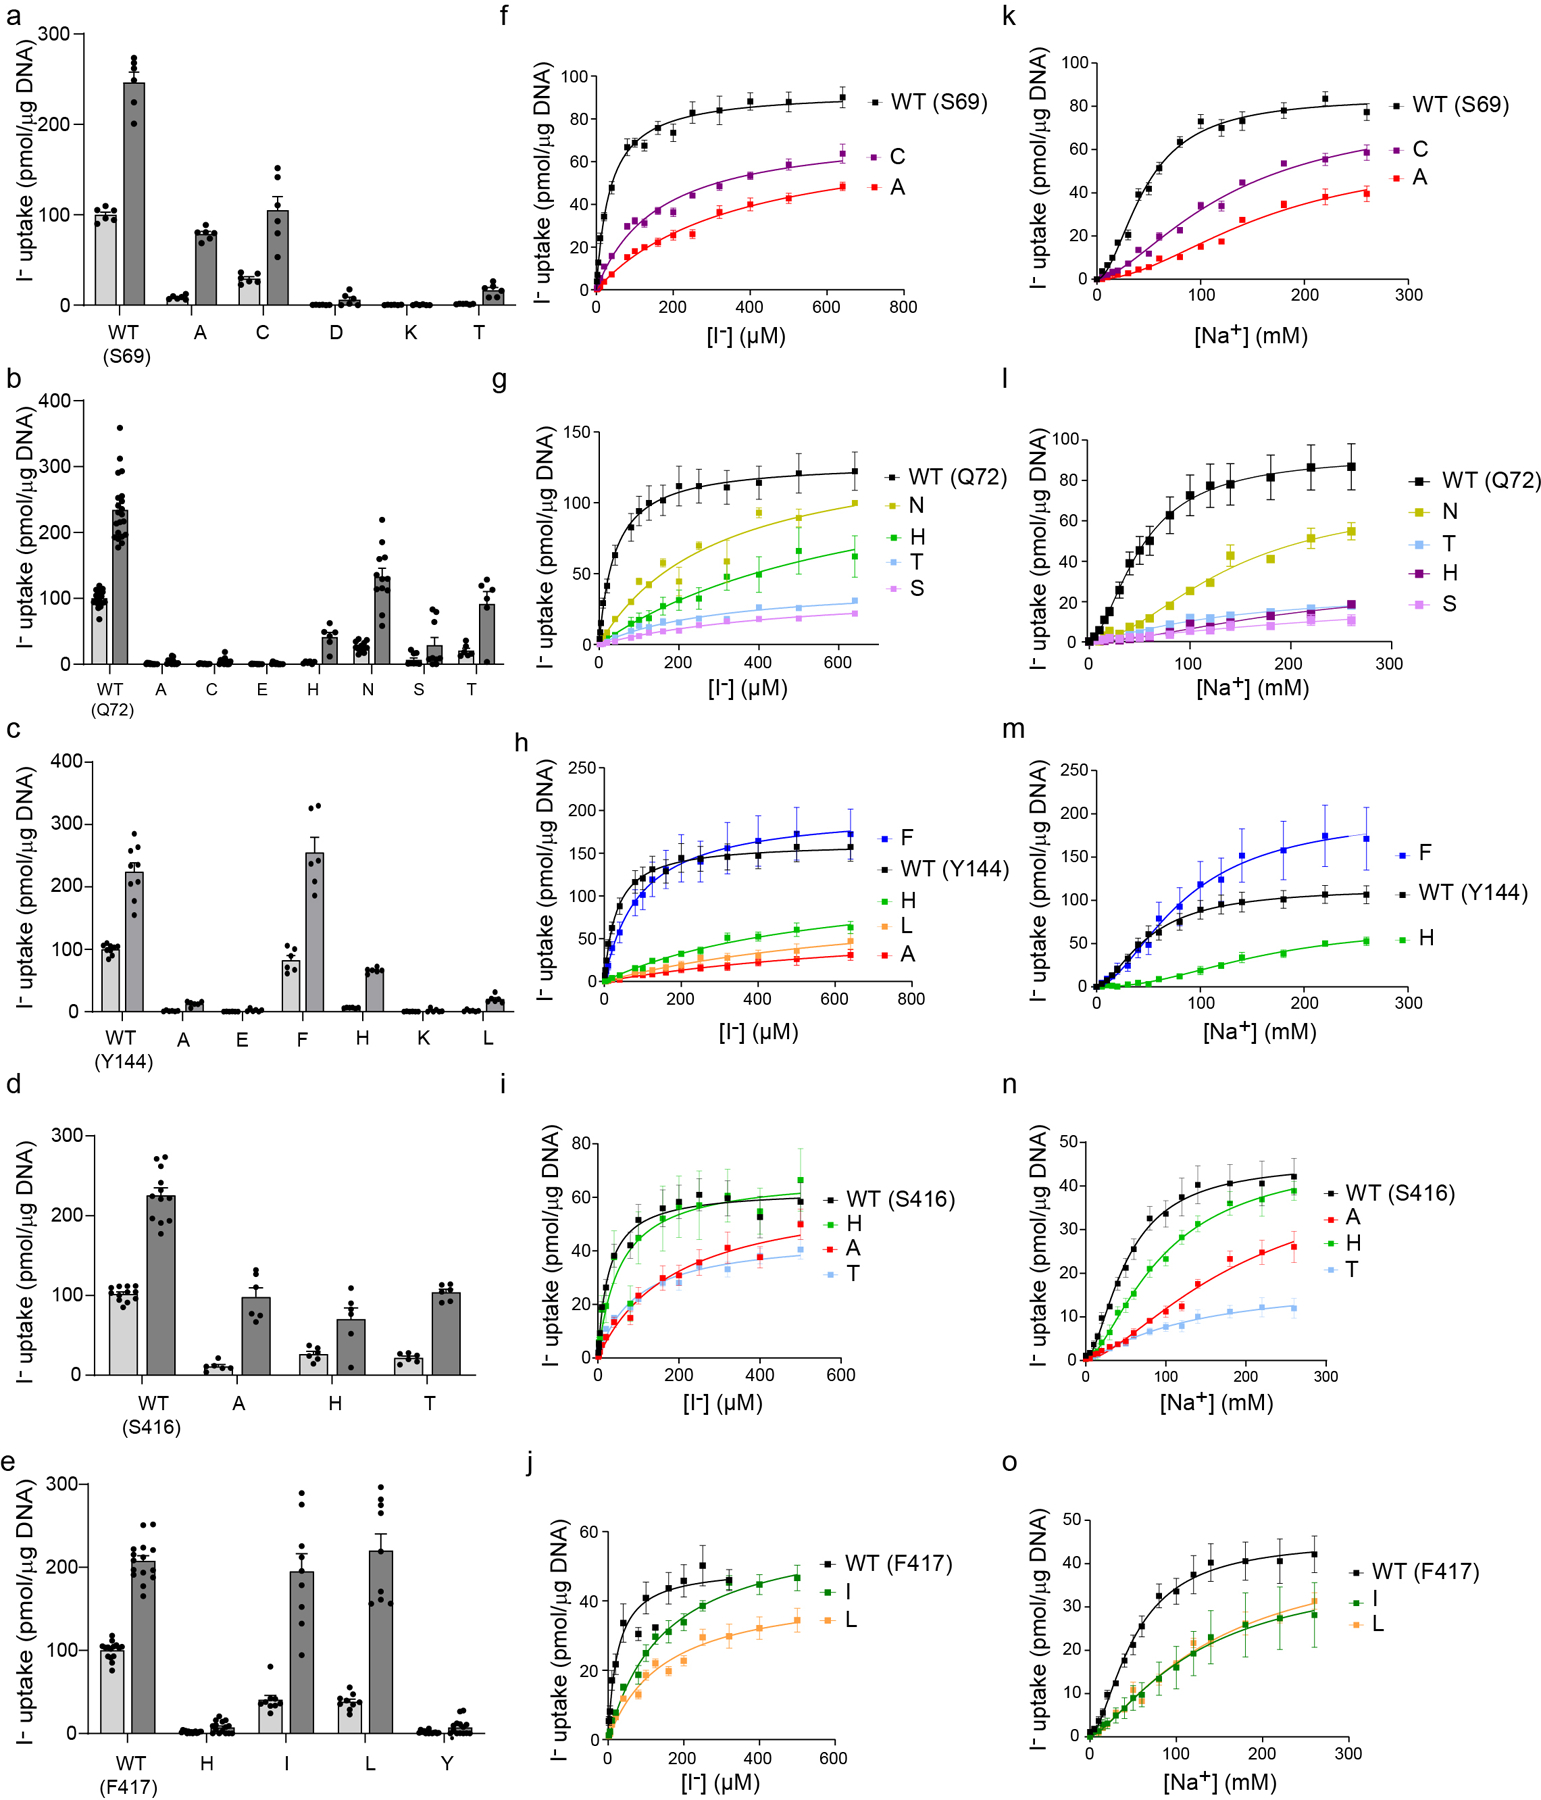
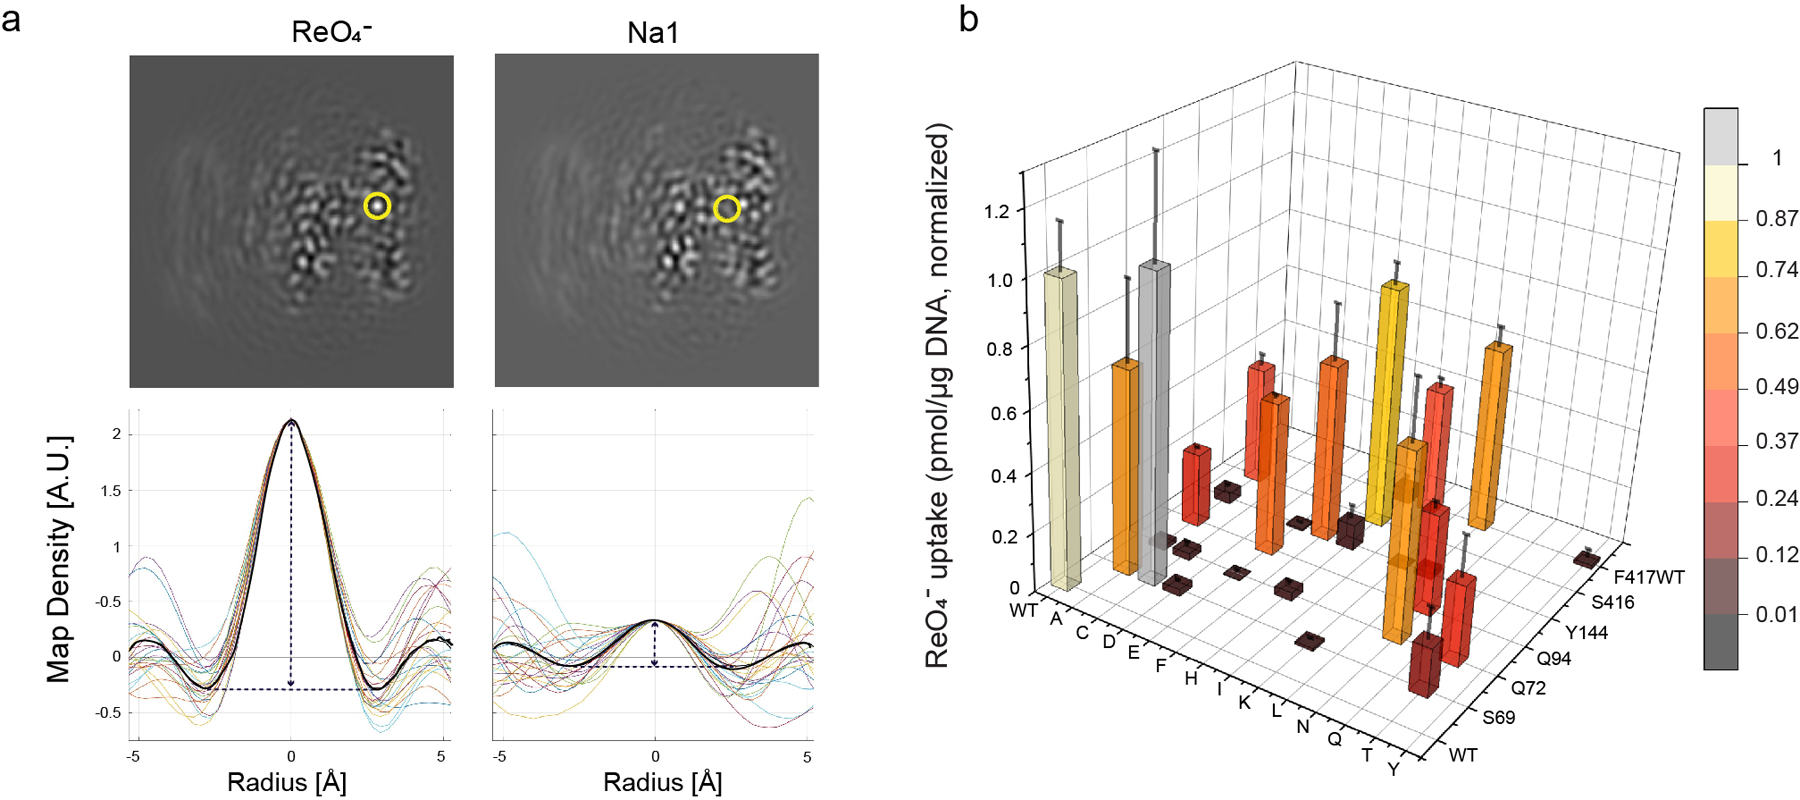
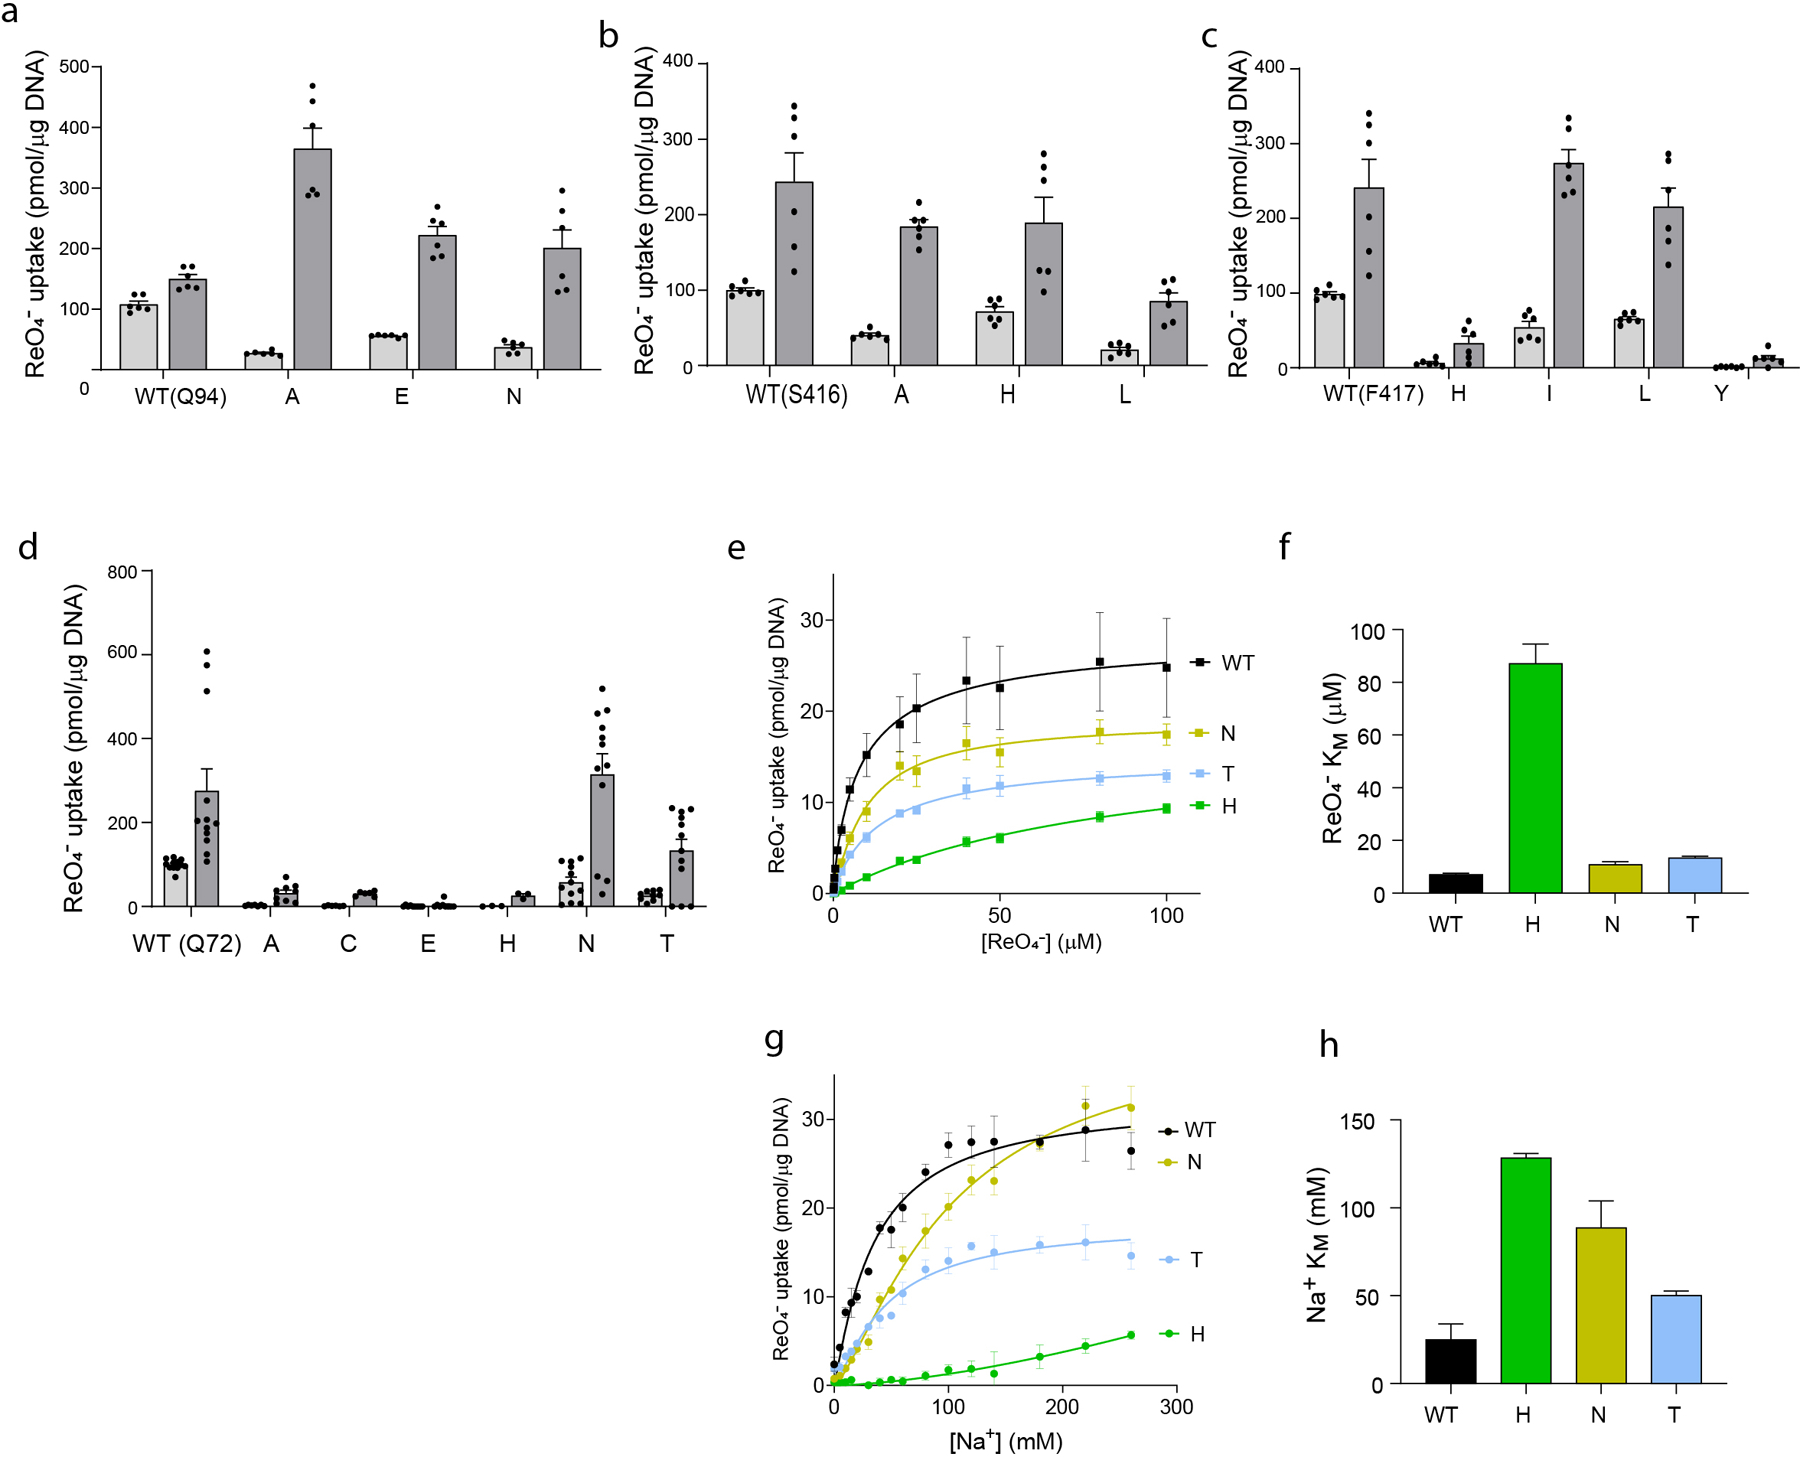
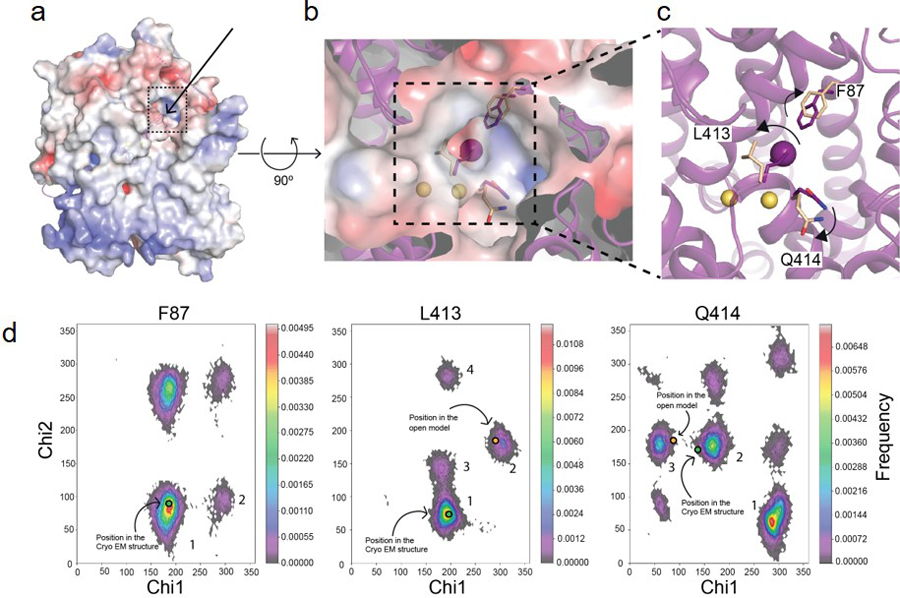
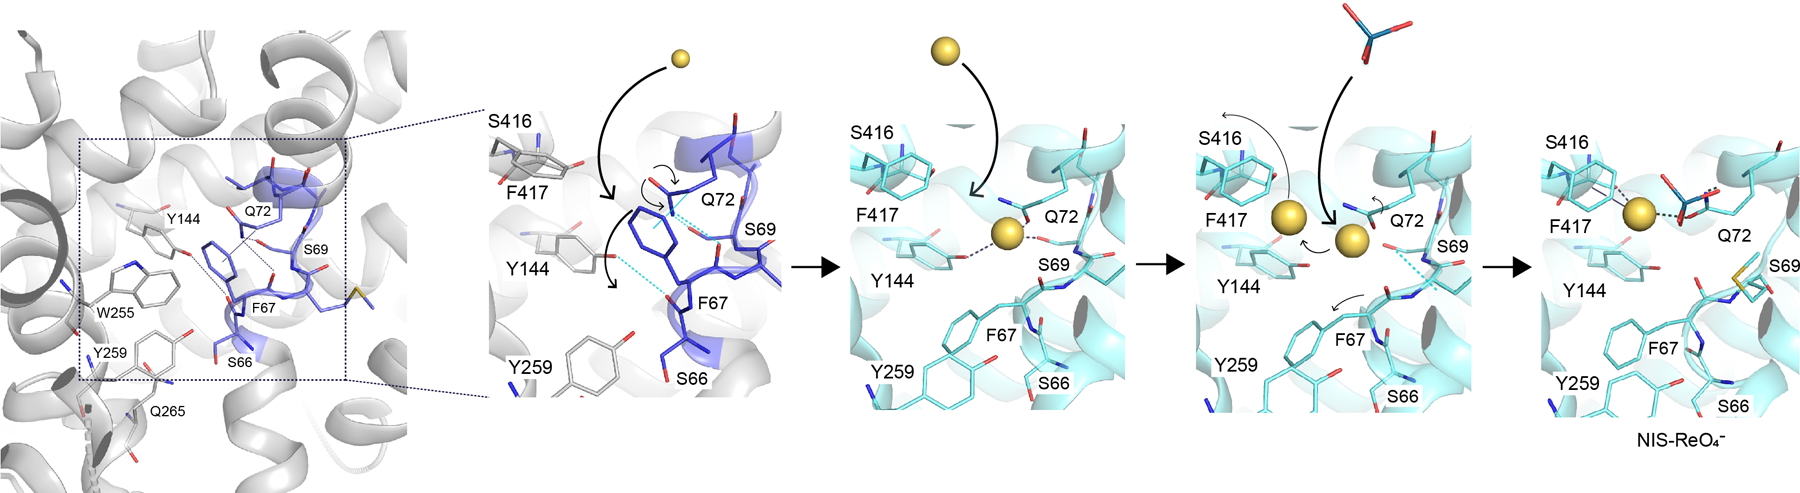
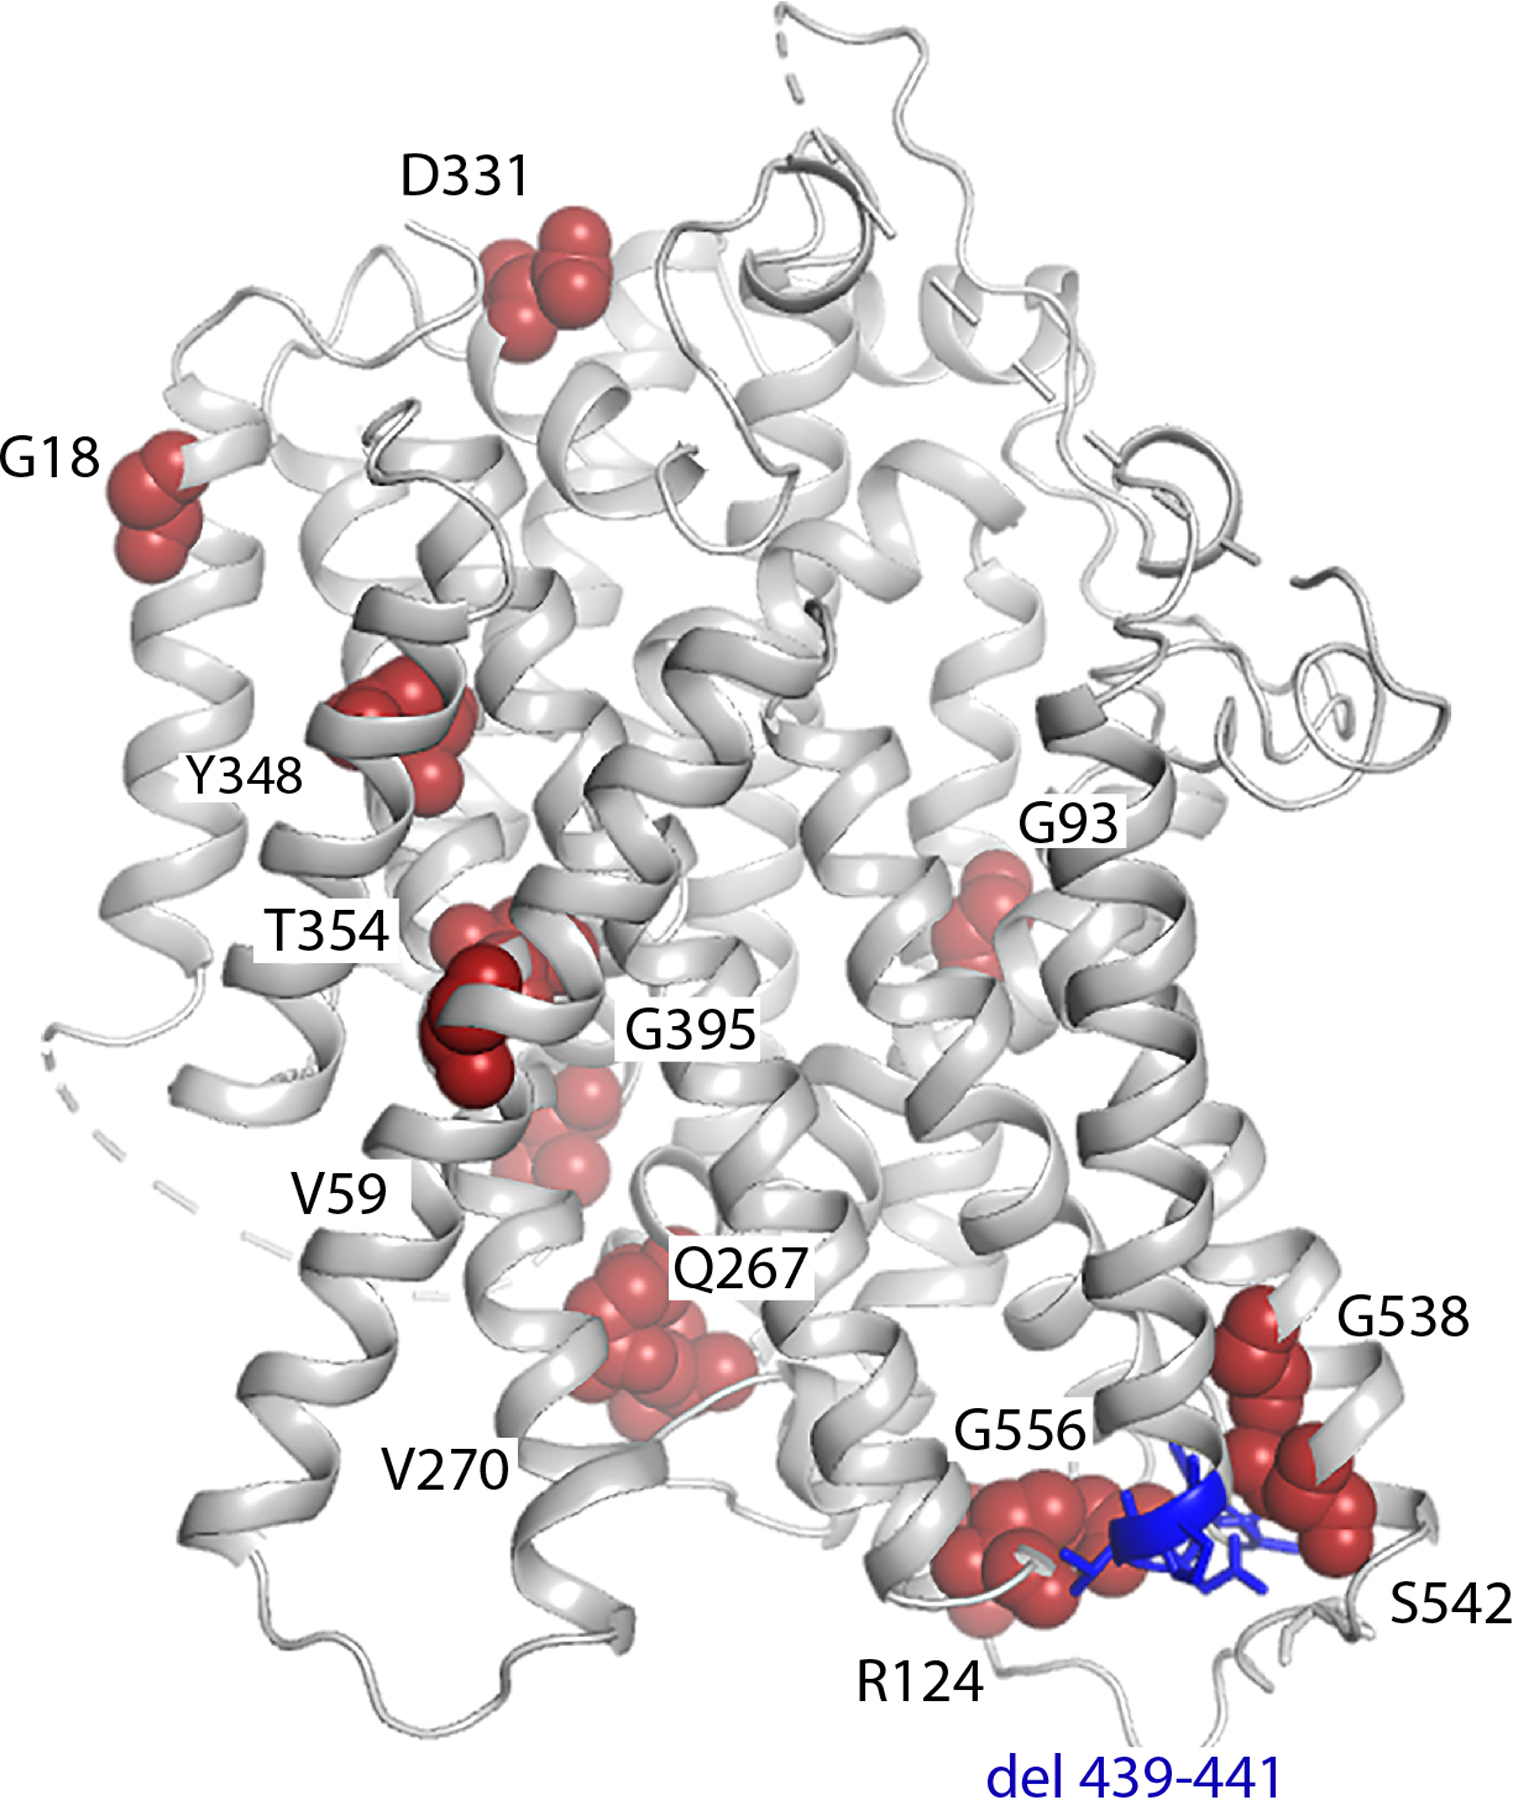
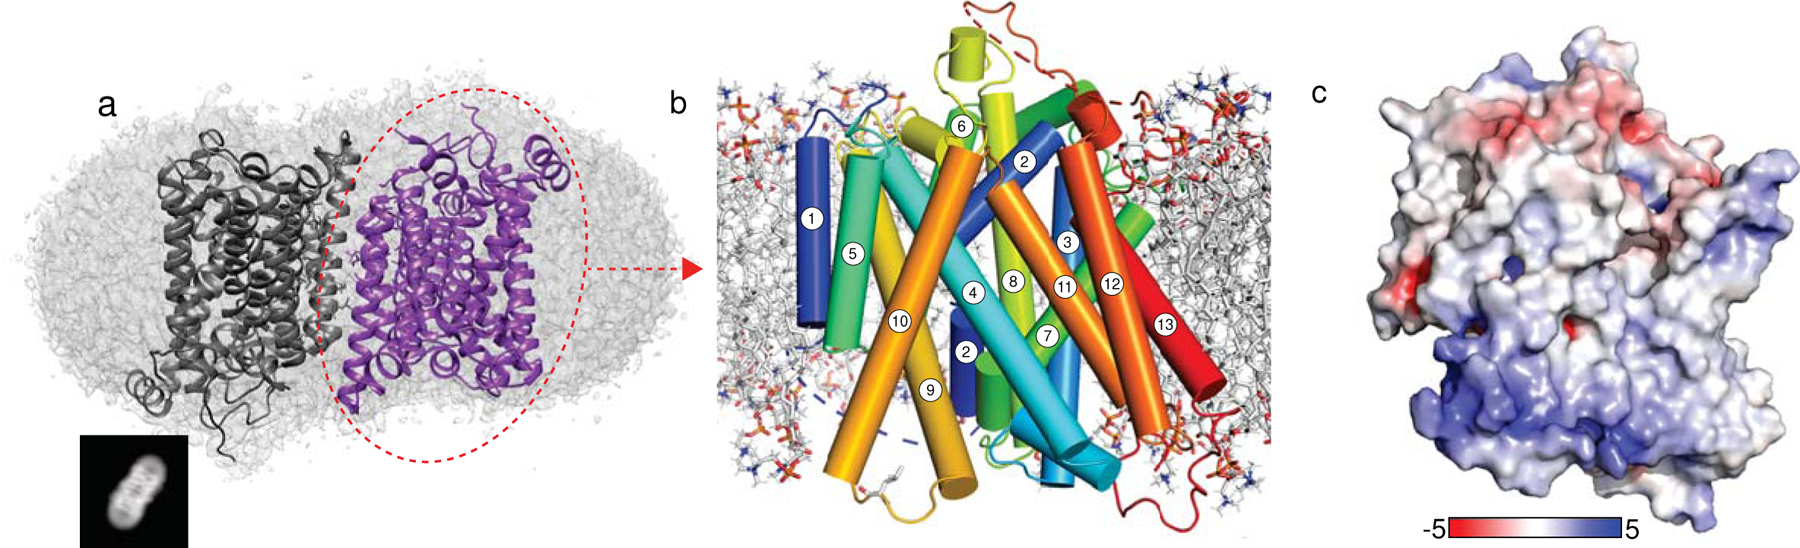
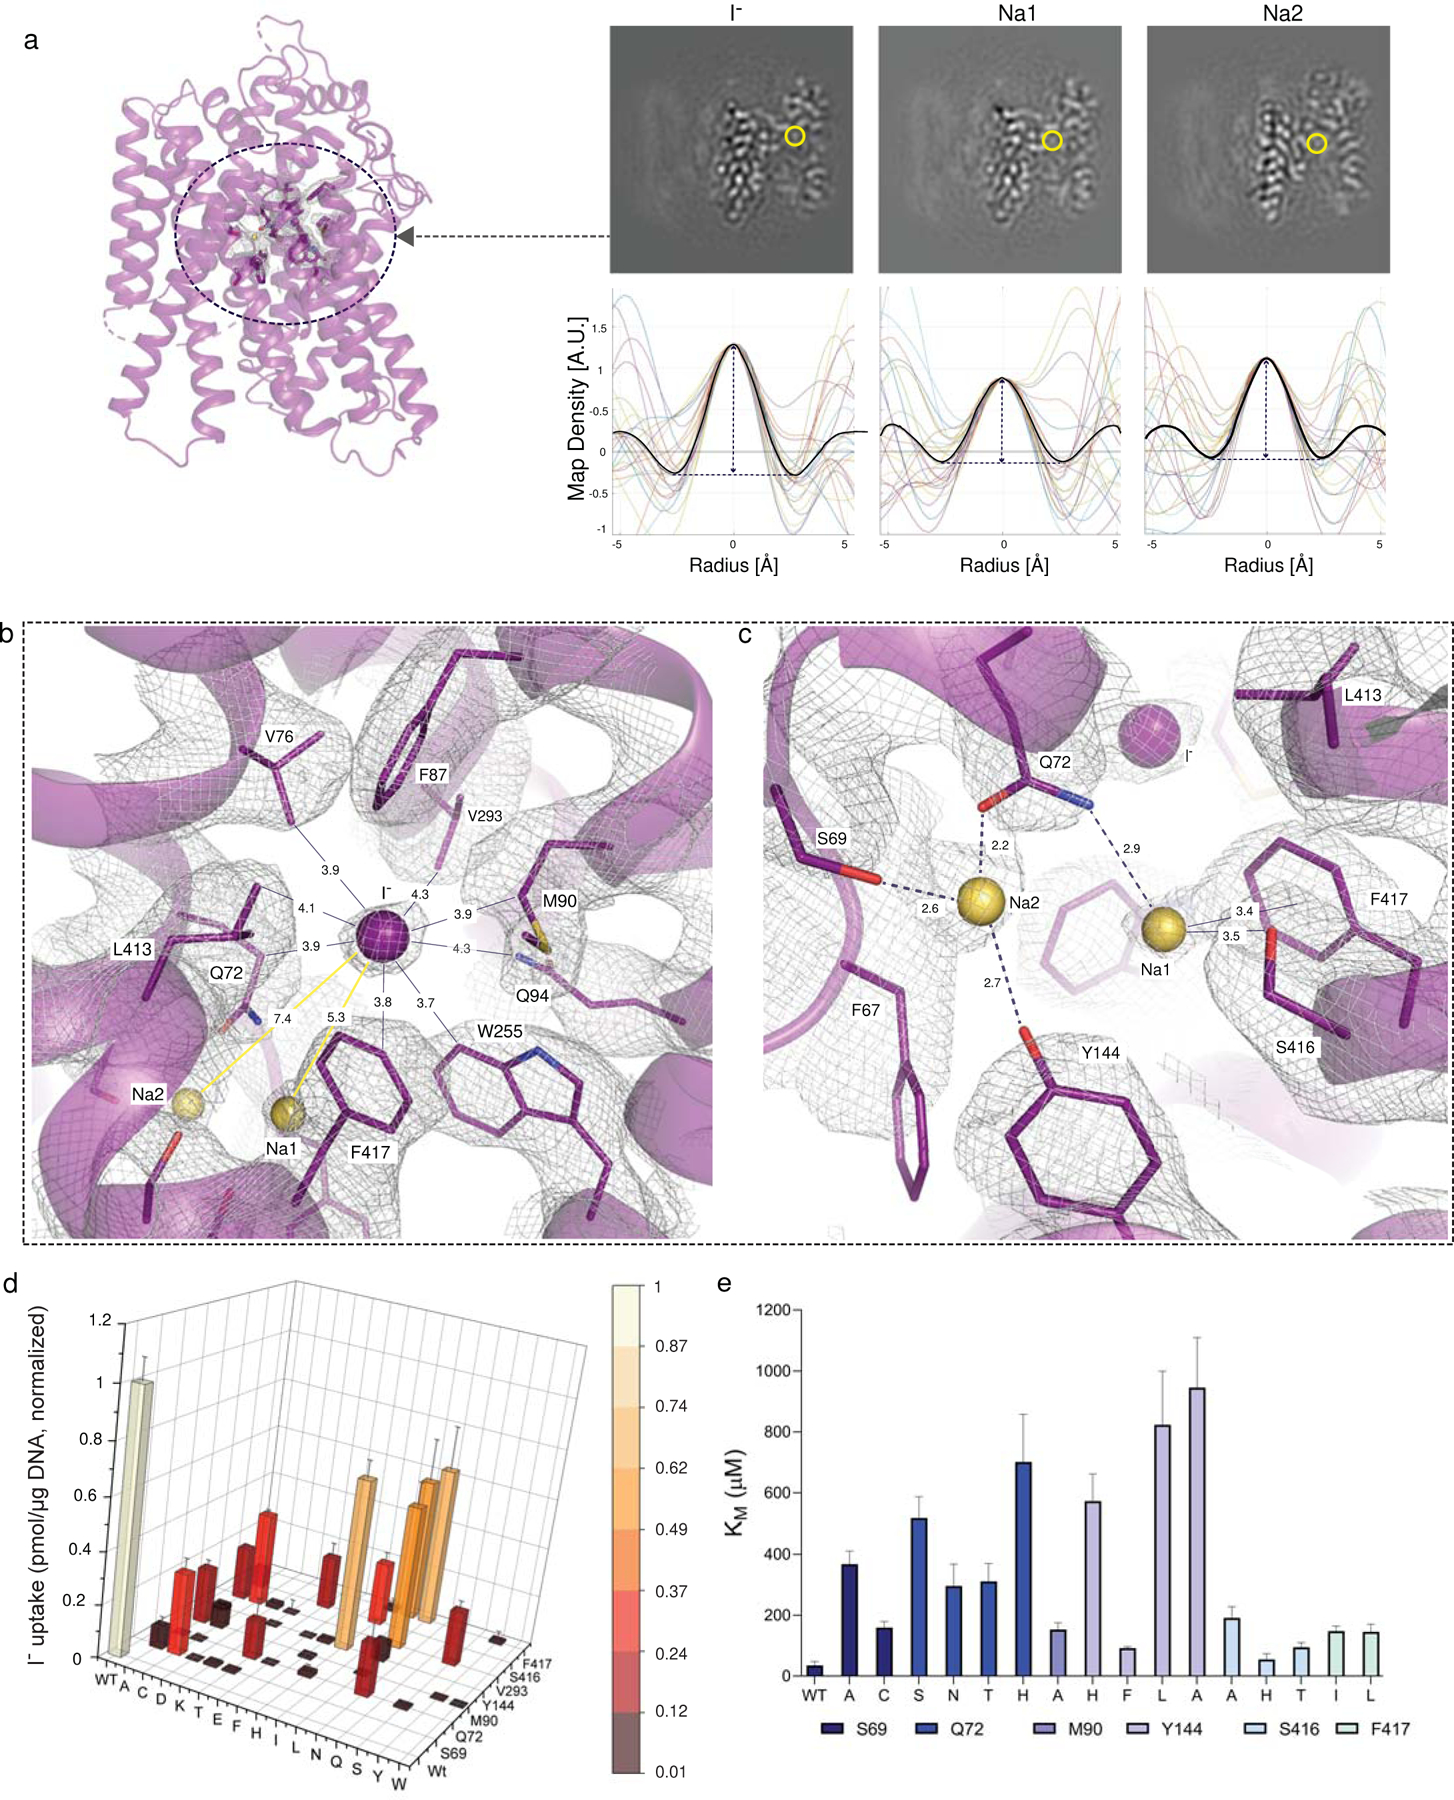
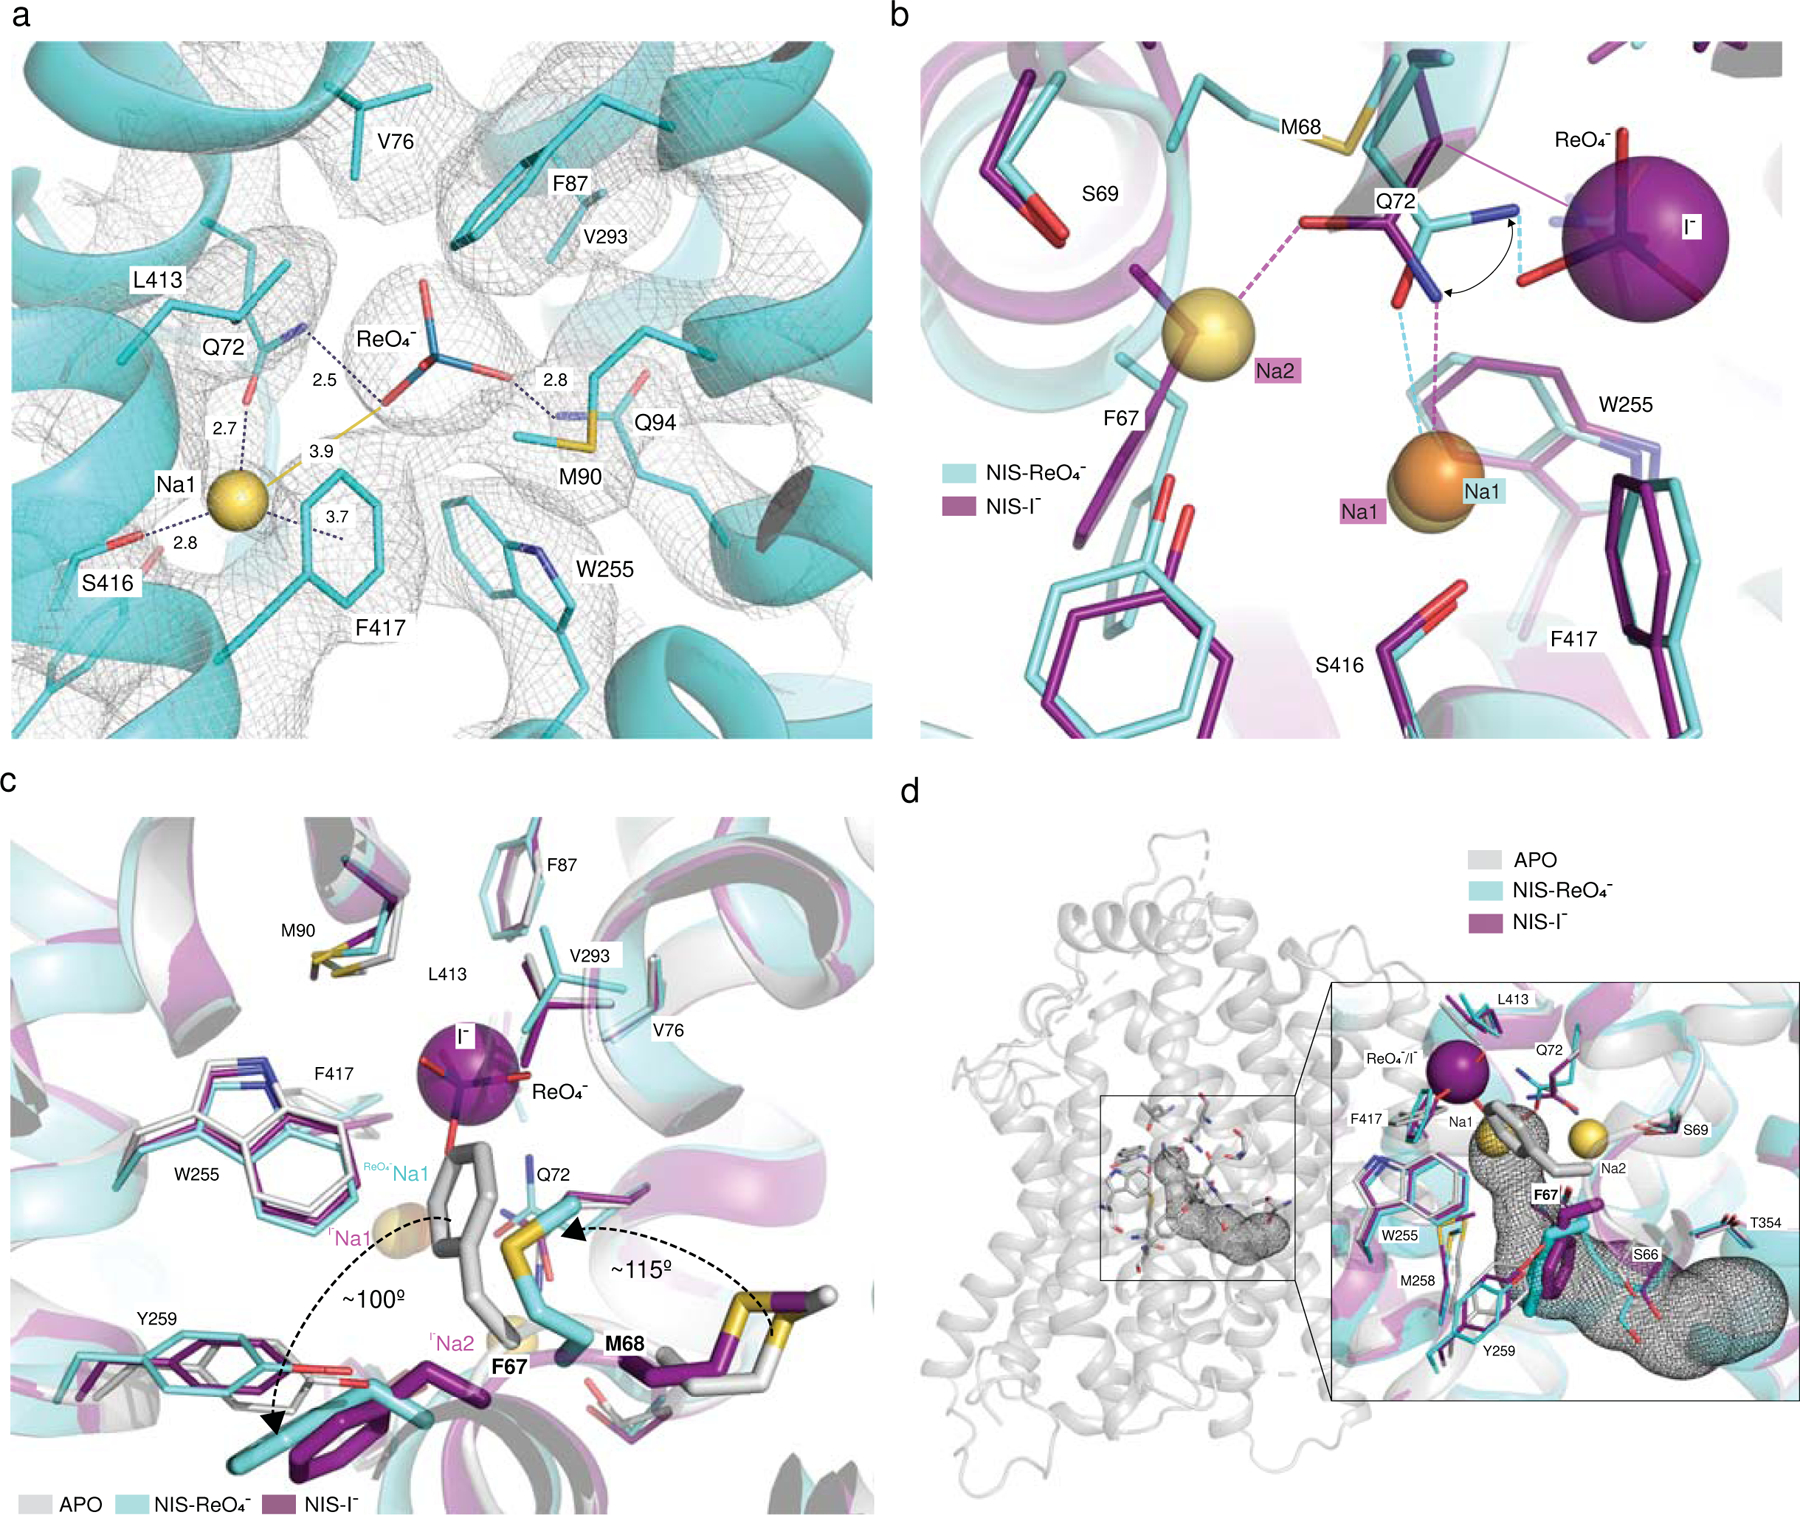
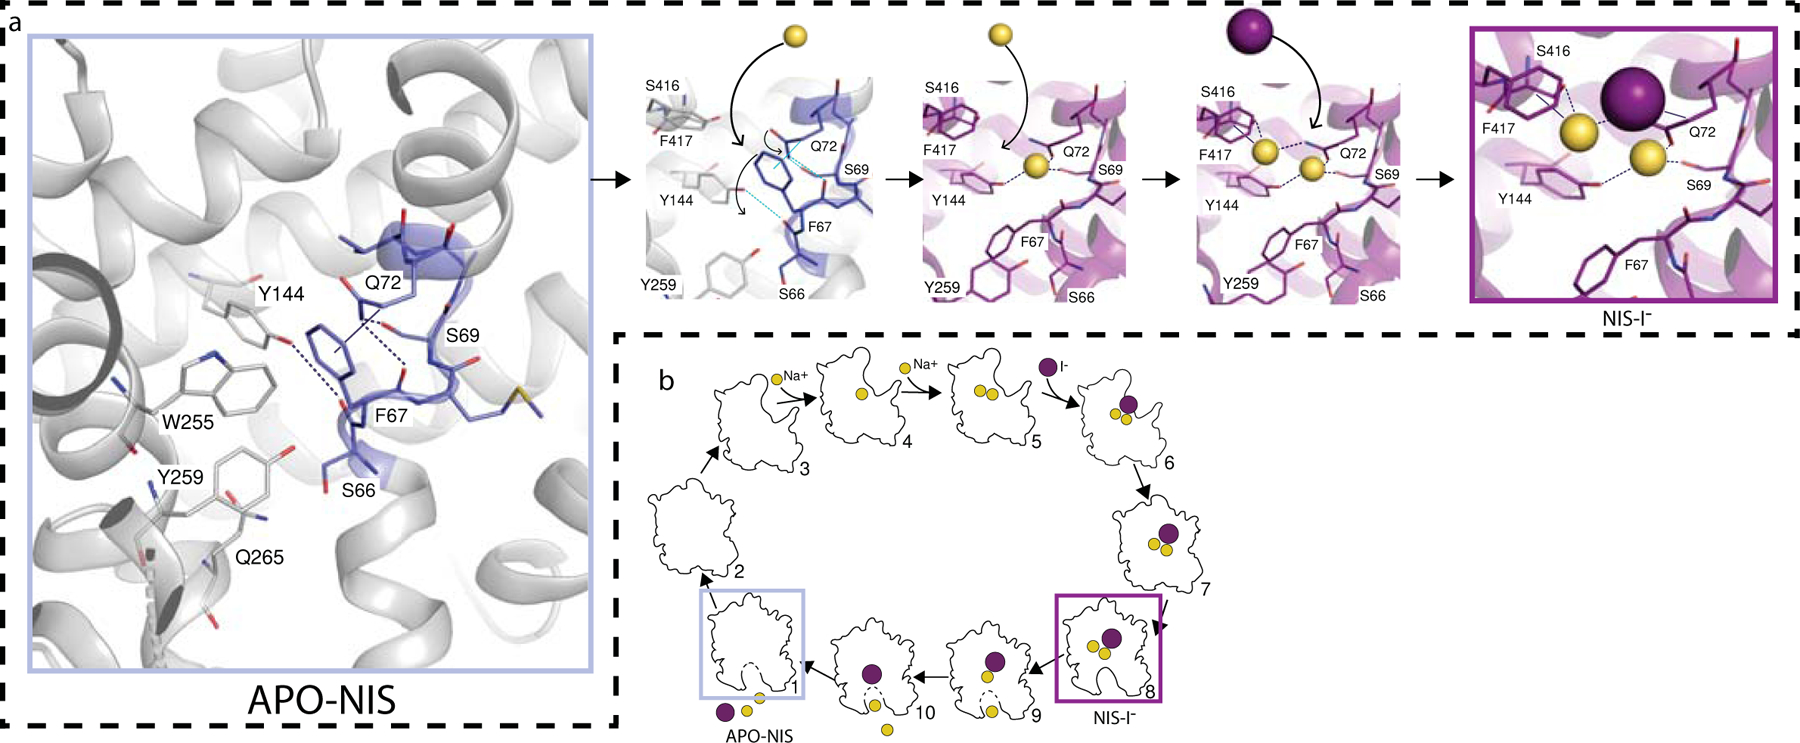
The sodium/iodide symporter (NIS) is the essential plasma membrane protein that mediates active iodide (I-) transport into the thyroid gland, the first step in the biosynthesis of the thyroid hormones-the master regulators of intermediary metabolism. NIS couples the inward translocation of I- against its electrochemical gradient to the inward transport of Na+ down its electrochemical gradient1,2. For nearly 50 years before its molecular identification3, NIS was the molecule at the centre of the single most effective internal radiation cancer therapy: radioiodide (131I-) treatment for thyroid cancer2. Mutations in NIS cause congenital hypothyroidism, which must be treated immediately after birth to prevent stunted growth and cognitive deficiency2. Here we report three structures of rat NIS, determined by single-particle cryo-electron microscopy: one with no substrates bound; one with two Na+ and one I- bound; and one with one Na+ and the oxyanion perrhenate bound. Structural analyses, functional characterization and computational studies show the substrate-binding sites and key residues for transport activity. Our results yield insights into how NIS selects, couples and translocates anions-thereby establishing a framework for understanding NIS function-and how it transports different substrates with different stoichiometries and releases substrates from its substrate-binding cavity into the cytosol.


Conflict of interest statement

Competing Interests

The authors declare no competing interests.

Figures

Extended Data Fig. 1 |
Extended Data Fig. 1 |. Cryo-EM data processing and determination of the structure of NIS.
Topology model of the engineered NIS molecule (rt-NIS) whose cDNA was used to transduce 293F cells. We engineered an HA tag onto the N-terminus and a HIS and an SBP (streptavidin-binding protein) tag onto the C-terminus for affinity purification. The tags are separated from NIS by a TEV protease site at the N-terminus and a PreScission site at the C-terminus. b. Enrichment of 293F cells expressing NIS by flow cytometry using an anti-HA antibody. After two rounds of sorting, >96% of the cells expressed NIS at the plasma membrane. c. I transport assay. T-NIS transports virtually as much I as WT NIS does, whereas nontransduced (NT) cells transport no I. Results are expressed as pmol of I accumulated/μg DNA ± s.e.m. Values represent averages of the results from two different experiments, each of which was carried out in triplicate (n = 6). d. Size exclusion chromatography (SEC) of the fraction of NIS purified in LMNG/GDN used for cryo-EM imaging detected by Trp-fluorescence. e. Coomassie blue staining of SEC-purified NIS subjected to SDS-PAGE (representative gel (n=3); see also Supplementary Fig. 1). f. Cryo-EM micrograph of apo-NIS (representative of 8025 micrographs that yielded similar results). The scale bar represents 200 nm. g. Selected 2D class averages obtained after 4 rounds of 2D classification using Relion (top image) and data-processing workflow (bottom two rows). h. Fourier shell correlation (FSC) of the locally refined map. i. NIS dimer map colored according to local resolution. j. Fitting of NIS sequence to the electron density map. k. Local refinement.
Extended Data Fig. 2 |
Extended Data Fig. 2 |. Cryo-EM densities and model of TMSs and dimeric assembly of NIS.
a. α-helical features are clearly visible in all 13 TMSs. b. NIS structure viewed from the extracellular side of the membrane, with the numbered TMs depicted as cylinders (left panel). NIS embedded in the membrane, top view; an example of 2D classes representing the corresponding view is shown in the black square (middle panel). NIS structure viewed from the intracellular side of the membrane, with the numbered TMs depicted as cylinders (right panel). c. Residues interacting at the dimer interface in apo-NIS.
Extended Data Fig. 3 |
Extended Data Fig. 3 |. Cryo-EM data processing and determination of the structures of NIS with substrates bound.
a. NIS-I. b. NIS-ReO4.
Extended Data Fig. 4 |
Extended Data Fig. 4 |. I− binds to a partially positively charged cavity.
a. NIS-I side view. The solvent accessible surface is colored according to the electrostatic potential using a double gradient between −2 EV (red) to white (0) and between (0) to blue (2 EV) and cropped to expose the I binding cavity. b. Close-up of the I binding cavity showing the positive nature of its surface.
Extended Data Fig. 5 |
Extended Data Fig. 5 |. Effects of single amino acid substitutions at positions 69, 72, 144, 416, 417 on iodide transport.
a-e. NIS-mediated I uptake at steady state. cDNA constructs coding for NIS mutants were transfected into COS7 or HEK cells. I uptake by these NIS mutants was measured at 20 μM (light gray bars) and 200 μM (dark gray bars) I at 140 mM Na+ for 30 min with or without the NIS-specific inhibitor ClO4 to determine NIS-mediated transport (values obtained in the presence of ClO4, which are < 10% of the values obtained in its absence, have already been subtracted). f-j. Kinetic analysis of initial rates of I uptake (2-min time points) determined at 140 mM Na+ and varying concentrations of I. k-o. Kinetic analysis of initial rates of I uptake (2-min time points) determined at varying concentrations of extracellular Na+. All results are expressed as pmol of I accumulated/μg DNA ± s.e.m. Values represent averages of the results from two or three different experiments, each of which was carried out in triplicate (n ≥ 6).
Extended data Fig. 6 |
Extended data Fig. 6 |. Identification of the ions in the NIS-ReO4− structure.
a. The ions transported by NIS were identified by evaluating the map density along 24 lines passing through each site (circled in yellow on images of map slices). Values are plotted for each line and the spherically-averaged mean is plotted in black (lower panels). b. Effects of substitutions in binding-site residues on ReO4 transport at steady state (measured at 3 μM ReO4 and 140 mM Na+ for 30 min (values obtained in the presence of ClO4, which are < 10% of the values obtained in its absence, have already been subtracted). Values are normalized to those obtained with WT NIS. Values represent averages of the results from two or three different experiments, each of which was carried out in triplicate (n ≥ 6) and reported as pmol ReO4 accumulated/μg DNA ± s.e.m.
Extended Data Fig. 7 |
Extended Data Fig. 7 |. Effects of single amino acid substitutions at positions 72, 94, 416 and 417 on ReO4− transport.
a-d. NIS-mediated ReO4 uptake at steady state. cDNA constructs coding for NIS mutants in which Q72 is replaced with the residues indicated were transfected into COS7 or HEK cells. ReO4 uptake by these NIS mutants was measured at 3 μM (light gray bars) and 30 μM (dark gray bars) ReO4 at 140 mM Na+ for 30 min with or without the NIS-specific inhibitor ClO4 (values obtained in the presence of ClO4 already subtracted). Results are given as pmols of ReO4 accumulated/μg DNA ± s.e.m. Values represent averages of the results from two or three different experiments, each of which was carried out in triplicate (n ≥ 6). e. Kinetic analysis of initial rates of ReO4 uptake (2-min time points) for Q72 NIS mutants determined at varying concentrations of extracellular ReO4 and varying concentrations of extracellular Na+. Results are given as pmols of ReO4 accumulated/μg DNA ± s.e.m. Values represent averages of the results from two or three different experiments, each of which was carried out in triplicate (n ≥ 6). f. ReO4 KM values determined from (e); error bars represent the standard deviation of the Michaelis-Menten analysis. g. Kinetic analysis of initial rates of ReO4 uptake (2-min time points) for Q72 NIS mutants determined at 100 μM ReO4 and varying concentrations of extracellular Na+. Results are given as pmols of ReO4 accumulated/μg DNA ± s.e.m. Values represent averages of the results from two or three different experiments, each of which was carried out in triplicate (n ≥ 6). h. Na+ KM values determined from (g); error bars represent the standard deviation of the Hill equation analysis.
Extended Data Fig. 8 |
Extended Data Fig. 8 |. Entry pathway for the NIS substrates.
a. Surface representation of a side view of the NIS-I structure: the arrow and the dotted square indicate the position of the proposed entry pathway. b. Close-up of the top view of the surface showing the substrates (Na+ ions represented by yellow spheres, I by a magenta sphere), and the positions of F87, L413, and Q414 in the NIS-I structure (magenta) and the models generated from MD simulations corresponding to the opening (wheat) of the substrate-binding cavity to the extracellular milieu. c. Magnification of the top of the substrate-binding cavity. The arrows indicate how the amino acids move away from their original positions as the cavity transitions from closed to open. d. Ramachandran plots of the chi-1 and chi-2 side chain dihedral angles of F87, L413, and Q414 visited during the MD simulations with NIS-I. The dihedral angles selected are the principal determinants of the position of the side chain. The excursions of these dihedral angles (during the MD simulations) away from the conformational basins corresponding to the cryoEM structure (green dots in basins 1, 1, and 2, in F87, L413, and Q414, respectively) and toward conformational basins (blue dots in basins 1, 2, and 3, in F87, L413, and Q414, respectively) open up the entry path (b). In these histograms, the frequency of a given conformational state is indicated by a rainbow gradient from deep purple (0 frequency) to red (highest frequency); the most highly populated conformational basins are numbered in descending order of population.
Extended Data Fig. 9 |
Extended Data Fig. 9 |. Perrhenate binding mechanism starting from the apo-NIS structure.
A hydrogen-bond network between F67, S69, Q72, and Y144 and a hydrophobic stacking interaction between F67 and Q72 are disrupted by the binding of the first Na+. This facilitates the binding of a second Na+ and ReO4, which causes the release of one Na+.
Extended Data Fig. 10 |
Extended Data Fig. 10 |. Apo-NIS structure with amino acids mutated in patients with ITDs shown as spheres.
Single amino acid substitutions are indicated by red spheres; deleted residues are in blue. The substitutions found in patients are: G18R, V59E, G93R, R124H, Q267E, V270E, D331N, Y348D, T354P, G395R, G543E, S547R, G561E and the deletion of 439–443 (ACNTP).
Fig. 1 |
Fig. 1 |. Structure of NIS.
a. Two NIS molecules entirely embedded in a detergent micelle, side view. An example of 2D classes representing the corresponding view is shown in the black square. b. NIS structure viewed from the plane of the membrane, with the numbered TM helices depicted as cylinders; c. Side view of NIS as in (c) but with solvent-accessible surface colored according to the electrostatic potential in kBT/e (red, negative; blue, positive).
Fig. 2 │
Fig. 2 │. Iodide and sodium binding sites. Fig. 2 | Iodide and sodium binding sites.
a. In the NIS-I structure, the yellow circle indicates the substrate binding pocket. Ions transported by NIS were identified by analyzing the map density values (map slices in upper panels) along 24 lines passing through each site, circled in yellow. Map values are plotted for each line (lower panels), and the spherically-averaged mean is plotted in black. b. Close-up of the I binding pocket, where I is represented by the purple sphere. The distance (in Å) from I to each surrounding residue is indicated. Yellow spheres represent sodium ions. c. Close-up of interactions between Na1 and Na2 and surrounding residues. d. Functional effects of mutations in binding-site residues. Steady-state transport was determined at 20 μM I and 140 mM Na+ for 30 min, normalized to values obtained with WT NIS (values obtained in the presence of ClO4, which are < 10% of the values obtained in its absence, have already been subtracted). Values represent averages of the results from two or three different experiments, each of which was carried out in triplicate (n ≥ 6) and reported as pmol I accumulated/μg DNA ± s.e.m. e. KM values obtained from the kinetic analysis of I transport; results are expressed as μM ± s.d. Error bars represent the standard deviation of the Michaelis-Menten analysis (n ≥ 6).
Fig. 3 |
Fig. 3 |. Perrhenate binding pocket and localized changes caused by ion binding.
a. Close-up of the ReO4 binding pocket. ReO4 is represented by sticks and Na1 by a yellow sphere. Distances from ReO4 and Na1 to surrounding residues (within 3.9 Å) are indicated, as is the distance from ReO4 to Na1. b. Close-up of the structural alignment of NIS-I and NIS-ReO4 showing the shift of Q72. c. Close-up of the structural alignment between apo-NIS, NIS-I and NIS-ReO4. The arrows represent the shift of F67 and M68 from the position they occupy in the apo-NIS structure to the one in the substrate-bound structures. In the apo-NIS structure, F67 partially occupies the anion site. d. Tunnel calculated by Caver-Analyst in the apo-NIS structure that connects the substrate binding pocket with the cytosol. Inset: alignment of the three structures revealing that in the substrate-bound NIS, F67 blocks the pathway from the binding sites to the cytosol.
Fig. 4 |
Fig. 4 |. NIS mechanism.
a. Mechanism of NIS substrate binding, starting from the apo-NIS structure (grey rectangle). A hydrogen-bond network between F67, S69, Q72, and Y144 and a hydrophobic stacking interaction between F67 and Q72 are disrupted by the binding of the first Na+. This facilitates the binding of a second Na+ and subsequently of I. b. Cartoon of the putative NIS transport cycle. The experimental structures are enclosed in grey and magenta boxes.

References

    1. Portulano C, Paroder-Belenitsky M & Carrasco N The Na(+)/I(−) Symporter (NIS): Mechanism and Medical Impact. Endocrine reviews 35, 106–149, doi:10.1210/er.2012-1036 (2014). - DOI - PMC - PubMed
    1. Ravera S, Reyna-Neyra A, Ferrandino G, Amzel LM & Carrasco N The Sodium/Iodide Symporter (NIS): Molecular Physiology and Preclinical and Clinical Applications. Annu Rev Physiol 79, 261–289, doi:10.1146/annurev-physiol-022516-034125 (2017). - DOI - PMC - PubMed
    1. Dai G, Levy O & Carrasco N Cloning and characterization of the thyroid iodide transporter. Nature 379, 458–460 (1996). - PubMed
    1. Mullur R, Liu YY & Brent GA Thyroid hormone regulation of metabolism. Physiol Rev 94, 355–382, doi:10.1152/physrev.00030.2013 (2014). - DOI - PMC - PubMed
    1. Zhang Z, Liu F & Chen J Molecular structure of the ATP-bound, phosphorylated human CFTR. Proc Natl Acad Sci U S A 115, 12757–12762, doi:10.1073/pnas.1815287115 (2018). - DOI - PMC - PubMed

LinkOut - more resources