. 2023 Jan;613(7942):120-129.
doi: 10.1038/s41586-022-05534-y. Epub 2022 Dec 14.

Microglia regulate central nervous system myelin growth and integrity

Affiliations

Microglia regulate central nervous system myelin growth and integrity

Niamh B McNamara et al. Nature. 2023 Jan.

Erratum in

  • Author Correction: Microglia regulate central nervous system myelin growth and integrity.
    McNamara NB, Munro DAD, Bestard-Cuche N, Uyeda A, Bogie JFJ, Hoffmann A, Holloway RK, Molina-Gonzalez I, Askew KE, Mitchell S, Mungall W, Dodds M, Dittmayer C, Moss J, Rose J, Szymkowiak S, Amann L, McColl BW, Prinz M, Spires-Jones TL, Stenzel W, Horsburgh K, Hendriks JJA, Pridans C, Muramatsu R, Williams A, Priller J, Miron VE. McNamara NB, et al. Nature. 2024 Jul;631(8021):E11. doi: 10.1038/s41586-024-07696-3. Nature. 2024. PMID: 38961305 Free PMC article. No abstract available.

Abstract

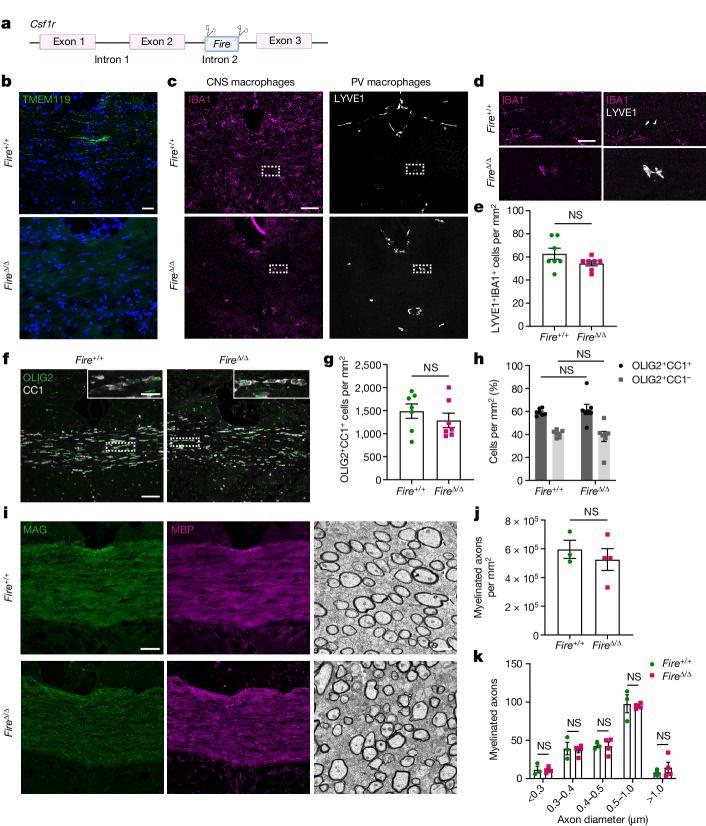
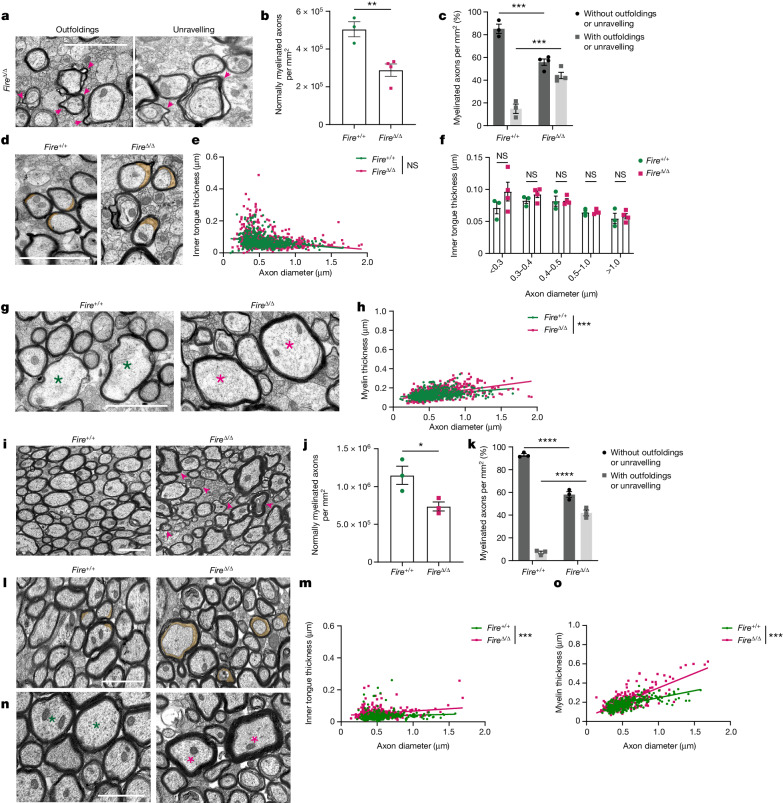
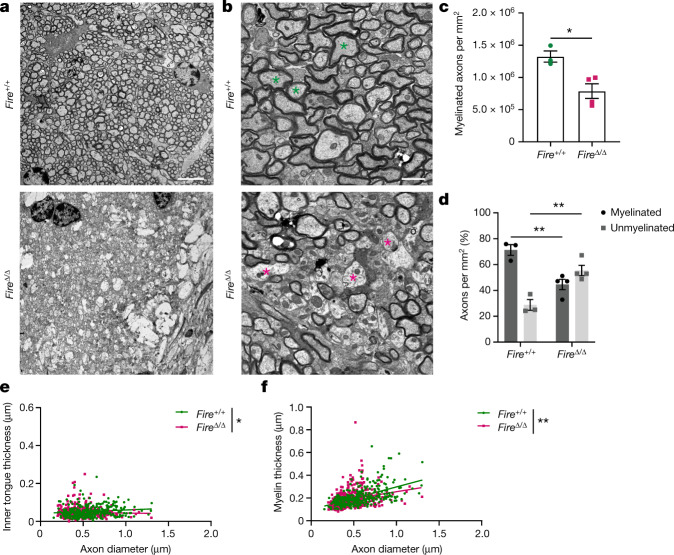
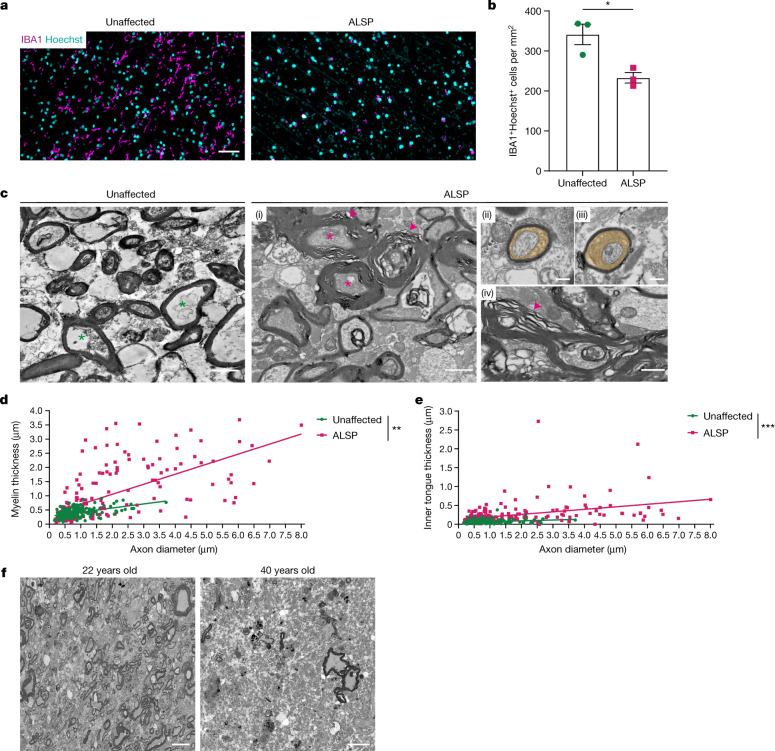
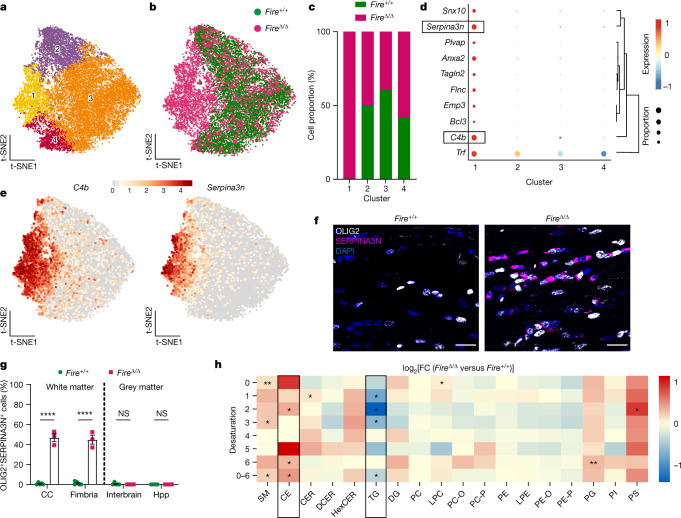
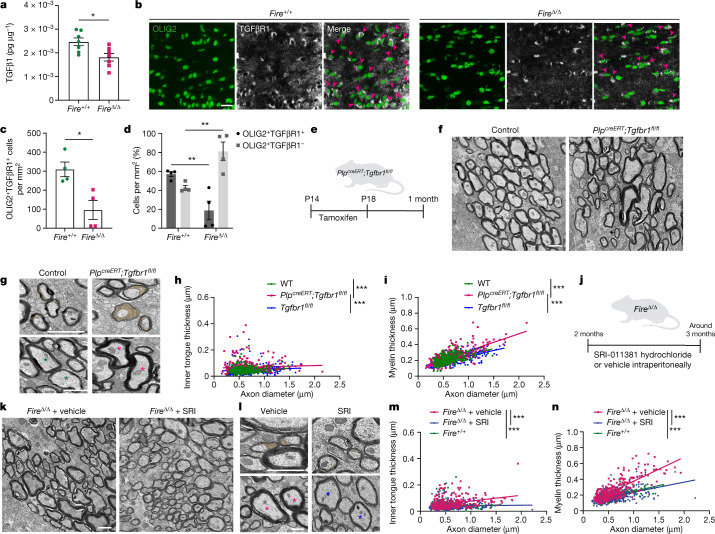
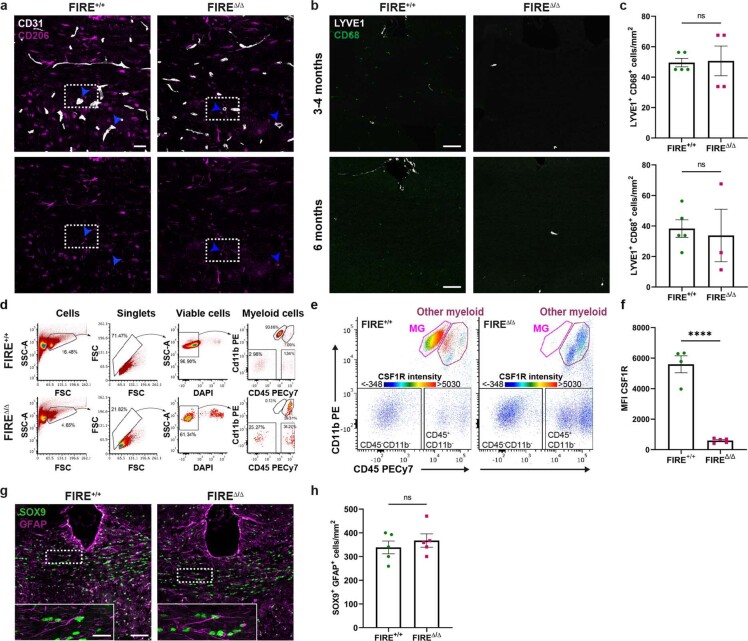
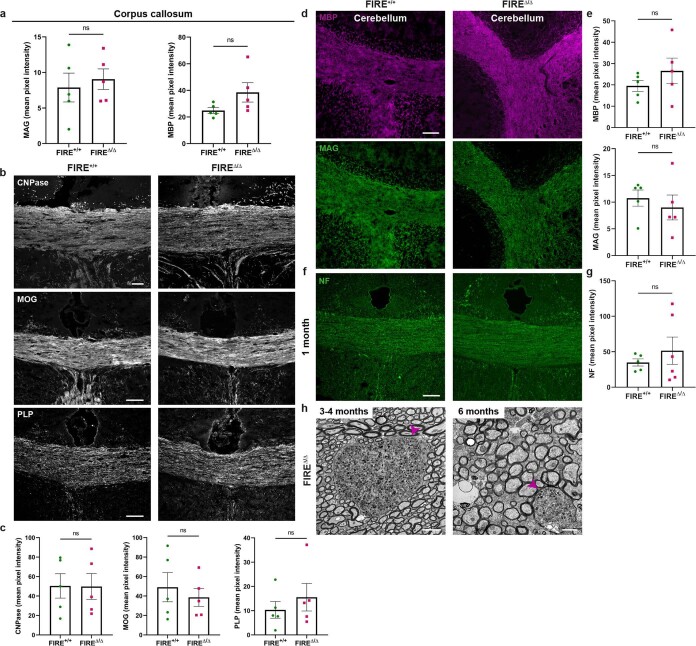
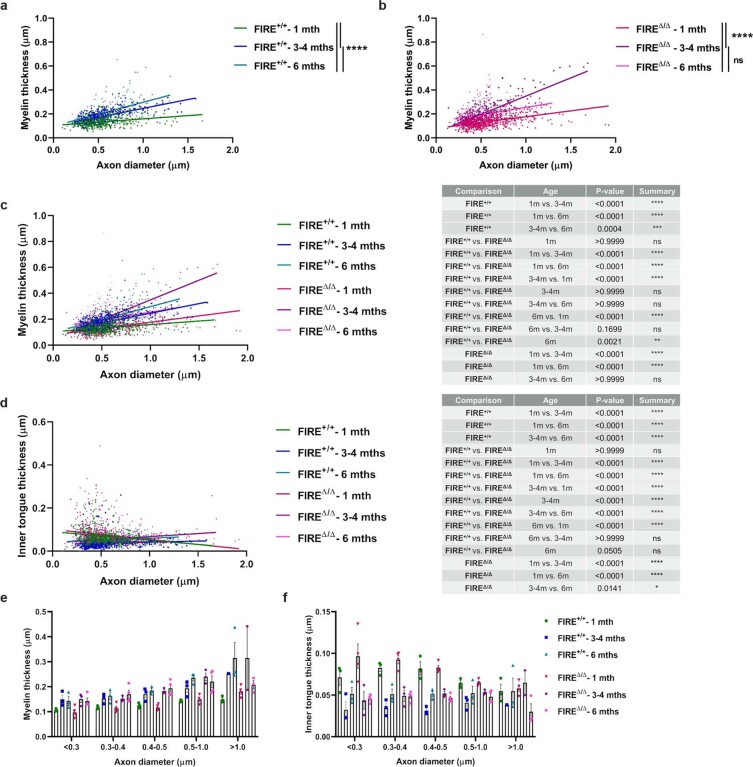
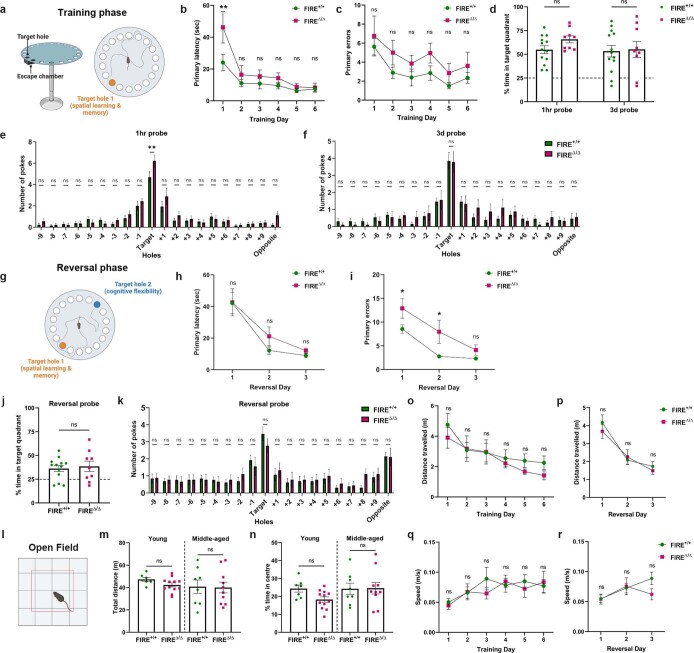
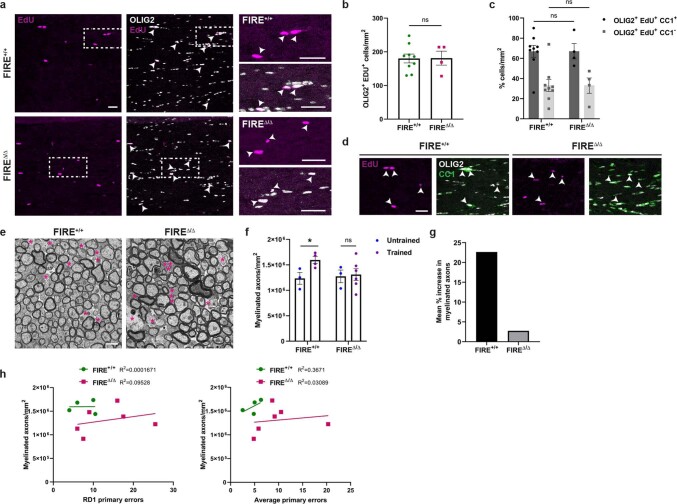
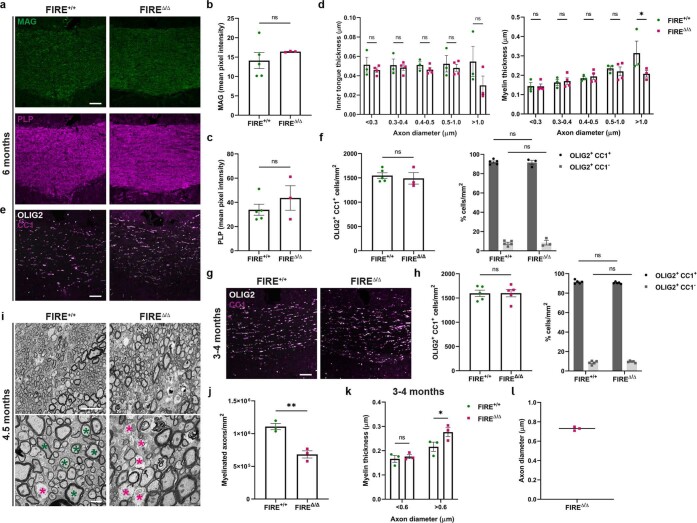
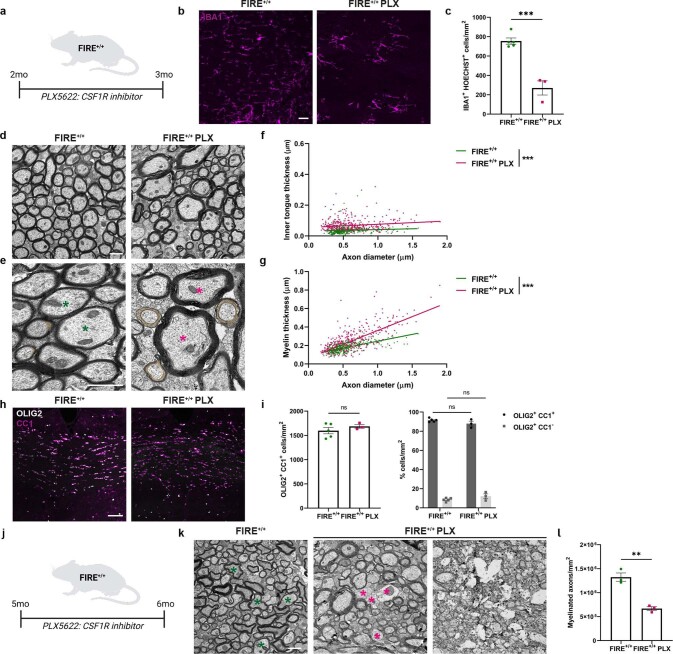
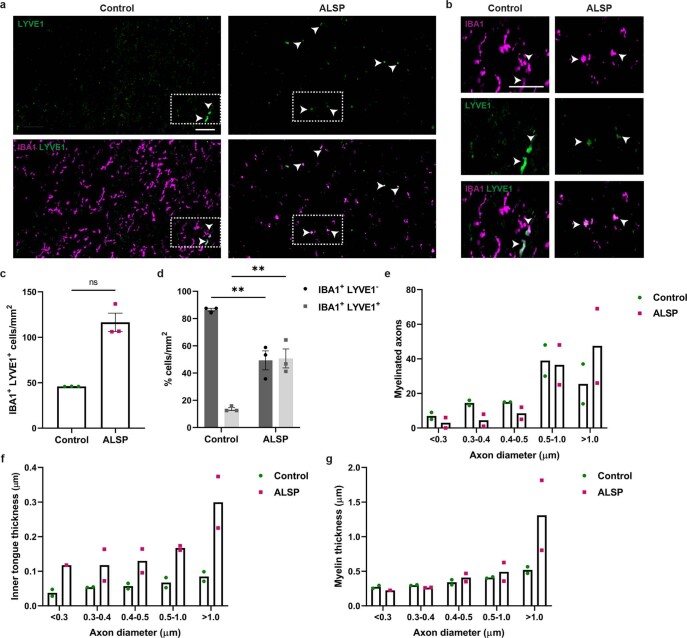
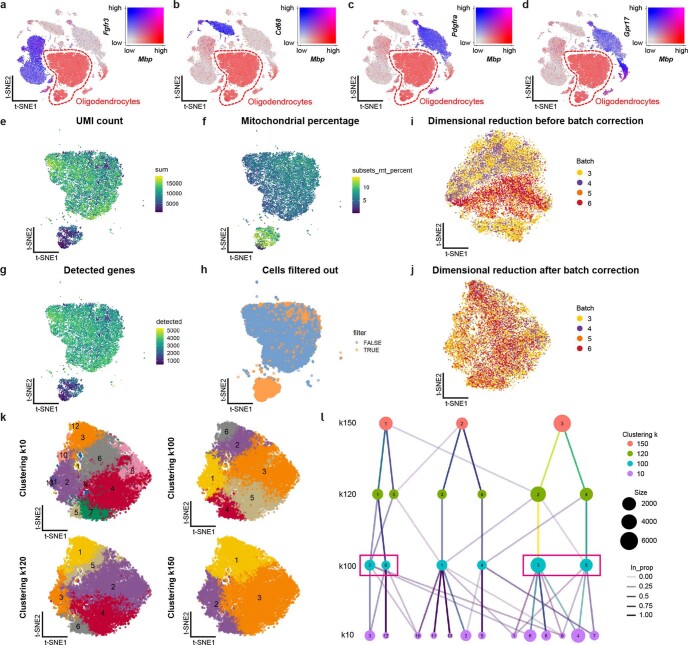
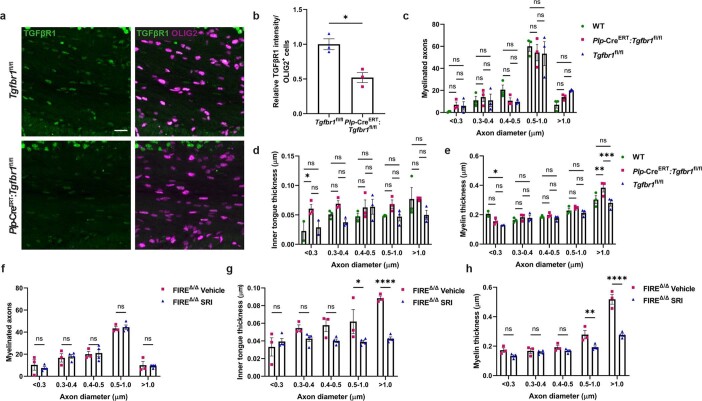
Myelin is required for the function of neuronal axons in the central nervous system, but the mechanisms that support myelin health are unclear. Although macrophages in the central nervous system have been implicated in myelin health1, it is unknown which macrophage populations are involved and which aspects they influence. Here we show that resident microglia are crucial for the maintenance of myelin health in adulthood in both mice and humans. We demonstrate that microglia are dispensable for developmental myelin ensheathment. However, they are required for subsequent regulation of myelin growth and associated cognitive function, and for preservation of myelin integrity by preventing its degeneration. We show that loss of myelin health due to the absence of microglia is associated with the appearance of a myelinating oligodendrocyte state with altered lipid metabolism. Moreover, this mechanism is regulated through disruption of the TGFβ1-TGFβR1 axis. Our findings highlight microglia as promising therapeutic targets for conditions in which myelin growth and integrity are dysregulated, such as in ageing and neurodegenerative disease2,3.


Conflict of interest statement

The authors declare no competing interests.

Figures

Fig. 1
Fig. 1. Microglia are not required for oligodendrocyte maturation and myelination.
a, FireΔ/Δ mice were generated using CRISPR9–Cas9 deletion of the Fire super-enhancer located in intron 2 of Csf1r. b, Images of microglia (TMEM119+; green) in corpus callosum samples from Fire+/+ and FireΔ/Δ mice at 1 month of age, counterstained with Hoechst (blue). c, Images of CNS macrophages (IBA1+; magenta) and perivascular (PV) macrophages (LYVE1+; white) in Fire+/+ and FireΔ/Δ mice. d, Magnified images from c of IBA1+LYVE1+ PV macrophages in Fire+/+ and FireΔ/Δ mice. e, Mean LYVE1+IBA1+ cells per mm2 ± s.e.m. in Fire+/+ and FireΔ/Δ mice. n = 7 mice per group. P = 0.1411, two-tailed unpaired Student’s t-test. f, Images of mature oligodendrocytes expressing both OLIG2 (green) and CC1 (white) in Fire+/+ and FireΔ/Δ mice. Inset shows magnified view. g, Mean OLIG2+CC1+ cells per mm2 ± s.e.m. in Fire+/+ and FireΔ/Δ mice. n = 7 mice per group. P = 0.1990, two-tailed unpaired Student’s t-test. h, Mean proportion of cells of the oligodendrocyte lineage (OLIG2+), which are mature (CC1+; black) or immature (CC1; grey) (±s.e.m.). n = 7 mice per group. CC1+, P =  0.9472; CC1, P = 0.9472; one-way analysis of variance (ANOVA) with Tukey’s multiple comparisons test. i, Images of corpus callosum from Fire+/+ and FireΔ/Δ mice stained for the myelin proteins MAG (green) and MBP (magenta) (left and middle) and imaged by electron microscopy (right). j, Mean number of myelinated axons per mm2 ± s.e.m. in corpus callosum from Fire+/+ and FireΔ/Δ mice. n = 3 Fire+/+ mice and 4 FireΔ/Δ mice. P = 0.5216, two-tailed unpaired Student’s t-test. k, Mean number of myelinated axons in corpus callosum from Fire+/+ and FireΔ/Δ mice per axon diameter. n = 3 Fire+/+ mice and 4 FireΔ/Δ mice. P = 0.9139, two-way ANOVA with Sidak’s multiple comparisons test. Scale bars, 25 µm (b,d,i (left and middle)), 75 µm (c,f) and 1 μm (i (right)). Source data
Fig. 2
Fig. 2. Microglia regulate myelin growth.
Assessments at 1 month (ah) and 3–4 months (io) of age in Fire+/+ and FireΔ/Δ mice. a, Images of myelin abnormalities (arrowheads) in FireΔ/Δ mice. b, Mean number of normally myelinated axons per mm2 ± s.e.m. n = 3 Fire+/+ mice and 4 FireΔ/Δ mice. **P = 0.008, two-tailed unpaired Student’s t-test. c, Mean proportion of axons with and without outfoldings and unravelling per mm2 ± s.e.m. n = 3 Fire+/+ mice and 4 FireΔ/Δ mice. With, ***P = 0.0006; without, ***P = 0.0006; one-way ANOVA with Tukey’s multiple comparisons test. d, Images of inner tongues (orange). e, Inner tongue thickness (µm) versus axon diameter. n = 200 axons per mouse, 3 Fire+/+ mice and 4 FireΔ/Δ mice. f, Mean inner tongue thickness per axon diameter. n = 3 Fire+/+ mice and 4 FireΔ/Δ mice. P = 0.1099 (<0.3 µm), 0.8933 (0.3–0.4 µm), >0.999 (0.4–0.5 µm), >0.999 (0.5–1.0 µm), 0.9989 (>1.0 µm), two-way ANOVA with Sidak’s multiple comparisons test. g, Images of myelin thickness (asterisks indicate axons of similar size). h, Myelin thickness versus axon diameter. n = 200 axons per mouse, 3 Fire+/+ mice and 4 FireΔ/Δ mice. ***P < 0.0001, simple linear regression of slopes. i, Images of myelin abnormalities (arrowheads) in FireΔ/Δ mice. j, Mean number of normally myelinated axons per mm2 ± s.e.m. n = 3 mice per group. *P = 0.0372, two-tailed unpaired Student’s t-test. k, Mean proportion of axons with and without outfoldings and unravelling per mm2 ± s.e.m. n = 3 mice per group. With, ****P < 0.0001; without, ****P < 0.0001; one-way ANOVA with Tukey’s multiple comparisons test. l, Images of inner tongues (orange). m, Inner tongue thickness versus axon diameter. n = 100 axons per mouse, 3 mice per group. ***P < 0.0001, simple linear regression of intercepts. n, Images of myelin thickness (asterisks indicate axons of similar size). o, Myelin thickness versus axon diameter. n = 100 axons per mouse, 3 mice per group. ***P < 0.0001, simple linear regression of slopes. Scale bars, 1 µm (a,d,g,i,l,n). Source data
Fig. 3
Fig. 3. Absence of microglia causes demyelination.
a, Images of substantial demyelination in the corpus callosum of 6-month-old FireΔ/Δ mice compared with age-matched Fire+/+ mice. Scale bar, 5 µm. b, Images of patchy demyelination in FireΔ/Δ mice compared with age-matched Fire+/+ mice. Asterisks indicate axons of similar size. Scale bar, 1 µm. c, Mean number of myelinated axons per mm2 ± s.e.m. n = 3 Fire+/+ mice and 4 FireΔ/Δ mice. *P = 0.0170, two-tailed unpaired Student’s t-test. d, Mean proportion of axons that are myelinated (black) and unmyelinated (grey) per mm2 ± s.e.m. n = 3 Fire+/+ mice and 4 FireΔ/Δ mice. Myelinated, **P = 0.0051; unmyelinated, **P = 0.0051; one-way ANOVA with Tukey’s multiple comparisons test. e, Inner tongue thickness versus axon diameter. n = 100 axons per mouse, 3 Fire+/+ mice and 4 FireΔ/Δ mice. *P = 0.0332, simple linear regression of slopes. f, Myelin thickness versus axon diameter. n = 100 axons per mouse, 3 Fire+/+ mice and 4 FireΔ/Δ mice. **P = 0.0062, simple linear regression of slopes. Source data
Fig. 4
Fig. 4. Reduction of microglia in human white matter is associated with hypermyelination and demyelination.
a, Images of IBA1+ macrophages (magenta) in human frontal white matter from individuals with ALSP and unaffected age-matched individuals, counterstained with Hoechst (cyan). b, Mean IBA1+ cells per mm2 ± s.e.m. in samples from unaffected individuals and individuals with ALSP. n = 3 samples per group. *P = 0.0197, two-tailed unpaired Student’s t-test. c, Images of frontal white matter in unaffected and ALSP samples (i). Asterisks indicate axons of similar size, arrowheads indicate myelin abnormalities. Panels (ii) and (iii) show enlarged inner tongues in ALSP (orange). Panel (iv) shows myelin outfoldings and unravelling in ALSP (arrow). d, Myelin thickness versus axon diameter. n = 100 axons per sample, n = 2 samples per group. **P = 0.002, simple linear regression of slopes. e, Inner tongue thickness (µm) versus axon diameter. n = 100 axons per sample, n = 2 samples per group. ***P < 0.0001, simple linear regression of intercepts. f, Images of extent of demyelination of frontal white matter in individuals with ALSP; 22-year-old individual and 40-year-old individual. Scale bars, 0.5  µm (c (ii)–(iv)), 1 µm (c (i)). 10 µm (f) or 50 µm (a). Source data
Fig. 5
Fig. 5. An oligodendrocyte state is enriched in FireΔ/Δ mice.
a, T-distributed stochastic neighbour embedding (t-SNE) plots of oligodendrocyte clusters in Fire+/+ and FireΔ/Δ mice: Oligo1 (yellow), Oligo2 (purple), Oligo3 (orange) and Oligo4 (red). b, Distribution of oligodendrocyte clusters between Fire+/+ (green) and FireΔ/Δ (magenta) mice. c, Oligodendrocyte cluster proportions in Fire+/+ and FireΔ/Δ mice. n = 4 mice per group. d, Top differentially expressed genes in Oligo1 compared with Oligo2 to Oligo4. Level of normalized expression of each gene is indicated by the heatmap: 1, red, −1, blue. Proportion of cells expressing each gene is indicated by the size of the circles in the plot. e, t-SNE projection of expression of C4b and Serpina3n. f, Images of OLIG2+ cells (white) expressing SERPINA3N (magenta) and counterstained with DAPI (blue) in the corpus callosum. g, Mean percentage of OLIG2+ cells expressing SERPINA3N ± s.e.m. in white matter (corpus callosum (CC) and fimbria) and grey matter (interbrain and hippocampus (Hpp)). n = 5 Fire+/+ mice and 3 FireΔ/Δ mice. CC and fimbria, ****P < 0.0001; interbrain and Hpp, P = 0.9989 and P > 0.9999, respectively; two-way ANOVA with Sidak’s multiple comparisons test. h, Lipidomics analysis represented as log2(fold change (FC)) in FireΔ/Δ mice versus Fire+/+ mice, with upregulated lipid species indicated in red and downregulated lipid species indicated in blue, ordered based on desaturation of fatty acids (double bonds) and total class value (0–6). Boxes indicate lipid species of interest. SM, sphingomyelins; CE, cholesterol esters; CER, ceramides; DCER, dihydroceramides; HexCER, hexosylceramides; TG, triaglycerides; DG, diacylglycerides; PC, phosphatidylcholine; LPC, lysophosphatidylcholine; PC-O, 1-alkyl,2-acylphosphatidylcholines; PC-P, 1-alkenyl,2-acylphosphatidylcholines; PE, phosphatidylethanolamine; LPE, lysophosphatidylethanolamine; PE-O, 1-alkyl,2-acylphosphatidylethanolamines; PE-P, 1-alkenyl,2-acylphosphatidylethanolamines; PG, phosphatidylglycerol; P I, phosphatidylinositol; PS, phosphatidylserine. n = 3 mice per group. One-sample t-test of log2(FC) against a value of 0: SM-0, **P = 0.0058; SM-3, *P = 0.0202; SM-0–6, *P = 0.0347; CE-2, *P = 0.0384; CE-6, *P = 0.0474; CE-0–6, *P = 0.0276; CER-1, *P = 0.0171; TG-1, *P = 0.0301; TG-2, *P = 0.0116; TG-3, *P = 0.0432; TG-0–6, *P = 0.0412; LPC-0, *P = 0.0415; PG-6, **P = 0.0055; PS-2, *P = 0.0459. Source data
Fig. 6
Fig. 6. TGFβR1 signalling regulates myelin integrity.
a, TGFβ1 levels (pg µg–1 ± s.e.m.) in corpus callosum normalized to the respective total protein. n = 7 mice per group. *P = 0.0150, two-tailed unpaired Student’s t-test. b, Images of OLIG2+ cells (green) expressing TGFβR1 (white), (arrowheads) in 1-month-old mice. c, Mean OLIG2+TGFβR1+ cells ± s.e.m. n = 4 mice per group. *P = 0.0144, two-tailed unpaired Student’s t-test. d, Mean percentage of OLIG2+ cells that are TGFβR1+ (black) or TGFβR1 (grey) (± s.e.m.), *P = 0.0120 and *P = 0.0120, respectively, n = 3 mice per group. One-way ANOVA with Tukey’s multiple comparisons test. e, Mice were treated with tamoxifen from P14 to P18 then assessed at 1 month. f, Images of PlpcreERT;Tgfbr1fl/fl mice versus control. g, Images of PlpcreERT;Tgfbr1fl/fl mice, indicating enlarged inner tongues (orange) and hypermyelination (asterisks) compared with control. h, Inner tongue thickness versus axon diameter. n = 100 axons per mouse, 3 mice per group. ***P < 0.0001, simple linear regression of intercepts. PlpcreERT;Tgfbr1fl/fl versus wild type and versus Tgfbr1fl/fl, ***P < 0.0001; wild type versus Tgfbr1fl/fl, P = 0.3228; Kruskal–Wallis with Dunn’s multiple comparisons test. i, Myelin thickness versus axon diameter. n = 100 axons per mouse, 3 mice per group. ***P < 0.0001, simple linear regression of slopes. PlpcreERT;Tgfbr1fl/fl versus wild type, ***P = 0.0008 and versus Tgfbr1fl/fl, ***P = 0.0001; wild type versus Tgfbr1fl/fl, P > 0.9999 Kruskal–Wallis with Dunn’s multiple comparisons test. j, FireΔ/Δ mice were treated with SRI-011381 hydrochloride (SRI; 30 mg kg–1) or vehicle from 2–3 months of age. k, Images of FireΔ/Δ mice treated with vehicle or SRI-011381. l, Images of FireΔ/Δ mice treated with vehicle or SRI-011381 indicating inner tongue size (orange) and myelin thickness (asterisks). m, Inner tongue thickness versus axon diameter. n = 100 axons per mouse, and n = 3 vehicle treated and 4 SRI treated. ***P < 0.0001, simple linear regression of slopes. Vehicle versus SRI and versus Fire+/+, ***P < 0.0001; SRI versus Fire+/+, P = 0.0519, Kruskal–Wallis with Dunn’s multiple comparisons test. n, Myelin thickness versus axon diameter. n = 100 axons per mouse, and n = 3 vehicle treated and 4 SRI treated. ***P < 0.0001, simple linear regression of slopes. Vehicle versus SRI and versus Fire+/+, ***P < 0.0001; SRI versus Fire+/+, P > 0.9999, Kruskal–Wallis with Dunn’s multiple comparisons test. Scale bars, 1 µm (f,g,k,l) or 25 µm (b). Source data
Extended Data Fig. 1
Extended Data Fig. 1. Characterisation of FIREΔ/Δ mouse.
a) Images of perivascular macrophages (CD206+; magenta) in association with blood vessels (CD31+; white)(arrows) in FIRE+/+ and FIREΔ/Δ mouse corpus callosum at 1 month of age. Scale bar, 25 μm. b) Images of perivascular macrophages (LYVE1+ CD68+) at 3-4 months and 6 months of age in corpus callosum. Scale bar, 75 µm. c) Mean density of LYVE1+ CD68+ cells/mm2 ± s.e.m. at 3-4 months and 6 months of age. Non-significant, P > 0.9999 and 0.7698, Mann Whitney and 2-tailed unpaired Student’s t-test, respectively. At 3-4 months, n = 5 FIRE+/+ and 4 FIREΔ/Δ mice, at 6 months, n = 5 FIRE+/+ and 3 FIREΔ/Δ mice. d) Flow cytometry gating strategy for assessment of non-microglial myeloid cells (including BAMs; CD11b+ CD45hi) for panels (e) and (f). e) Intensity of expression of CSF1R in FIRE+/+ and FIREΔ/Δ mice in CD11b+CD45lo microglia (MG) versus CD11b+CD45hi myeloid cells. f) Mean Fluorescence Intensity (MFI) of CSF1R ± s.e.m. in non-microglial myeloid cells (including BAMs) in FIRE+/+ and FIREΔ/Δ mice. ****P < 0.0001, 2-tailed unpaired Student’s t-test. n = 4 FIRE+/+ and 5 FIREΔ/Δ mice g) Images of astrocytes (SOX9; green; GFAP+; magenta) at 1 month of age in the corpus callosum. Scale bar, 75 μm. Inset shows magnified view of double positive cells. Scale bar, 25 μm. h) Mean SOX9+ GFAP+ cells/mm2 ± s.e.m. at 1 month of age in the corpus callosum. n = 5 mice per group. Non-significant, P = 0.4799, 2-tailed unpaired Student’s t-test. Source data
Extended Data Fig. 2
Extended Data Fig. 2. Myelin protein and axonal assessment in the FIREΔ/Δ mouse.
a) Mean pixel intensity of MAG and MBP ± s.e.m. in corpus callosum at 1 month of age. Non-significant, P = 0.6482 and 0.1097 respectively, 2-tailed unpaired Student’s t-test. n = 5 mice/group. b) Images of CNPase, MOG, and PLP (white) in corpus callosum at 1 month of age. Scale bar, 75 μm. c) Mean pixel intensity of CNPase, MOG, and PLP ± s.e.m. in corpus callosum at 1 month of age. Non-significant, P = 0.9758, 0.5699 and 0.4551 respectively, 2-tailed unpaired Student’s t-test. n = 5 mice/group. d) Images of MBP (magenta) and MAG (green) in cerebellum at 1 month of age. Scale bar, 75 µm. e) Mean pixel intensity of MBP and MAG ± s.e.m. in cerebellum at 1 month of age. Non-significant, P = 0.3067 and 0.5462 respectively, 2-tailed unpaired Student’s t-test. n = 5 mice/group. f) Images of neurofilament (NF; green) in corpus callosum at 1 month of age. Scale bar, 75 μm. g) Mean pixel intensity of NF ± s.e.m. in corpus callosum at 1 month of age. Non-significant, P = 0.4623, 2-tailed unpaired Student’s t-test. n = 5 FIRE+/+ and 6 FIREΔ/Δ. h) Images of axonal spheroids in corpus callosum of FIREΔ/Δ mice at 3-4 months and 6 months, indicated with arrows. Scale bar, 2 μm and 1 µm, respectively. Source data
Extended Data Fig. 3
Extended Data Fig. 3. Comparison of myelin across time points.
a) Myelin thickness/axon diameter (µm) in FIRE+/+ mice at 1, 3-4, and 6 months of age. ****P < 0.0001, Kruskal-Wallis with Dunn’s multiple comparisons test. n = 3 mice/group. b) Myelin thickness/axon diameter (µm) in FIREΔ/Δ mice at 1, 3-4, and 6 months of age. ****P < 0.0001, ns P = 0.9232, Kruskal-Wallis with Dunn’s multiple comparisons test. 1 month: n = 3 FIRE+/+ and 4 FIREΔ/Δ; 3-4 months: n = 3 mice/group; 6 months: n = 3 FIRE+/+ and 4 FIREΔ/Δ. c) Myelin thickness/axon diameter (µm) in FIRE+/+ and FIREΔ/Δ mice at 1, 3-4, and 6 months of age. Table of P values from Kruskal-Wallis with Dunn’s multiple comparisons test, 1 month: n = 3 FIRE+/+ and 4 FIREΔ/Δ mice; 3-4 months: n = 3 mice/group; 6 months: n = 3 FIRE+/+ and 4 FIREΔ/Δ. d) Inner tongue thickness/axon diameter (µm) in FIRE+/+ and FIREΔ/Δ mice at 1, 3-4, and 6 months of age. Table of P values from Kruskal-Wallis with Dunn’s multiple comparisons test,1 month: n = 3 FIRE+/+ and 4 FIREΔ/Δ mice; 3-4 months: n = 3 mice/group; 6 months: n = 3 FIRE+/+ and 4 FIREΔ/Δ. e) Mean myelin thickness (µm)/axon diameter bin ± s.e.m. in FIRE+/+ and FIREΔ/Δ mice at 1, 3-4, and 6 months of age.1 month: n = 3 FIRE+/+ and 4 FIREΔ/Δ mice; 3-4 months: n = 3 mice/group; 6 months: n = 3 FIRE+/+ and 4 FIREΔ/Δ. f) Mean inner tongue thickness (µm)/axon diameter bin ± s.e.m. in FIRE+/+ and FIREΔ/Δ mice at 1, 3-4, and 6 months of age. 1 month: n = 3 FIRE+/+ and 4 FIREΔ/Δ mice; 3-4 months: n = 3 mice/group; 6 months: n = 3 FIRE+/+ and 4 FIREΔ/Δ. Source data
Extended Data Fig. 4
Extended Data Fig. 4. Learning and memory encoding unimpaired, but cognitive flexibility is compromised, in the FIREΔ/Δ mouse.
a) Training phase of Barnes maze: mice learn to locate Target hole 1 (orange) with underlying escape chamber in spatial learning and memory retrieval trials. Mice tested were 2–4 months of age, with a median age of 119 days old (FIRE+/+) and 120 days old (FIREΔ/Δ). b) Mean primary latency (sec) ± s.e.m. over 6 training days. n = 13 FIRE+/+ mice and 10 FIREΔ/Δ. Non-significant between genotypes across all training days, Day 1: **P = 0.0011; Day 2: P = 0.9787; Day 3: P = 0.9627; Day 4: P = 0.9574; Day 5: P = 0.9990; Day 6: P > 0.9999, Repeated measures 2-way ANOVA with Sidak’s multiple comparisons test. c) Mean primary errors ± s.e.m. during training phase. n = 13 FIRE+/+ mice and 10 FIREΔ/Δ mice. Non-significant, Day 1: P = 0.9649; Day 2: P = 0.5968; Day 3: P = 0.8884; Day 4: P = 0.6028; Day 5: P = 0.9215; Day 6: P = 0.9437, Repeated measures 2-way ANOVA with Sidak’s multiple comparisons test. d) Mean percentage of time spent in the target quadrant± s.e.m., n = 13 FIRE+/+ and 10 FIREΔ/Δ. Dotted line indicates 25% chance. Non-significant between genotypes, 1hr: P = 0.7337; 3d: P > 0.9999, 2-way ANOVA with Sidak’s multiple comparisons test. e) Mean number of nose pokes into holes during 1hr probe test ± s.e.m., n = 13 FIRE+/+mice and 9 FIREΔ/Δ mice. Target **P = 0.0019, 2-way ANOVA with Sidak’s multiple comparisons test. f) Mean number of nose pokes into holes during 3d probe test ± s.e.m., n = 13 FIRE+/+mice and 9 FIREΔ/Δ mice. Non-significant, P = 0.9329, 2-way ANOVA with Sidak’s multiple comparisons test. g) Reversal phase: Target hole 2 (blue) is 180° from the original target; mice require cognitive flexibility to adapt to the new target. h) Mean primary latency (sec) ± s.e.m. over 3 training days. n = 13 FIRE+/+ and 9 FIREΔ/Δ. Non-significant across all training days between genotypes, Day 1: P = 0.9999; Day 2: P = 0.5186; Day 3: P = 0.9622, Repeated measures 2-way ANOVA with Sidak’s multiple comparisons test. i) Mean primary errors ± s.e.m. during reversal days. n = 13 FIRE+/+ and 9 FIREΔ/Δ. Day 1: *P = 0.0488, Day 2: *P = 0.0142, Day 3: P = 0.6727, Repeated measures 2-way ANOVA with Sidak’s multiple comparisons test. j) Mean percentage of time spent in the target quadrant during reversal probe test ± s.e.m. n = 13 FIRE+/+ mice and 9 FIREΔ/Δ mice. Dotted line indicates 25% chance. Non-significant, P = 0.6933, 2-tailed unpaired Student’s t-test. k) Mean number of nose pokes into holes during reversal probe test ± s.e.m. n = 13 FIRE+/+ mice and 9 FIREΔ/Δ mice. Non-significant P = 0.9657, 2-way ANOVA with Sidak’s multiple comparisons test. l) Schematic of Open Field test. m) Total distance travelled (m) during 10-min Open Field test ± s.e.m. n = 37 mice: n = 15 FIRE+/+ mice (7 young, 8 middle-aged); n = 22 FIREΔ/Δ mice (12 young, 10 middle-aged). Young mice =  4–8 weeks of age, Middle aged mice = 11–13 months of age. Non-significant, Young: P = 0.9997; Middle-aged: P > 0.999, 2-way ANOVA. n) Percentage (%) of time spent in the centre of the arena during Open Field test ± s.e.m. n = 37 mice: n = 15 FIRE+/+ mice (7 young, 8 middle-aged); n = 22 FIREΔ/Δ mice (12 young, 10 middle-aged). Young mice = 4–8 weeks of age, Middle aged mice = 11–13 months of age. Non-significant, Young: P = 0.7899; Middle-aged: P > 0.9995, 2-way ANOVA. o) Mean distance travelled (m) during training days ± s.e.m. n = 13 FIRE+/+ mice and 9 FIREΔ/Δ mice. Non-significant, P = 0.9607, >0.9999, >0.9999, 0.9955, 0.6583, 0.6034, Repeated measures 2-way ANOVA with Sidak’s multiple comparisons test. p) Mean distance travelled (m) during reversal days ± s.e.m. n = 13 FIRE+/+ mice and 9 FIREΔ/Δ mice. Non-significant, P = 0.7856, 0.9784, 0.8626, Repeated measures 2-way ANOVA with Sidak’s multiple comparisons test. q) Mean speed (m/s) during training days ± s.e.m. n = 13 FIRE+/+ mice and 9 FIREΔ/Δ mice. Non-significant, P = 0.9998, >0.9999, 0.6667, 0.9995, 0.9831, 0.9995, Repeated measures 2-way ANOVA with Sidak’s multiple comparisons test. r) Mean speed (m/s) during reversal days ± s.e.m. n = 13 FIRE+/+ mice and 9 FIREΔ/Δ mice. Non-significant, P = > 0.9999, 0.9940, 0.1561, Repeated measures 2-way ANOVA with Sidak’s multiple comparisons test. Source data
Extended Data Fig. 5
Extended Data Fig. 5. Post-learning oligodendrogenesis and myelination.
a) Representative images of EdU (magenta) and OLIG2 (white) double positive cells (arrows), with magnified view of dotted outline. Scale bars, 25 µm. b) Mean OLIG2+ EdU+ cells/mm2 ± s.e.m. n = 9 FIRE+/+ mice and 4 FIREΔ/Δ mice. Non-significant, P = 0.9696, 2-tailed unpaired Student’s t-test. c) Mean proportion of OLIG2+ EdU+ cells which are mature oligodendrocytes (CC1+; black) or immature lineage cells (CC1-; grey) ± s.e.m. n = 9 FIRE+/+ mice and 4 FIREΔ/Δ mice. Non-significant, CC1+: P > 0.9999; CC1-: P > 0.9999, 1-way ANOVA with Tukey’s multiple comparisons test. d) Representative images of EdU+ (magenta) CC1+ (green) OLIG2+ (white) triple positive cells (arrows). Scale bar, 25 µm. e) Images of corpus callosum 6 weeks post cognitive testing. Scale bar, 1 µm. f) Mean number of myelinated axons/mm2 ± s.e.m. in untrained versus trained mice. n = 3 mice/group in untrained category, 4 trained FIRE+/+ mice and 6 trained FIREΔ/Δ mice. FIRE+/+ mice *P = 0.0364, FIREΔ/Δ mice non-significant, P = 0.8537, 2-tailed unpaired Student’s t-test. g) Mean percentage increase in myelinated axons in trained FIRE+/+ and FIREΔ/Δ mice. n = 3 mice per group in untrained category, 4 trained FIRE+/+ mice and 6 trained FIREΔ/Δ mice. h) Correlation between mean myelinated axons per mm2 and reversal day 1 (RD1) primary errors or average primary errors in FIRE+/+ and FIREΔ/Δ mice. Each data point represents an individual mouse. n = 4 FIRE+/+ and 6 trained FIREΔ/Δ mice. Source data
Extended Data Fig. 6
Extended Data Fig. 6. Demyelination in FIREΔ/Δ mice.
a) Images of MAG (green) and PLP (magenta) at 6 months of age. Scale bar, 75 µm. b) Mean pixel intensity of MAG ± s.e.m. in corpus callosum at 6 months. Non-significant, P = 0.4335, 2-tailed unpaired Student’s t-test. n = 5 FIRE+/+ and 3 FIREΔ/Δ. c) Mean pixel intensity of PLP ± s.e.m. in corpus callosum at 6 months. Non-significant, P = 0.3471, 2-tailed unpaired Student’s t-test. n = 5 FIRE+/+ mice and 3 FIREΔ/Δ mice. d) Mean inner tongue thickness (µm)/axon diameter bin ± s.e.m. at 6 months of age. n = 3 FIRE+/+ and 4 FIREΔ/Δ mice. Non-significant, P = 0.4837, 2-tailed unpaired Student’s t-test. Mean myelin thickness (µm)/axon diameter bin ± s.e.m. at 6 months. n = 3 FIRE+/+ and 4 FIREΔ/Δ mice. >1 µm: *P = 0.0263, 2-tailed unpaired Student’s t-test. e) Images of mature oligodendrocytes co-expressing OLIG2 (white) and CC1 (magenta) at 6 months of age. Scale bar, 75 µm. f) Mean OLIG2+ CC1+ cells/mm2 ± s.e.m. n = 5 FIRE+/+ and 3 FIREΔ/Δ. Non-significant, P = 0.6400, 2-tailed unpaired Student’s t-test. Mean proportion of cells of the oligodendrocyte lineage (OLIG2+) which are mature (CC1+; black) or immature (CC1-; grey) ± s.e.m. n = 5 FIRE+/+ and 3 FIREΔ/Δ. Non-significant, CC1+: P = 0.9938; CC1-: ns P = 0.9938, 1-way ANOVA with Tukey’s multiple comparisons test. g) Images of mature oligodendrocytes co-expressing OLIG2 (white) and CC1 (magenta) at 3-4 months of age. Scale bar, 75 µm. h) Mean OLIG2+ CC1+ cells/mm2 ± s.e.m. n = 5 mice/group. Non-significant, P = 0.9825, 2-tailed unpaired Student’s t-test. Mean proportion of cells of the oligodendrocyte lineage (OLIG2+) which are mature (CC1+; black) or immature (CC1-; grey) ± s.e.m. n = 5 mice per group. Non-significant, CC1+: P = 0.7076; CC1-: P = 0.7076, 1-way ANOVA with Tukey’s multiple comparisons test. i) Images of FIRE+/+ and FIREΔ/Δ mouse corpus callosum at 4.5 months of age indicating onset of demyelination in the latter (magenta asterisks), examples of myelinated axons of medium-large calibre indicated by green asterisks. Scale bars, 5 µm and 1 µm. j) Mean number of myelinated axons/mm2 ± s.e.m. n = 3 mice/group. **P = 0.0042, 2-tailed unpaired Student’s t-test. k) Mean myelin thickness per small (<0.6 µm) or medium-large (>0.6 µm) axon diameter bin ± s.e.m. at 3-4 months of age. n = 3 mice/group. <0.6 µm: non-significant, P = 0.8978; >0.6 µm: *P = 0.0491, 2-way ANOVA with Sidak’s multiple comparisons test. l) Mean of diameters (0.7290 µm) of demyelinated axons per representative image ± s.e.m. in FIREΔ/Δ mice. n = 3 mice. Source data
Extended Data Fig. 7
Extended Data Fig. 7. Microglia depletion in adulthood causes hypermyelination and demyelination.
a) Adult FIRE+/+ mice were fed the CSF1R inhibitor PLX5622 in the diet from 2 to 3 months of age. b) Representative images of IBA1+ cells (magenta) in the corpus callosum of 3-month old FIRE+/+ mice on normal diet versus PLX5622 (PLX) diet from 2 to 3 months of age. Scale bar, 25 µm. c) Density of IBA1+ cells/mm2 ± s.e.m. in FIRE+/+ mice on normal diet versus PLX diet at 3 months of age. n = 5 mice on normal diet and 3 mice on PLX diet, ***P = 0.0004, 2-tailed unpaired Student’s t-test, d) Representative images of hypermyelination in the corpus callosum following PLX administration from 2 to 3 months of age. Scale bar, 1 µm. e) Representative images of enlarged inner tongues (orange) and thicker myelin (asterisks) following PLX administration from 2 to 3 months of age. Scale bar, 1 µm. f) Inner tongue thickness (µm) versus axon diameter in FIRE+/+ mice on normal diet or PLX diet from 2 to 3 months of age. n = 100 axons/mouse. n = 3 mice on normal diet and 4 mice on PLX diet. ***P < 0.0001, simple linear regression of intercepts. g) Myelin thickness (µm) versus axon diameter in FIRE+/+ mice on normal diet or PLX diet from 2 to 3 months of age. n = 100 axons per mouse. n = 5 mice on normal diet and 3 mice on PLX diet. ***P < 0.0001, simple linear regression of slopes. h) Images of mature oligodendrocytes co-expressing OLIG2 (white) and CC1 (magenta) in FIRE+/+ mice on normal diet or PLX diet from 2 to 3 months of age. Scale bar, 75 µm. i) Mean OLIG2+ CC1+ cells per mm2 ± s.e.m. in FIRE+/+ mice on normal diet or PLX diet from 2 to 3 months of age. Non-significant, P = 0.3645, 2-tailed unpaired Student’s t-test. Mean proportion of cells of the oligodendrocyte lineage (OLIG2+) which are mature (CC1+; black) or immature (CC1-; grey) ± s.e.m at 3 months. Non-significant, CC1+: P = 0.3779; CC1-: P = 0.3779, 1-way ANOVA with Tukey’s multiple comparisons test. n = 5 mice on normal diet and 3 mice on PLX diet. j) Adult FIRE+/+ mice were fed the CSF1R inhibitor PLX5622 in the diet from 5 to 6-months of age. k) Images of demyelination in the corpus callosum of 6-month-old FIRE+/+ mice (asterisks) following PLX administration from 5 to 6-months of age. Scale bar, 1 µm. l) Mean number of myelinated axons ± s.e.m. in of FIRE+/+ mice on normal diet versus PLX diet from 5 to 6-months of age. n = 3 mice/group. **P = 0.0024, 2-tailed unpaired Student’s t-test. Source data
Extended Data Fig. 8
Extended Data Fig. 8. Characterization of ALSP tissue.
a) Images of LYVE1+ (green; top) and IBA1+ (magenta) LYVE1+ macrophages (bottom) in human ALSP and age-matched unaffected control frontal white matter. Scale bar, 50 μm. b) Magnified images from dotted outlines in (A) of IBA1+ LYVE1+ perivascular macrophages in human ALSP and unaffected age-matched control frontal white matter. Scale bar, 50 μm. c) Mean IBA1+ LYVE1+ cells/mm2 ± s.e.m. in ALSP and unaffected control. n = 3 cases/group. P = 0.1000, Mann Whitney test. d) Mean proportion of IBA1+ cells which are perivascular macrophages (LYVE1+; grey) or microglia (LYVE1-; black) ± s.e.m. in ALSP and unaffected control. n = 3 cases/group. **P = 0.0034, 1-way ANOVA with Tukey’s multiple comparisons test. e) Mean number of myelinated axons/axon diameter bin in unaffected control and ALSP patients. n = 2 cases/group. f) Mean inner tongue thickness (µm)/axon diameter bin in Control and ALSP patients. n = 2 cases/group. g) Mean myelin thickness (µm)/axon diameter bin in unaffected control and ALSP patients. n = 2 cases/group. Source data
Extended Data Fig. 9
Extended Data Fig. 9. Single-cell RNA sequencing analysis of FIREΔ/Δ mice.
(a-d) t-SNE (t-distributed stochastic neighbour embedding) plots of pre-filtered dataset showing oligodendrocytes (Mbp) versus other cell types: a) Fgfr3 (astrocytes), b) Cd68 (microglia/macrophages), c) Pdgfra (OPCs) and d) Gpr17 (committed oligodendrocyte precursors), with outline around subsetted oligodendrocytes. (e-h) t-SNE plots where each point is a cell coloured according to: (e) Sum of unique molecular identifiers (UMI) counted, (f) Percentage of mitochondrial genes, (g) Number of detected genes, (h) Filtering: In blue are the cells that were kept for subsequent analysis, and in orange the ones filtered out on the basis of UMIs and percentage of mitochondrial genes, see methods for thresholds. (i) t-SNE plot without any batch correction. Each point is a cell that is coloured according to its batch of origin (yellow = 3, purple = 4, orange = 5, red = 6). (j) t-SNE plot after batch correction with fastMNN. Each point is a cell that is coloured according to its batch of origin (yellow = 3, purple = 4, orange = 5, red = 6). (k) Clustering with four different resolutions, obtained by modifying the number of nearest neighbours (k). Each resolution is represented in a separate t-SNE plot. (l) Clustree plot created using clustree v0.4.4. Each level in this plot denotes a different resolution used for clustering cells. Lines denote contributions of cells from previous clusters, and the size of the circles represents the number of cells. The final clusters were obtained by merging clusters 2 and 6 and clusters 3 and 5 (pink boxes) from the clustering with k = 100 (light blue).
Extended Data Fig. 10
Extended Data Fig. 10. Influence of TGFβ receptor manipulation on myelin health.
a) Images of TGFβR1 expression (green) by OLIG2+ cells (magenta) in corpus callosum of Tgfbr1fl/fl and Plp-creERT;Tgfbr1fl/fl mice, who received 4-hydroxy tamoxifen (OHT; 100 mg/kg/day, P14–18) and were sacrificed at P28. Scale bar, 20 µm. b) Mean relative TGFβR1 intensity ± s.e.m. per OLIG2+ cell in Tgfbr1fl/fl and Plp-creER;:Tgfbr1fl/fl mice. n = 3 mice/group. *P = 0.011, 2-tailed unpaired Student’s t-test. c) Mean number of myelinated axons/axon diameter bin ± s.e.m. in wildtype mice (WT; green), Plp-creERT;Tgfbr1fl/fl mice (magenta) and Tgfbr1fl/fl mice (blue). n = 3 mice/group. Non-significant, P = 0.3001, 2-way ANOVA with Sidak’s multiple comparisons test. d) Mean inner tongue thickness (µm)/axon diameter bin ± s.e.m. in wildtype mice (WT; green), Plp-creERT;Tgfbr1fl/fl mice (magenta) and Tgfbr1fl/fl mice (blue). n-3 mice/group. <0.3 µm WT vs. Plp-creERT;Tgfbr1fl/fl: *P = 0.03950, 2-way ANOVA with Sidak’s multiple comparisons test. e) Mean myelin tongue thickness (µm)/axon diameter bin ± s.e.m. in wildtype mice (WT; green), Plp-creERT;Tgfbr1fl/fl mice (magenta) and Tgfbr1fl/fl mice (blue). n = 3 mice/group. <0.3 µm WT vs. Tgfbr1fl/fl: *P = 0.0291; >1 µm WT vs. Plp-creERT;Tgfbr1fl/fl **P = 0.0037 and Plp-creERT;Tgfbr1fl/fl vs. Tgfbr1fl/fl ***P = 0.0003, 2-way ANOVA with Sidak’s multiple comparisons test. f) Mean number of myelinated axons ± s.e.m./axon diameter bin in 3-month-old FIREΔ/Δ mice following treatment with vehicle control or SRI-011381 hydrochloride from 2 to 3 months of age. n = 3 Vehicle-treated and 4 SRI-treated mice. Non-significant, P = 0.9202, 2-way ANOVA with Sidak’s multiple comparisons test. g) Mean inner tongue thickness (µm) ± s.e.m. per axon diameter bin in 3-month-old FIREΔ/Δ mice following treatment with vehicle control or SRI-011381 hydrochloride from 2 to 3 months of age. n = 3 Vehicle-treated and 4 SRI-treated mice. 0.5-1.0 µm: *P = 0.0334, >1 µm: ****P < 0.0001, 2-way ANOVA with Sidak’s multiple comparisons test. h) Mean myelin thickness (µm) ± s.e.m./axon diameter bin in 3-month-old FIREΔ/Δ mice following treatment with vehicle control or SRI-011381 hydrochloride from 2 to 3 months of age. n = 3 Vehicle-treated and 4 SRI-treated mice. 0.5-1.0 µm: **P = 0.0027, >1 µm: ****P < 0.0001, 2-way ANOVA with Sidak’s multiple comparisons test. Source data

References

    1. McNamara NB, Miron VE. Microglia in developing white matter and perinatal brain injury. Neurosci. Lett. 2020;714:134539. doi: 10.1016/j.neulet.2019.134539. - DOI - PubMed
    1. Romanelli E, et al. Myelinosome formation represents an early stage of oligodendrocyte damage in multiple sclerosis and its animal model. Nat. Commun. 2016;7:13275. doi: 10.1038/ncomms13275. - DOI - PMC - PubMed
    1. Peters A. The effects of normal aging on myelin and nerve fibers: a review. J Neurocytol. 2002;31:581–593. doi: 10.1023/A:1025731309829. - DOI - PubMed
    1. Williamson JM, Lyons DA. Myelin dynamics throughout life: an ever-changing landscape? Front. Cell Neurosci. 2018;12:424. doi: 10.3389/fncel.2018.00424. - DOI - PMC - PubMed
    1. Safaiyan S, et al. Age-related myelin degradation burdens the clearance function of microglia during aging. Nat. Neurosci. 2016;19:995–998. doi: 10.1038/nn.4325. - DOI - PMC - PubMed

Publication types

MeSH terms

Substances