. 2023 Apr;19(3):767-783.
doi: 10.1007/s12015-022-10490-1. Epub 2022 Dec 15.

Maternal Undernutrition Induces Cell Signalling and Metabolic Dysfunction in Undifferentiated Mouse Embryonic Stem Cells

Affiliations

Maternal Undernutrition Induces Cell Signalling and Metabolic Dysfunction in Undifferentiated Mouse Embryonic Stem Cells

Pooja Khurana et al. Stem Cell Rev Rep. 2023 Apr.

Abstract

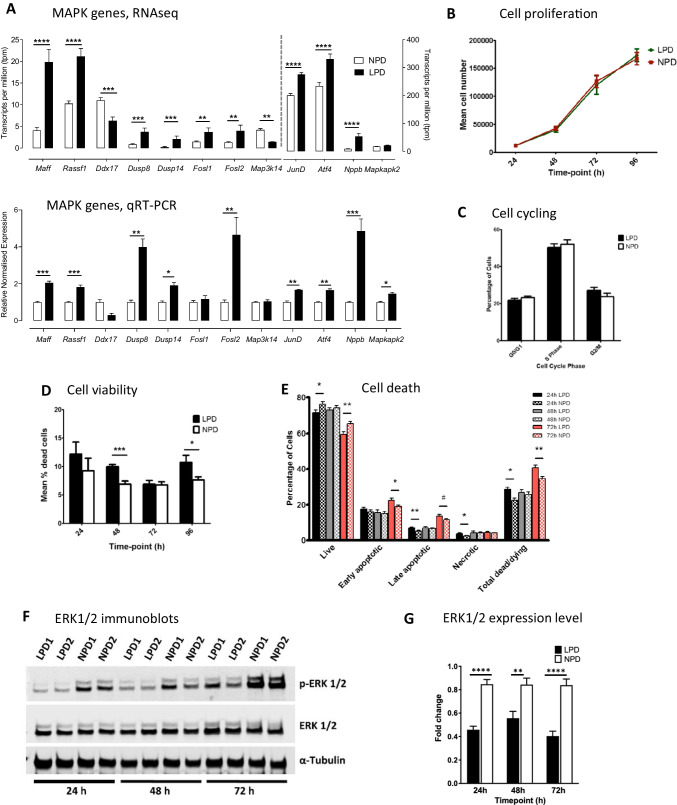
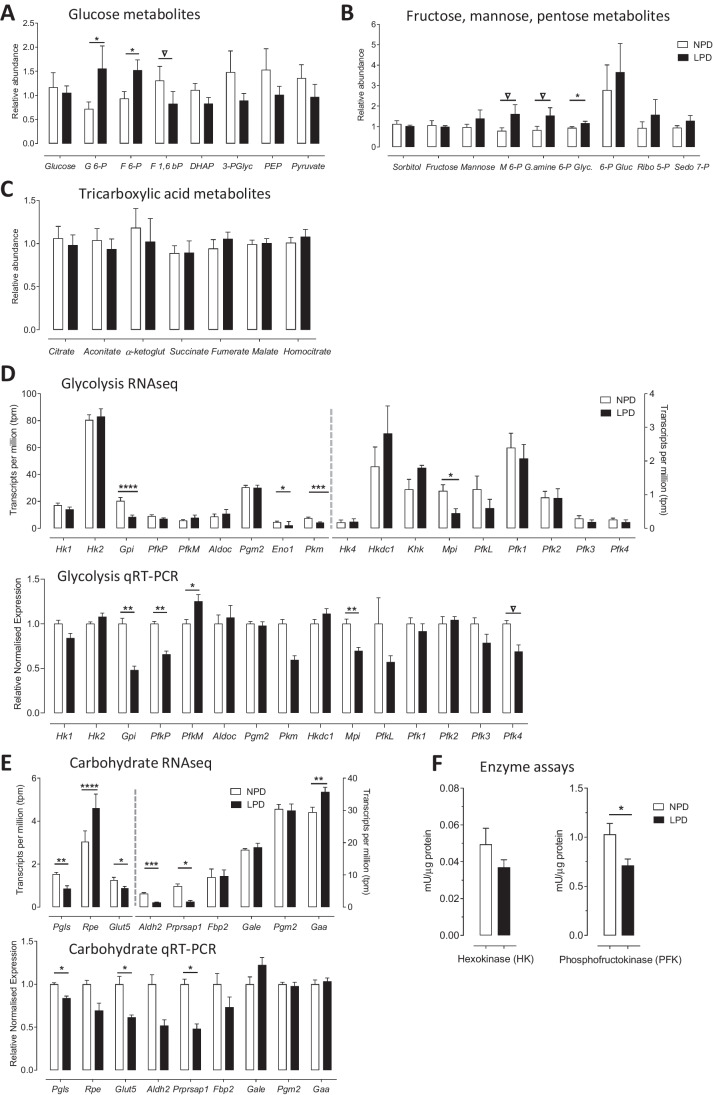
Peri-conceptional environment can induce permanent changes in embryo phenotype which alter development and associate with later disease susceptibility. Thus, mouse maternal low protein diet (LPD) fed exclusively during preimplantation is sufficient to lead to cardiovascular, metabolic and neurological dysfunction in adult offspring. Embryonic stem cell (ESC) lines were generated from LPD and control NPD C57BL/6 blastocysts and characterised by transcriptomics, metabolomics, bioinformatics and molecular/cellular studies to assess early potential mechanisms in dietary environmental programming. Previously, we showed these lines retain cellular and epigenetic characteristics of LPD and NPD embryos after several passages. Here, three main changes were identified in LPD ESC lines. First, their derivation capacity was reduced but pluripotency marker expression was similar to controls. Second, LPD lines had impaired Mitogen-activated protein kinase (MAPK) pathway with altered gene expression of several regulators (e.g., Maff, Rassf1, JunD), reduced ERK1/2 signalling capacity and poorer cell survival characteristics which may contribute to reduced derivation. Third, LPD lines had impaired glucose metabolism comprising reduced upstream enzyme expression (e.g., Gpi, Mpi) and accumulation of metabolites (e.g., glucose-6-P, fructose-6-P) above the phosphofructokinase (PFK) gateway with PFK enzyme activity reduced. ESC lines may therefore permit investigation of peri-conceptional programming mechanisms with reduced need for animal experimentation.

Keywords: Cell signalling; DOHaD; Glucose metabolism; MAPK pathway; Maternal low protein diet; Metabolomics; Mouse ES cells; RNAseq.


Conflict of interest statement

The authors have no conflicting or competing interests to declare that are relevant to the content of this article.

Figures

Fig. 1
Fig. 1
Effect of LPD on ESC line derivation and pluripotency. A Percentage (± SEM) of blastocysts yielding ESC lines. LPD, n = 100 blastocysts from 13 mothers; NPD, n = 93 blastocysts from 13 mothers. *P = 0.015. B Blastocyst outgrowth immunolabelling of GATA4, NANOG and OCT4 after culture for 2.5 d in ES cell medium. Scale bar = 50 µm. C, D Total number of ES cells (DAPI +) and proportion expressing specific lineage markers (C) and selected ratios (D) after 2.5 d culture in ES cell medium. LPD n = 29 blastocysts; NPD n = 35 blastocysts; data ± SEM; **P < 0.01, *P < 0.05
Fig. 2
Fig. 2
LPD causes impaired MAPK signalling with reduced survival and increased apoptosis in ESC lines. A RNAseq above and qRT-PCR analysis below of most differentially expressed MAPK components in undifferentiated LPD and NPD ESC lines (PN 8–12; n = 5) cultured in standard mESC medium (KnockOut DMEM + LIF + KO/SR). qPCR gene expression is normalised with 3 house keeping genes Sdha, Tbp and Tuba-1. Here, * = P < 0.05, ** = P < 0.01, *** = P < 0.001 and **** = P < 0.0001. B Proliferation rate of LPD and NPD ESC lines (P9-12) over 24 h intervals using trypan blue exclusion and haemocytometer counting. Data from 8 LPD or 9 NPD lines with mean ± SEM, each analysed in triplicate. C Cell cycle distribution of exponentially growing ESC lines (P10-12) 24 h after seeding, assayed by DNA quantitation using flow cytometry following PI staining and FlowJo software. Data from 10 ESC lines per treatment with mean ± SEM, each analysed in triplicate. D Cell viability assay. Mean percentage (± SEM) of dead cells from Trypan blue exclusion assay over 96 h culture (PN 11–13). LPD n = 8 ESC lines from 8 mothers; NPD n = 9 ESC lines from 7 mothers; ***P < 0.001, *P < 0.05. E Cell death assay. Percentage (± SEM) ESC lines (PN 11–12) after culture, annexin V and PI staining and flow cytometry discriminated as live, apoptotic and necrotic. LPD n = 8, 6, 7 lines at 24, 48 and 72 h; NPD n = 10, 9, 6 lines at 24, 48 and 72 h; **P < 0.01, *P < 0.05, #P < 0.1. F, G ERK1/2 immunoblots (F) and quantitation (p/total) (G) of ESC lines cultured up to 72 h. 13 + ESC lines per diet from minimum of 3 blots (independent experiments); α-tubulin used as loading control; ****P < 0.0001, **P = 0.0016. For antibody sources, see Supplementary Table 2
Fig. 3
Fig. 3
LPD impairs glycolytic and carbohydrate metabolism in undifferentiated LPD ESC lines. A-C Metabolomics analysis of mean concentrations (protein normalised) of key metabolites involved in (A) glycolysis, (B) fructose, mannose, pentose pathways, and (C) TCA pathways from lysates of undifferentiated male NPD and LPD mESCs (PN 10–12; n = 7) cultured in standard mESC medium (KnockOut DMEM + LIF + KO/SR). * P < 0.05, ▽ P < 0.1. G 6-P = glucose 6-phosphate; F 6-P = fructose 6-phosphate; F 1,6 bP = fructose 1,6-bisphosphate; DHAP = dihydroxyacetone phosphate; 3-PGlyc = 3-phosphoglycerate; PEP = phosphoenolpyruvate; M 6-P = mannose 6-phosphate; G.amine 6-P = glucosamine 6-phosphate; Glyc. = glycerate; 6-P Gluc = 6-phosphogluconate; Ribo 5-P = ribose 5-phosphate; Sedo 7-P = sedoheptulose-7-phosphate; -ketoglut = alpha-ketoglutarate. D, E RNAseq above and qRT-PCR analysis below of gene expression of glycolytic enzymes (D) and other carbohydrate metabolism regulators (E) in undifferentiated LPD and NPD ESC lines (PN 9–12; n = 5) cultured in standard mESC medium (KnockOut DMEM + LIF + KO/SR). qPCR gene expression is normalised with 3 house keeping genes Sdha, Tbp and Tuba-1. * = P < 0.05, ** = P < 0.01, *** = P < 0.001, **** = P < 0.0001, ▽ P < 0.1. Hk1, Hk2, Hk4 = hexokinase 1,2 or 4; Gpi = glucose phosphate isomerase; PfkP, PfkM, PfkL = phosphofructokinase P, M or L variants; Aldoc = aldolase C; Pkm = pyruvate kinase M; Hkdc1 = hexokinase domain containing 1; Khk = ketohexokinase; Mpi = mannose phosphate isomerase; Pfk1-4 = phosphofructokinase 1–4 variants; Pgls = phosphogluconolactonase; Rpe = ribulose-phosphate 3-epimerase; Glut5 (Slc2a5) = glucose transporter 5; Aldh2 = aldehyde dehydrogenase 2; Prprsap1 = phosphoribosyl pyrophosphate synthetase-associated protein 1; Fbp2 = fructose-bisphosphatase 2; Gale = UDP-galactose-4-epimerase; Pgm2 = phosphoglucomutase 2; Gaa = acid alpha-glucosidase. F Glycolytic enzyme activity assays on hexokinase (HK) and phosphofructokinase (PFK) from LPD and NPD ESC lines. Data, normalised by protein (BCA Protein Assay), presented as means ± SEMs based on n = 6 for PFK and n = 7 for HK analysis. *P = 0.029
Fig. 4
Fig. 4
Summary diagrams of changes in MAPK pathway and glycolytic pathways in LPD vs NPD ESC lines. A. MAPK. Changes in relevant MAPK pathway components at transcript, protein and phosphorylated state indicating possible origin of increased apoptosis. Red indicates increased and green reduced levels in LPD based upon outcome of transcriptomic and cellular studies. See Fig. 2 and text for abbreviations. B. Glycolysis. Changes in relevant RNA expression, metabolite levels, and downstream cellular / physiological phenotype are shown. Red indicates increased and green reduced levels in LPD based upon transcriptomic, metabolomic and cellular studies indicative of bottleneck at PFK and shown by reduced activity. Some metabolites at mean rather than significant levels, see text. See Fig. 3 and text for abbreviations

References

    1. Hanson MA, Gluckman PD. Early developmental conditioning of later health and disease: Physiology or pathophysiology? Physiological Reviews. 2014;94(4):1027–1076. doi: 10.1152/physrev.00029.2013. - DOI - PMC - PubMed
    1. Fleming TP, et al. Origins of lifetime health around the time of conception: Causes and consequences. Lancet. 2018;391(10132):1842–1852. doi: 10.1016/S0140-6736(18)30312-X. - DOI - PMC - PubMed
    1. Lane M, Robker RL, Robertson SA. Parenting from before conception. Science. 2014;345(6198):756–760. doi: 10.1126/science.1254400. - DOI - PubMed
    1. Fleming TP, et al. Environmental exposures around conception: developmental pathways leading to lifetime disease risk. International Journal of Environmental Research and Public Health. 2021;18(17):9380. doi: 10.3390/ijerph18179380. - DOI - PMC - PubMed
    1. Velazquez MA, Fleming TP, Watkins AJ. Periconceptional environment and the developmental origins of disease. Journal of Endocrinology. 2019;242(1):T33–t49. doi: 10.1530/JOE-18-0676. - DOI - PubMed

Publication types