. 2022 Dec 14;19(1):300.
doi: 10.1186/s12974-022-02659-9.

Models of microglia depletion and replenishment elicit protective effects to alleviate vascular and neuronal damage in the diabetic murine retina

Affiliations

Models of microglia depletion and replenishment elicit protective effects to alleviate vascular and neuronal damage in the diabetic murine retina

Kaira A Church et al. J Neuroinflammation. .

Abstract

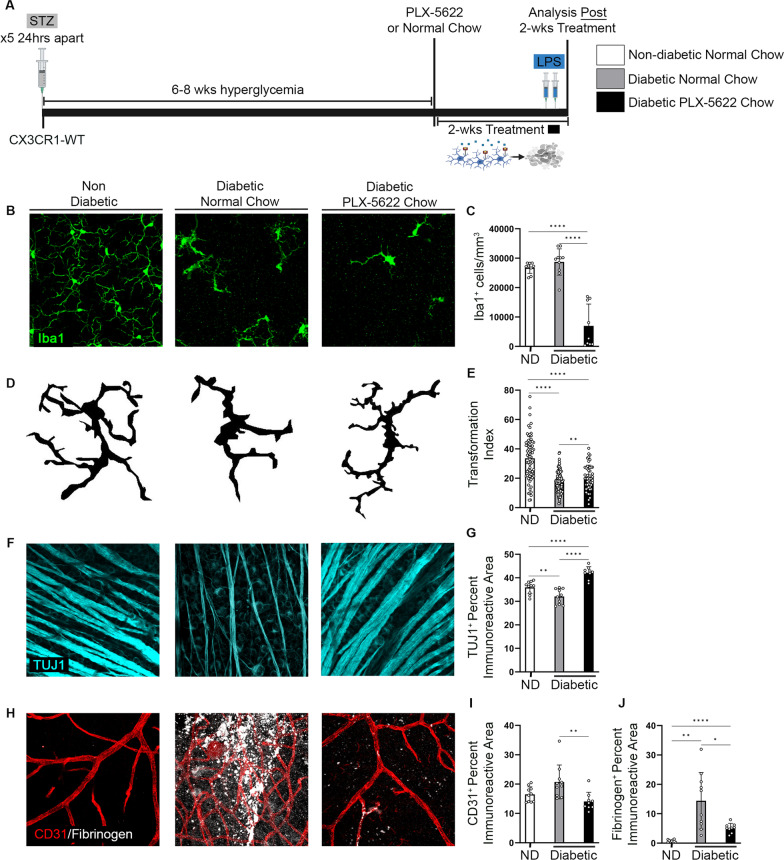
Microglia, the resident phagocytes of the retina, are believed to influence the development of retinopathy, but their exact contributions to vascular integrity and neuronal loss are unknown. Therefore, utilizing two models of microglia depletion, we aimed to deplete and repopulate microglia to clarify the contribution of microglia to neuronal loss and vascular damage in the diabetic retina in an STZ-induced model of hyperglycemia. Here, we report that 2 weeks exposure to diphtheria toxin (DTx) in diabetic CX3CR1CreER:R26iDTR transgenic mice induced a 62% increase in Iba1+ microglia associated with an increase in TUJ1+ axonal density and prevention of NeuN+RBPMS+ neuronal loss. Conversely, diabetic PBS controls exhibited robust TUJ1+ axonal and NeuN+RBPMS+ neuronal loss compared to non-diabetic controls. A 2-week recovery period from DTx was associated with a 40% reduction in angiogenesis and an 85% reduction in fibrinogen deposition into the diabetic retina in comparison to diabetic PBS-treated controls. Analysis of microglia morphology and marker expression revealed that following a 2-week recovery period microglia displayed a P2RY12+Ly6C- phenotype and high transformation index (TI) values complimented by a ramified-surveillant morphology closely resembling non-diabetic controls. In contrast, diabetic PBS-treated control mice displayed P2RY12+Ly6C+ microglia, with a 50% reduction in TI values with an amoeboid morphology. To validate these observations were due to microglia depletion, we used PLX-5622 to assess vascular and neuronal damage in the retinas of diabetic mice. Confocal microscopy revealed that PLX-5622 also induced an increase in TUJ1+ axonal density and prevented fibrinogen extravasation into the diabetic retina. mRNAseq gene expression analysis in retinal isolates revealed that PLX-5622-induced microglia depletion and repopulation induced a downregulation in genes associated with microglial activation and phagocytosis, B2m, Cx3cr1, and Trem2, and complement-associated synaptic pruning, C1qa, C1qb, and C1qc. Although the levels of microglia depletion induced with DTx in the CX3CR1CreER:R26iDTR model and those induced with the CSF-1R antagonists are distinct, our results suggest that microglia depletion and replenishment is neuroprotective by inducing the proliferation of a homeostatic microglia pool that supports neuronal and vascular integrity.

Keywords: Depletion; Diabetic retinopathy; Inflammation; Microglia; Repopulation.


Conflict of interest statement

AEC is an associate editor for the Journal of Neuroinflammation.

Figures

Fig. 1
Fig. 1
CX3CR1CRE−ER expression modulated by TAM is spatially and temporally controlled in microglia. A Experimental design to confirm that Cre penetrance targets CX3CR1-expressing cells in the retina and brain without affecting peripheral CX3CR1-expressing immune cells. CX3CreER:R26iTdT mice were injected once daily for 5 days with tamoxifen (TAM). One week and 3 weeks after the last TAM injection, flow cytometric analysis was performed on blood leukocytes to track the percentage of TdT+CD11b+CD45Hi leukocytes. At 6 weeks post-TAM administration, tissues were collected for flow cytometric and immunohistochemical analysis. B, C IHC analysis of brain and retinal tissues showing the density of TdT+Iba1+ cells/mm2 (B) and Iba1+ cells/mm2 (C) in vehicle and TAM-treated CX3CR1CreER:R26iTdT mice. D Confocal images of retinal tissues to visualize Iba1+ microglia (green) and TdTomato (red) in vehicle and TAM-treated CX3CR1CreER:R26iTdT mice. E Experimental design to validate the feasibility of depleting CNS-resident microglia without affecting peripheral CX3CR1-expressing immune cells. Four weeks following Cre recombinase induction with TAM (after the 5th TAM injection), CX3CR1Cre−ER:R26iDTR mice were administered 25 ng/g diphtheria toxin (DTx) once daily for 3 days. Tissue collection occurred 24 h after the last DTx injection. Control mice received PBS instead of DTx. F, G, Quantification of Iba1+ cells/mm3 (F) and TUJ1+ percent immunoreactive area (G) in the retinas of PBS and DTx treated CX3CR1CreER:R26iDTR mice. H Confocal images of the retina for Iba1+ (green), and TUJ1+ (white). Data represent mean ± SD, n = 4–7 mice per group where each dot represents an individual mouse. **P < 0.01, ****P < 0.0001 using Student’s t-test, with Welch’s correction
Fig. 2
Fig. 2
CX3CR1CRE−ER expression modulated by TAM does not alter peripheral immune profile in diabetic CX3CR1Cre−ER:R26iDTR mice. A Experimental design for 2-week DTx treatment in diabetic CX3CR1Cre−ER:R26iDTR mice. Diabetes was induced via streptozotocin (STZ) in CX3CR1CreER:R26iDTR mice 2 weeks after the last TAM injection. At 6–8 weeks of diabetes, mice received 3 daily doses of 25 ng/g DTx, followed by 1 dose of 25 ng/g DTx every 48 h for a total of 2 weeks. Tissues were collected immediately after the 2-week DTx treatment or after a 2-week recovery period. Control diabetic mice were administered PBS instead of DTx. B–G Flow cytometric quantification of CD45HiCD11b+SSCHi neutrophils (B), CD45HiCD11b+SSCLo macrophages (C), CD45HiCD11b+Ly6CLo tissue resident macrophages (D), CD45HiCD11b+Ly6CHi inflammatory macrophages (E), CD45HiCD11bCD11c+ conventional dendritic cells (F) and CD45HiCD11b+CD11c+ myeloid-derived dendritic cells (G). Data show mean ± SD, n = 4–9 mice per group where each dot represents an individual mouse. *P < 0.05, **P < 0.01, ****P < 0.0001 using Student’s t-test, with Welch’s correction
Fig. 3
Fig. 3
Amoeboid microglia proliferate and transition to a ramified state in the CX3CR1Cre−ER:R26iDTR retina. A, B Quantification of Iba1+ cells/mm3 (A) and confocal images of retinas for Iba1 (green) (B). C, D Quantification of EdU+ cells/mm3 within the Iba1+ cell population (C) and confocal images of retinas for Iba1 (green), EdU (red) and DAPI (blue) in diabetic-PBS and diabetic-DTx mice (D). E Transformation index in non-diabetic, and diabetic mice PBS and DTx-treated mice, n = 98 to 150 microglia per group where each dot represents an individual microglia cell and bars show mean ± SD. F Representation of cellular tracings from transformation index quantification. Data show mean ± SD, n = 5–9 mice per group where each dot represents an individual mouse (A, C). *P < 0.05, ***P < 0.001, ****P < 0.0001 using Student’s t-test, with Welch’s correction
Fig. 4
Fig. 4
Prolonged DTx exposure and recovery prevents neurodegeneration and vascular damage in the diabetic CX3CR1Cre−ER:R26iDTR retina. A Confocal images of retinal tissues stained for Iba1 (green), NeuN and RBPMS (red-top panel), TUJ1 (turquoise), GFAP (purple), CD31 (red-bottom panel) and fibrinogen (white) in non-diabetic diabetic-PBS, diabetic-DTx, diabetic PBS-recovery and diabetic DTx-recovery mice. B–F Quantification of retinal IHC analysis for GFAP+ immunoreactivity (B), NeuN+RBPMS+ cells/mm3 (C), and percent immunoreactive area for TUJ1 (D), CD31 (E), and fibrinogen (F). Data show mean ± SD, n = 4–9 mice per group where each dot represents an individual mouse. *P < 0.05, **P < 0.01, ***P < 0.001 ****P < 0.0001 using Student’s t-test, with Welch’s correction
Fig. 5
Fig. 5
PLX-5622 treatment prevents neurodegeneration and vascular damage in the diabetic CX3CR1-WT retina. A Experimental design to deplete microglia in 6–8 weeks diabetic CX3CR1-WT mice with PLX-5622. Diabetes was induced via streptozotocin (STZ) in CX3CR1-WT mice and at 6–8 weeks of diabetes, mice were fed PLX-5622 chow for 2 weeks. Tissues were collected immediately following the 2-week treatment. Diabetic control mice were fed normal chow (NC). B Confocal images of Iba1 (green) in retinas of non-diabetic, diabetic-normal chow and diabetic PLX-5622 chow mice. C Quantification of Iba1+ cells/mm3. D, E, Representation of Iba1+ cellular tracings (D) from transformation index quantification (E). F Confocal images of TUJ1 (turquoise) in retinas of non-diabetic, diabetic-normal chow and diabetic PLX-5622 treated mice. G Quantification of TUJ1+ percent immunoreactive area. H–J Confocal images of retinas stained for CD31 (red) and fibrinogen (white) (H) and image quantification of percent immunoreactive area for CD31 (I) and fibrinogen (J). Data show mean ± SD, n = 8–10 mice per group where each dot represents an individual mouse (C, G, I, J). Data are mean ± SD, n = 52–150 microglia per group where each dot represents an individual microglia cell from n = 4–10 mice (E). *P < 0.05, **P < 0.01, ***P < 0.001 ****P < 0.0001 using Student’s t-test, with Welch’s correction
Fig. 6
Fig. 6
Microglia depletion and repopulation resets the diabetic retinal transcriptome to closely resemble non-diabetic controls. A Experimental design to pharmacologically deplete and repopulate microglia using PLX-5622 for retinal mRNAseq analysis. Six weeks following STZ-induced diabetes, CX3CR1-WT mice were fed PLX-5622 for 2 weeks, followed by a 2-week recovery period. Diabetic control mice were fed normal chow. B–D, Differentially expressed genes (DEGs) analysis in diabetic mice before the treatment versus non-diabetic mice for total number of DEGs (B), analysis of DEGs associated with DR pathogenesis and microglial activation (C), and complement-mediated synaptic pruning and intermediate filament organization, visual cycle and wellness (D). E–G DEGs analysis in diabetic mice after PLX-5622 treatment versus diabetic normal chow mice for total number of DEGs (E), analysis of DEGs associated with DR pathogenesis and microglial activation (F), and complement-mediated synaptic pruning and intermediate filament organization, visual cycle and wellness (G). H–J DEGs analysis in diabetic mice after PLX-5622 recovery versus diabetic normal chow mice for total number of DEGs (H), analysis of DEGs associated with DR pathogenesis and microglial activation (I), and complement-mediated synaptic pruning and intermediate filament organization, visual cycle and wellness (J)

References

    1. Cecilia OM, José Alberto CG, José NP, Ernesto Germán CM, Ana Karen LC, Luis Miguel RP, et al. Oxidative stress as the main target in diabetic retinopathy pathophysiology. J Diabetes Res. 2019;2019:8562408. doi: 10.1155/2019/8562408. - DOI - PMC - PubMed
    1. Wang W, Lo ACY. Diabetic retinopathy: pathophysiology and treatments. Int J Mol Sci. 2018;19(6):1816. doi: 10.3390/ijms19061816. - DOI - PMC - PubMed
    1. Tremolada G, Del Turco C, Lattanzio R, Maestroni S, Maestroni A, Bandello F, et al. The role of angiogenesis in the development of proliferative diabetic retinopathy: impact of intravitreal anti-VEGF treatment. Exp Diabetes Res. 2012;2012:728325. doi: 10.1155/2012/728325. - DOI - PMC - PubMed
    1. Díaz-Coránguez M, Ramos C, Antonetti DA. The inner blood-retinal barrier: cellular basis and development. Vision Res. 2017;139:123–137. doi: 10.1016/j.visres.2017.05.009. - DOI - PMC - PubMed
    1. Rashid K, Akhtar-Schaefer I, Langmann T. Microglia in retinal degeneration. Front Immunol. 2019;10:1975. doi: 10.3389/fimmu.2019.01975. - DOI - PMC - PubMed