. 2023 Jan 17;122(2):310-321.
doi: 10.1016/j.bpj.2022.12.013. Epub 2022 Dec 14.

Assessment of models for calculating the hydrodynamic radius of intrinsically disordered proteins

Affiliations

Assessment of models for calculating the hydrodynamic radius of intrinsically disordered proteins

Francesco Pesce et al. Biophys J. .

Abstract

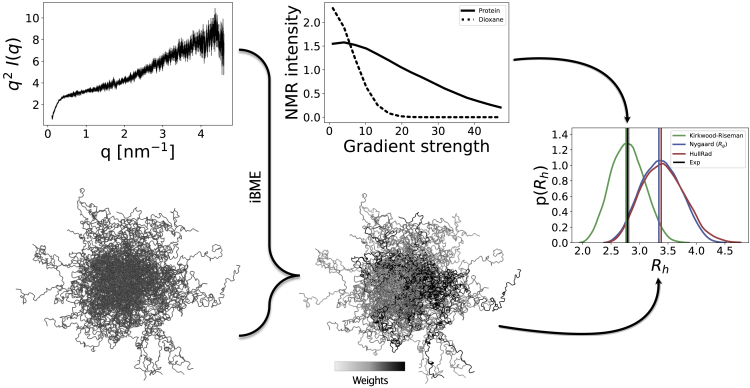
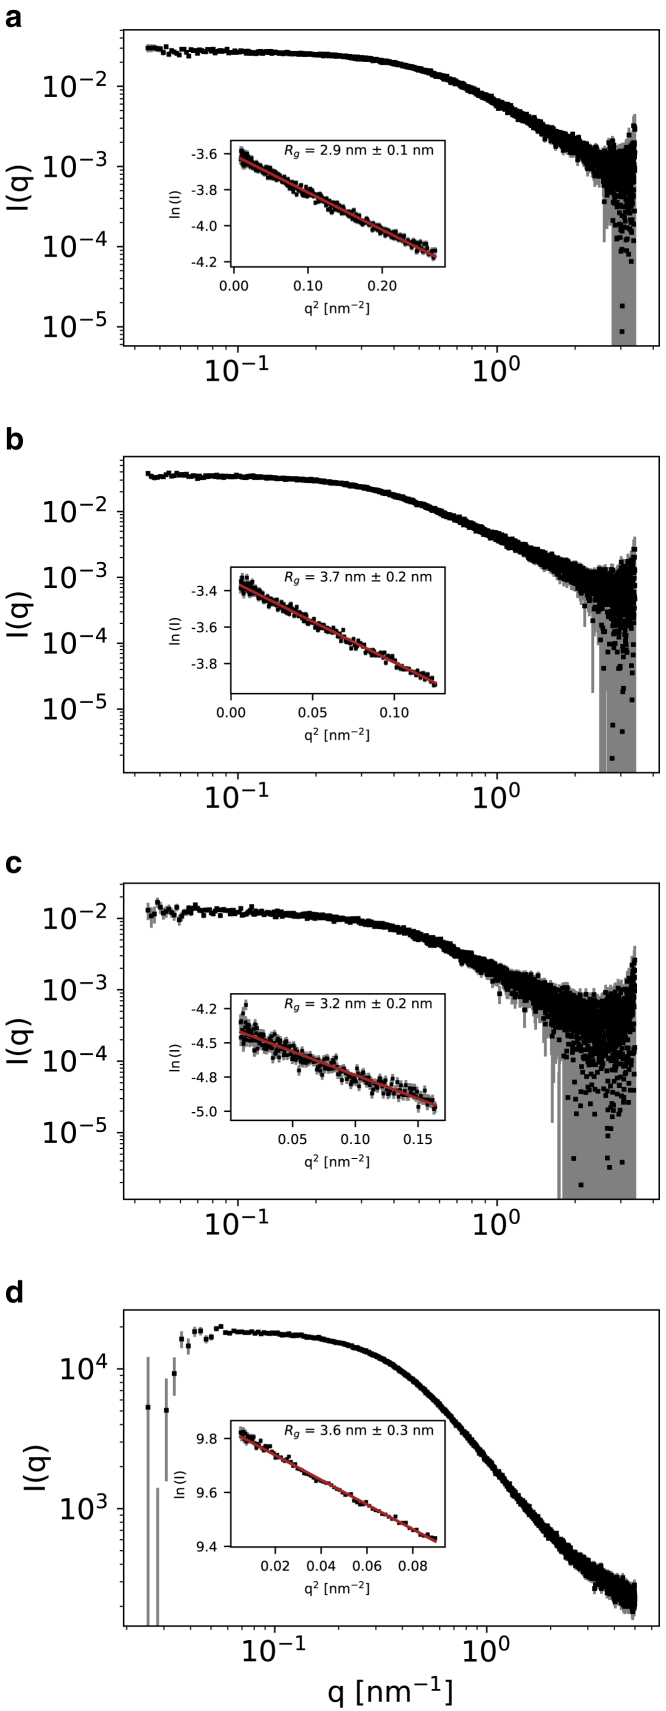
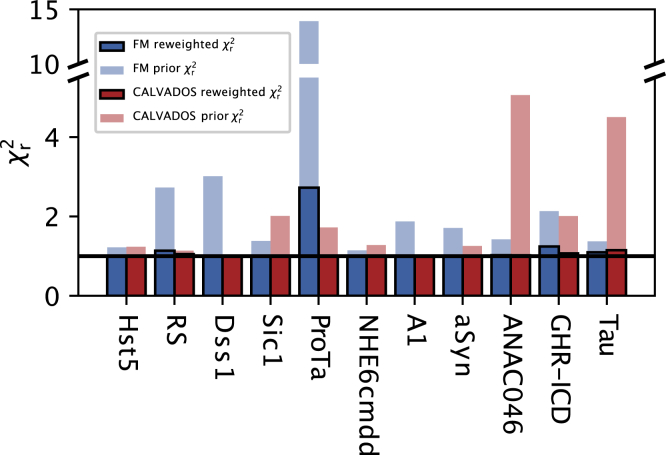
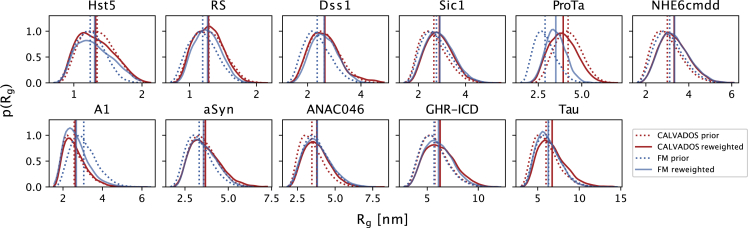
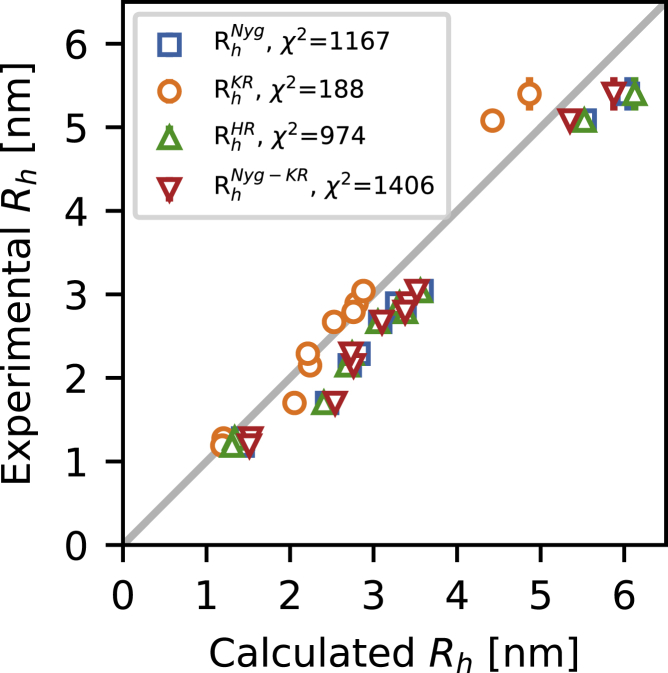
Diffusion measurements by pulsed-field gradient NMR and fluorescence correlation spectroscopy can be used to probe the hydrodynamic radius of proteins, which contains information about the overall dimension of a protein in solution. The comparison of this value with structural models of intrinsically disordered proteins is nonetheless impaired by the uncertainty of the accuracy of the methods for computing the hydrodynamic radius from atomic coordinates. To tackle this issue, we here build conformational ensembles of 11 intrinsically disordered proteins that we ensure are in agreement with measurements of compaction by small-angle x-ray scattering. We then use these ensembles to identify the forward model that more closely fits the radii derived from pulsed-field gradient NMR diffusion experiments. Of the models we examined, we find that the Kirkwood-Riseman equation provides the best description of the hydrodynamic radius probed by pulsed-field gradient NMR experiments. While some minor discrepancies remain, our results enable better use of measurements of the hydrodynamic radius in integrative modeling and for force field benchmarking and parameterization.


Conflict of interest statement

Declaration of interests The authors declare no competing interests.

Figures

Figure 1
Figure 1
Overview of the approach. For each of the 11 proteins, we computationally generate a conformational ensemble and optimize the weights of each conformer to get a reweighted ensemble consistent with SAXS data. Then we compute the Rh from the reweighted ensemble with different forward models and compare the values to the Rh determined experimentally by PFG NMR experiments. To see this figure in color, go online.
Figure 2
Figure 2
Experimental SAXS profiles for (a) Dss1, (b) ProTα, (c) NHE6cmdd, and (d) ANAC046. Experimental intensities are shown as black squares with gray error bars (representing the experimentally determined errors rescaled as described in the materials and methods). The inserts show the linear fit (red line) in the Guinier region (identified with the autorg tool of the ATSAS package (40)) for each profile, and the resulting Rg value. To see this figure in color, go online.
Figure 3
Figure 3
Results of reweighting the conformational ensembles generated with FM and CALVADOS against SAXS data. The χr2 of the prior ensembles (before reweighting) are shown as partially transparent bars, while the χr2 of the reweighted ensembles are shown as solid bars (blue for FM and red for CALVADOS). The horizontal black line delineates χr2= 1, that, given the use of scaled errors for experimental SAXS intensities (see materials and methods), denotes reweighted ensembles in good agreement with the experimental data and devoid of overfitting. To see this figure in color, go online.
Figure 4
Figure 4
Probability distributions of the Rg calculated from the ensembles generated by CALVADOS (in red) and FM (in blue), both before (dotted lines) and after (solid lines) reweighting the ensembles against SAXS data. To see this figure in color, go online.
Figure 5
Figure 5
Ensemble-averaged Rh values calculated from the SAXS-reweighted CALVADOS ensembles, compared with the Rh determined by PFG NMR diffusion (error bars represent the standard error from fitting the NMR data). We tested four approaches to calculate the Rh from atomic coordinates: the Rg-dependent Nygaard equation (RhNyg, in blue), the Kirkwood-Riseman equation (RhKR, in orange), HullRad (RhHR, in green), and the Nygaard correction to the Kirkwood-Riseman equation (RhNygKR, in red). To see this figure in color, go online.

References

    1. Wright P.E., Dyson H.J. Intrinsically disordered proteins in cellular signalling and regulation. Nat. Rev. Mol. Cell Biol. 2015;16:18–29. http://www.nature.com/articles/nrm3920 - PMC - PubMed
    1. Babu M.M. The contribution of intrinsically disordered regions to protein function, cellular complexity, and human disease. Biochem. Soc. Trans. 2016;44:1185–1200. doi: 10.1042/BST20160172. - DOI - PMC - PubMed
    1. Bottaro S., Bengtsen T., Lindorff-Larsen K. Springer US; 2020. Integrating Molecular Simulation and Experimental Data: A Bayesian/Maximum Entropy Reweighting Approach; pp. 219–240. - DOI - PubMed
    1. Orioli S., Larsen A.H., et al. Lindorff-Larsen K. In: Computational Approaches for Understanding Dynamical Systems: Protein Folding and Assembly. Strodel B., Barz B., editors. Academic Press; 2020. Chapter Three - how to learn from inconsistencies: integrating molecular simulations with experimental data; pp. 123–176.https://www.sciencedirect.com/science/article/pii/S1877117319302121 Volume 170 of Progress in Molecular Biology and Translational Science. - PubMed
    1. Bonomi M., Camilloni C., et al. Vendruscolo M. Metainference: a Bayesian inference method for heterogeneous systems. Sci. Adv. 2016;2:e1501177. doi: 10.1126/sciadv.1501177. - DOI - PMC - PubMed

Publication types

Substances

LinkOut - more resources