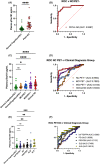
Plasma phosphorylated tau181 predicts cognitive and functional decline
- PMID: 36518085
- PMCID: PMC9852389
- DOI: 10.1002/acn3.51695
Plasma phosphorylated tau181 predicts cognitive and functional decline
Abstract
Objective: To determine if plasma tau phosphorylated at threonine 181 (p-tau181) distinguishes pathology-confirmed Alzheimer's disease (AD) from normal cognition (NC) adults, to test if p-tau181 predicts cognitive and functional decline, and to validate findings in an external cohort.
Methods: Thirty-one neuropathology-confirmed AD cases, participants with clinical diagnoses of mild cognitive impairment (MCI, N = 91) or AD dementia (N = 64), and NC (N = 241) had plasma collected at study entry. The clinical diagnosis groups had annual cognitive (Mini-Mental State Examination, MMSE) and functional (Clinical Dementia Rating Scale, CDR) measures. NC (N = 70), MCI (N = 75), and AD dementia (N = 50) cases from the Alzheimer's Disease Neuroimaging Initiative (ADNI) were used as a validation cohort. Plasma p-tau181 was measured using the Quanterix SiMoA HD-X platform.
Results: Plasma p-tau181 differentiated pathology-confirmed AD from NC with negative amyloid PET scans with an AUC of 0.93. A cut point of 3.44 pg/mL (maximum Youden Index) had a sensitivity of 0.77, specificity of 0.96. p-Tau181 values above the cut point were associated with the faster rate of decline in MMSE in AD dementia and MCI and a shorter time to a clinically significant functional decline in all groups. In a subset of MCI cases from ADNI, p-tau181 values above the cut point associated with faster rate of decline in MMSE, and a shorter time to a clinically significant functional decline and conversion to dementia.
Interpretation: Plasma p-tau181 differentiates AD pathology cases from NC with high accuracy. Higher levels of plasma p-tau181 are associated with faster cognitive and functional decline.
© 2022 The Authors. Annals of Clinical and Translational Neurology published by Wiley Periodicals LLC on behalf of American Neurological Association.
Conflict of interest statement
The authors report no conflicts of interest.
Figures


Similar articles
-
Microglial Activation, Tau Pathology, and Neurodegeneration Biomarkers Predict Longitudinal Cognitive Decline in Alzheimer's Disease Continuum.Front Aging Neurosci. 2022 Jun 30;14:848180. doi: 10.3389/fnagi.2022.848180. eCollection 2022. Front Aging Neurosci. 2022. PMID: 35847667 Free PMC article.
-
Blood phosphorylated tau 181 as a biomarker for Alzheimer's disease: a diagnostic performance and prediction modelling study using data from four prospective cohorts.Lancet Neurol. 2020 May;19(5):422-433. doi: 10.1016/S1474-4422(20)30071-5. Lancet Neurol. 2020. PMID: 32333900
-
Diagnostic performance and prediction of clinical progression of plasma phospho-tau181 in the Alzheimer's Disease Neuroimaging Initiative.Mol Psychiatry. 2021 Feb;26(2):429-442. doi: 10.1038/s41380-020-00923-z. Epub 2020 Oct 26. Mol Psychiatry. 2021. PMID: 33106600
-
Phosphorylated tau in Alzheimer's disease.Adv Clin Chem. 2023;116:31-111. doi: 10.1016/bs.acc.2023.05.001. Epub 2023 Jun 9. Adv Clin Chem. 2023. PMID: 37852722
-
Blood phosphorylated Tau181 reliably differentiates amyloid-positive from amyloid-negative subjects in the Alzheimer's disease continuum: A systematic review and meta-analysis.Alzheimers Dement (Amst). 2025 Jan 16;17(1):e70068. doi: 10.1002/dad2.70068. eCollection 2025 Jan-Mar. Alzheimers Dement (Amst). 2025. PMID: 39822285 Free PMC article. Review.
Cited by
-
Plasma GFAP associates with secondary Alzheimer's pathology in Lewy body disease.Ann Clin Transl Neurol. 2023 May;10(5):802-813. doi: 10.1002/acn3.51768. Epub 2023 Mar 31. Ann Clin Transl Neurol. 2023. PMID: 37000892 Free PMC article.
-
Medial temporal lobe gray matter microstructure in preclinical Alzheimer's disease.Alzheimers Dement. 2024 Jun;20(6):4147-4158. doi: 10.1002/alz.13832. Epub 2024 May 15. Alzheimers Dement. 2024. PMID: 38747539 Free PMC article.
-
ADNI Biomarker Core: A review of progress since 2004 and future challenges.Alzheimers Dement. 2025 Jan;21(1):e14264. doi: 10.1002/alz.14264. Epub 2024 Nov 30. Alzheimers Dement. 2025. PMID: 39614747 Free PMC article. Review.
-
The Alzheimer's Disease Neuroimaging Initiative in the era of Alzheimer's disease treatment: A review of ADNI studies from 2021 to 2022.Alzheimers Dement. 2024 Jan;20(1):652-694. doi: 10.1002/alz.13449. Epub 2023 Sep 12. Alzheimers Dement. 2024. PMID: 37698424 Free PMC article. Review.
-
Electrochemical Technology for the Detection of Tau Proteins as a Biomarker of Alzheimer's Disease in Blood.Biosensors (Basel). 2025 Feb 4;15(2):85. doi: 10.3390/bios15020085. Biosensors (Basel). 2025. PMID: 39996987 Free PMC article. Review.
References
-
- Alzheimer's Disease International . World Alzheimer Report 2018 – The State of the Art of Dementia Research: New Frontiers. Alzheimer's Disease International (ADI); 2018.
-
- Wallin ÅK, Blennow K, Zetterberg H, Londos E, Minthon L, Hansson O. CSF biomarkers predict a more malignant outcome in Alzheimer disease. Neurology. 2010;74(19):1531‐1537. - PubMed
Publication types
MeSH terms
Substances
Grants and funding
LinkOut - more resources
Full Text Sources
Medical
Molecular Biology Databases
