. 2022 Dec 5:2022:7724220.
doi: 10.1155/2022/7724220. eCollection 2022.

A Prognostic Model of Seven Immune Genes to Predict Overall Survival in Childhood Acute Myeloid Leukemia

Affiliations

A Prognostic Model of Seven Immune Genes to Predict Overall Survival in Childhood Acute Myeloid Leukemia

Yan Luo et al. Biomed Res Int. .

Abstract

Background: Acute myeloid leukemia (AML) is one of the most common hematological malignancies and accounts for about 20% of childhood leukemias. Currently, immunotherapy is one of the recommended treatment schemes for recurrent AML patients to improve their survival rates. Nonetheless, low remission and high mortality rates are observed in recurrent AML and challenge the prognosis of AML patients. To address this problem, we aimed to establish and verify a reliable prognostic risk model using immune-related genes to improve the prognostic evaluation and recommendation for personalized treatment of AML.

Methods: Transcriptome data and clinical data were acquired from the TARGET database while immune genes were sourced from InnateDB and ImmPort Shared databases. The mRNA expression profile matrix of immune genes from 62 normal samples and 1408 AML cases was extracted from the transcriptome data and subjected to differential expression (DE) analysis. The entire cohort of DE immune genes was randomly divided into the test group and training group. The prognostic model associated with immune genes was constructed using the training group. The test group and entire cohort were employed for model validation. Lastly, we analyzed the potential clinical application of the model and its association with immune cell infiltration.

Results: In total, 751 DE immune genes were differentially regulated, including 552 upregulated and 199 downregulated. Based on these DE genes, we developed and validated a prognostic risk model composed of seven immune genes, GDF1, TPM2, IL1R1, PSMD4, IL5RA, DHCR24, and IL12RB2. This model is able to predict the 5-year survival rate more accurately compared with age, gender, and risk stratification. Further analysis showed that CD8+ T-cell contents and neutrophil infiltration decreased but macrophage infiltration increased as the risk score increased.

Conclusions: A seven-immune gene model of AML was developed and validated. We propose this model as an independent prognostic variable able to estimate the 5-year survival rate. In addition, the model can also reflect the immune microenvironment of AML patients.


Conflict of interest statement

The authors declare that there are no conflicts of interest regarding the publication of this manuscript.

Figures

Figure 1
Figure 1
DE immune genes. (a) Volcano plot of the DE genes (the blue line at the top of the figure represented the control group and the pink line represented AML). (b) Heatmap of the DE genes (red and green dots indicated upregulated and downregulated genes, respectively). (c) GO analysis of the DE immune genes for biological process (BP), cellular component (cc), as well as molecular function (MF) terms. (d) KEGG analysis of the DE immune genes.
Figure 2
Figure 2
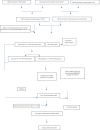
The diagram of experimental analysis process.
Figure 3
Figure 3
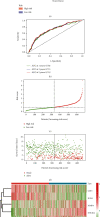
Establishment of the prognostic risk model according to the training group. (a) Overall survival. (b) Time-dependent receiver operating characteristic (ROC) curve analysis. (c) Risk score distribution. (d) Survival status scatter plot. (e) Heatmap of risk genes.
Figure 4
Figure 4
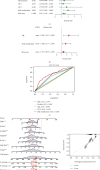
(a) Univariate Cox analysis. (b) Multivariate Cox analysis. (c) ROC cure analysis of prognostic variables in the training group at five years. (d) A nomogram to predict the 1-, 3-, and 5- year OS in AML patients in the training group. (e) Calibration plot of nomogram in the training group.
Figure 5
Figure 5
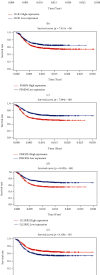
Validation of the prognostic risk model in the test group and entire cohort. (a) OS in the test group. (b) OS in the entire cohort. (c) Risk score distribution in the test group. (d) Risk score distribution in the entire cohort. (e) Survival status scatter plot in the test group. (f) Survival status scatter plot for the entire cohort. (g) Heatmap of risk genes in the test group. (h) Heatmap of risk genes in the entire cohort. (i) ROC curve analysis in the test group. (j) ROC curve analysis in the entire cohort. (k) Univariate Cox analysis in the test group. (l) Univariate Cox analysis in the entire cohort. (m) Multivariate Cox analysis in the test group. (n) Multivariate Cox analysis in the entire cohort. (o) A nomogram to predict 1-, 3-, and 5- year OS in AML patients in the test group. (p) A nomogram to predict 1-, 3-, and 5- year OS in AML patients in the entire cohort. (q) Calibration plot of nomogram in the test group. (r) Calibration plot of nomogram in the entire cohort.
Figure 6
Figure 6
Prognostic value and mRNA expression of the model within the entire cohort. (a)–(g) Relationship between TPM2, IL1R1, PSMD4, DHCR24, IL12RB2, IL5RA, GDF1, and OS in AML.
Figure 7
Figure 7
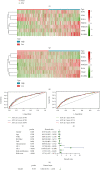
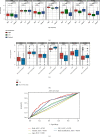
Independent prognostic value of the model for the entire cohort. (a) Relationship between genes in the model and risk stratification. (b) Relationship between genes in the model and CR2. (c) ROC analyses of the prognostic factors.
Figure 8
Figure 8
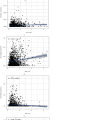
Association analysis between the risk score and immune cell infiltration. (a) B cells. (b) CD4+ T cells. (c) Dendritic cells. (d) Macrophages. (e) Neutrophils. (f) CD8+ T cells.
Figure 9
Figure 9
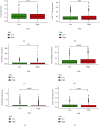
The different expression analysis between the high and low risk score of immune cell infiltration. (a) B cells. (b) CD4+ T cells. (c) Dendritic cells. (d) Macrophages. (e) Neutrophils. (f) CD8+ T cells.

References

    1. Li G., Gao Y., Li K., Lin A., Jiang Z. Genomic analysis of biomarkers related to the prognosis of acute myeloid leukemia. Oncology Letters . 2020;20(2):1824–1834. doi: 10.3892/ol.2020.11700. - DOI - PMC - PubMed
    1. Zwaan C. M., Kolb E. A., Reinhardt D., et al. Collaborative efforts driving progress in pediatric acute myeloid leukemia. Journal of Clinical Oncology . 2015;33(27):2949–2962. doi: 10.1200/JCO.2015.62.8289. - DOI - PMC - PubMed
    1. Rasche M., Zimmermann M., Borschel L., et al. Successes and challenges in the treatment of pediatric acute myeloid leukemia: a retrospective analysis of the AML-BFM trials from 1987 to 2012. Leukemia . 2018;32(10):2167–2177. doi: 10.1038/s41375-018-0071-7. - DOI - PMC - PubMed
    1. Moerloose B., Reedijk A., Bock G. H., et al. Response-guided chemotherapy for pediatric acute myeloid leukemia without hematopoietic stem cell transplantation in first complete remission: results from protocol DB AML-01. Pediatric Blood & Cancer . 2019;66(5, article e27605) doi: 10.1002/pbc.27605. - DOI - PubMed
    1. Kim H. Treatments for children and adolescents with AML. Blood Research . 2020;55(S1):S5–S13. doi: 10.5045/br.2020.s002. - DOI - PMC - PubMed