. 2022 Nov 28:9:1055356.
doi: 10.3389/fmolb.2022.1055356. eCollection 2022.

The copper transporter CTR1 and cisplatin accumulation at the single-cell level by LA-ICP-TOFMS

Affiliations

The copper transporter CTR1 and cisplatin accumulation at the single-cell level by LA-ICP-TOFMS

Anna Schoeberl et al. Front Mol Biosci. .

Abstract

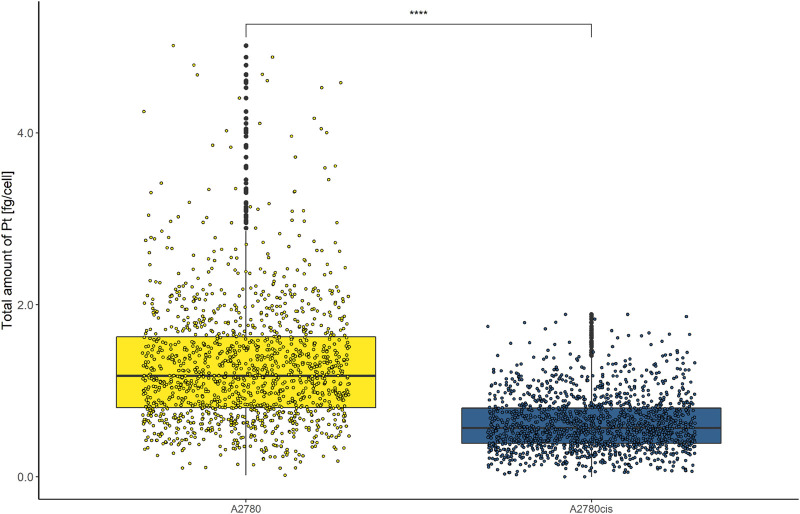
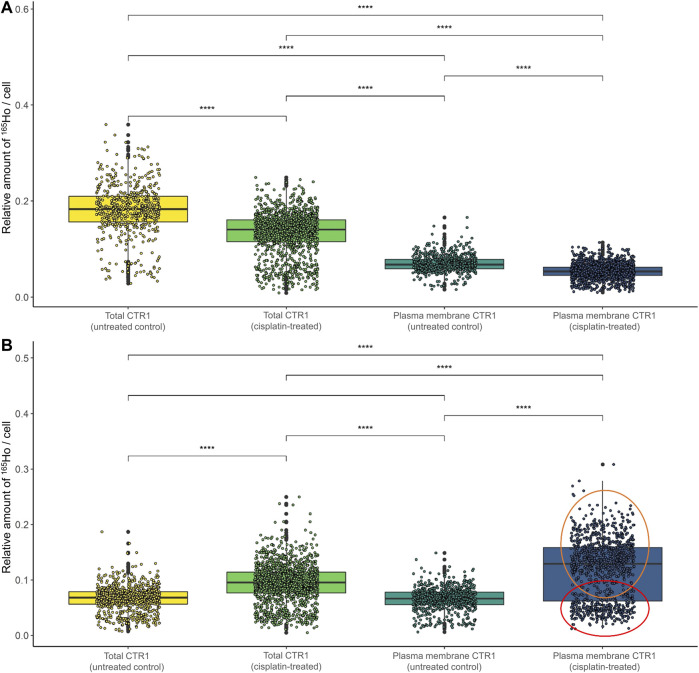
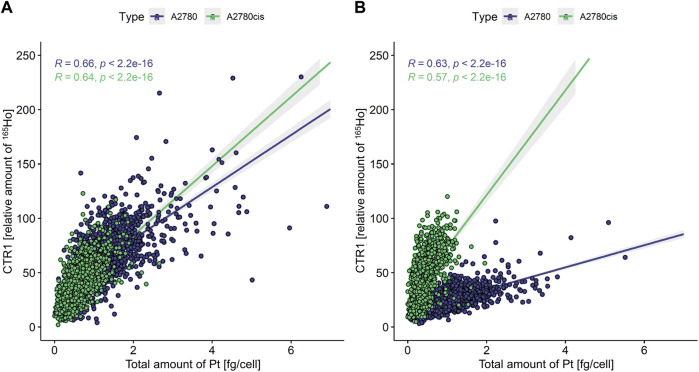
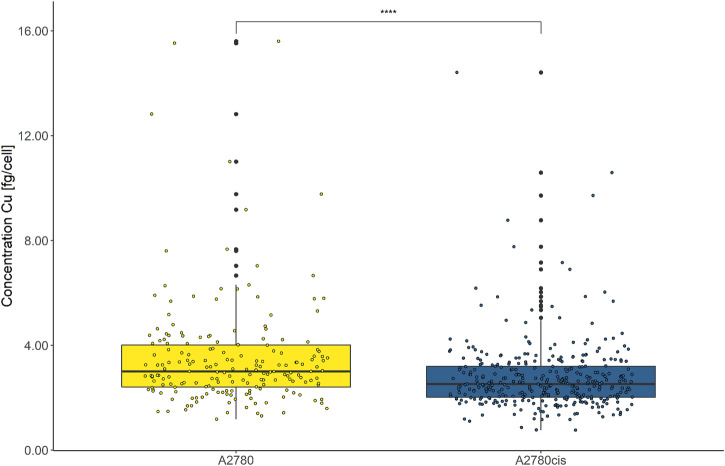
More than a decade ago, studies on cellular cisplatin accumulation via active membrane transport established the role of the high affinity copper uptake protein 1 (CTR1) as a main uptake route besides passive diffusion. In this work, CTR1 expression, cisplatin accumulation and intracellular copper concentration was assessed for single cells revisiting the case of CTR1 in the context of acquired cisplatin resistance. The single-cell workflow designed for in vitro experiments enabled quantitative imaging at resolutions down to 1 µm by laser ablation-inductively coupled plasma-time-of-flight mass spectrometry (LA-ICP-TOFMS). Cisplatin-sensitive ovarian carcinoma cells A2780 as compared to the cisplatin-resistant subline A2780cis were investigated. Intracellular cisplatin and copper levels were absolutely quantified for thousands of individual cells, while for CTR1, relative differences of total CTR1 versus plasma membrane-bound CTR1 were determined. A markedly decreased intracellular cisplatin concentration accompanied by reduced copper concentrations was observed for single A2780cis cells, along with a distinctly reduced (total) CTR1 level as compared to the parental cell model. Interestingly, a significantly different proportion of plasma membrane-bound versus total CTR1 in untreated A2780 as compared to A2780cis cells was observed. This proportion changed in both models upon cisplatin exposure. Statistical analysis revealed a significant correlation between total and plasma membrane-bound CTR1 expression and cisplatin accumulation at the single-cell level in both A2780 and A2780cis cells. Thus, our study recapitulates the crosstalk of copper homeostasis and cisplatin uptake, and also indicates a complex interplay between subcellular CTR1 localization and cellular cisplatin accumulation as a driver for acquired resistance development.

Keywords: CTR1 copper transporter; ICP-TOFMS; cisplatin accumulation; cisplatin resistance; laser ablation; single-cell.


Conflict of interest statement

The authors declare that the research was conducted in the absence of any commercial or financial relationships that could be construed as a potential conflict of interest.

Figures

FIGURE 1
FIGURE 1
Box plots showing the concentration of Pt cell−1 of A2780 and A2780cis cells treated with 10 µM cisplatin for 6 h. Cytospin samples were measured by LA-ICP-TOFMS at the single-cell level. The results are based on ∼1,500 cells for each cell type. A Wilcoxon test was performed for the statistical comparison of the different cell types. Significance codes: (*) p ≤ 0.05, (**) p ≤ 0.01, (***) p ≤ 0.001, (****) p ≤ 0.0001.
FIGURE 2
FIGURE 2
Signal intensity maps of 165Ho+, showing normalized cellular levels of total CTR1 in (A) A2780 and (B) A2780cis. Cytospin samples were measured by LA-ICP-TOFMS imaging at the single-cell level.
FIGURE 3
FIGURE 3
Signal intensity maps of 165Ho+, showing normalized cellular levels of plasma membrane-bound CTR1 in (A) A2780 and (B) A2780cis. Cytospin samples were measured by LA-ICP-TOFMS imaging at the single-cell level.
FIGURE 4
FIGURE 4
Box plots showing the relative amount of 165Ho cell−1 in A2780 and A2780cis cells. The intensity of the 165Ho signal corresponds to the amount of total or plasma membrane-bound CTR1. The results are shown (A) without and (B) with prior size normalization. Cytospin samples were measured by LA-ICP-TOFMS imaging at the single-cell level. The results are based on ∼1,000 to 1,500 cells for each sample. A Wilcoxon test was performed for the statistical comparison of the different cell types. Significance codes: (*) p ≤ 0.05, (**) p ≤ 0.01, (***) p ≤ 0.001, (****) p ≤ 0.0001.
FIGURE 5
FIGURE 5
Box plots showing the relative amount of 165Ho cell−1 after size normalization in (A) A2780 and (B) A2780cis cells both untreated (control) and after treatment with 10 µM cisplatin for 6 h. The amount of 165Ho represents the amount of total and plasma membrane CTR1 transporter. The results are based on ∼800 to 1,500 cells for each sample. The red circle shows a cell subpopulation with a low amount of CTR1, whereas the orange circle indicates a subpopulation with a high amount. A Wilcoxon test was performed for the statistical comparison of the different cell types. Significance codes: (*) p ≤ 0.05, (**) p ≤ 0.01, (***) p ≤ 0.001, (****) p ≤ 0.0001.
FIGURE 6
FIGURE 6
Scatterplot showing the total amount of Pt [fg cell−1] versus the relative amount of 165Ho [counts cell−1] representing the amount of (A) total and (B) plasma membrane-associated CTR1. A Pearson correlation was calculated between those two variables for both A2780 and A2780cis cells. A value of 0.00–0.10 indicates a negligible correlation, 0.10–0.39 a weak correlation, 0.40–0.69 a moderate correlation, 0.70–0.89 a strong correlation, and a value of 0.90–1.00 a very strong correlation (Schober et al., 2018).
FIGURE 7
FIGURE 7
Box plots showing the concentration of intracellular Cu cell−1 of A2780 and A2780cis cells. Cytospin samples were measured by LA-ICP-TOFMS at the single-cell level. All values below the LOD were removed. A Wilcoxon test was performed for the statistical comparison of the different cell types. Significance codes: (*) p ≤ 0.05, (**) p ≤ 0.01, (***) p ≤ 0.001, (****) p ≤ 0.0001.

References

    1. Abada P., Howell S. B. (2010). Regulation of cisplatin cytotoxicity by Cu influx transporters. Metal-Based Drugs 2020, 1–9. 10.1155/2010/317581 - DOI - PMC - PubMed
    1. Baier D., Schoenhacker-Alte B., Rusz M., Pirker C., Mohr T., Mendrina T., et al. (2022). The anticancer ruthenium compound BOLD-100 targets glycolysis and generates a metabolic vulnerability towards glucose deprivation. Pharmaceutics 14 (2), 238. 10.3390/pharmaceutics14020238 - DOI - PMC - PubMed
    1. Bandura D. R., Baranov V. I., Ornatsky O. I., Antonov A., Kinach R., Lou X., et al. (2009). Mass cytometry: Technique for real time single cell multitarget immunoassay based on inductively coupled plasma time-of-flight mass spectrometry. Anal. Chem. 81 (16), 6813–6822. 10.1021/ac901049w - DOI - PubMed
    1. Blair B. G., Larson C. A., Adams P. L., Abada P. B., Safaei R., Howell S. B. (2010). Regulation of copper transporter 2 expression by copper and cisplatin in human ovarian carcinoma cells. Mol. Pharmacol. 77 (6), 912–921. 10.1124/mol.109.062836 - DOI - PMC - PubMed
    1. Carpenter A. E., Jones T. R., Lamprecht M. R., Clarke C., Kang I. H., Friman O., et al. (2006). CellProfiler: Image analysis software for identifying and quantifying cell phenotypes. Genome Biol. 7 (10), R100. 10.1186/gb-2006-7-10-r100 - DOI - PMC - PubMed