. 2023 Mar;237(5):1558-1573.
doi: 10.1111/nph.18676. Epub 2022 Dec 28.

Longer epidermal cells underlie a quantitative source of variation in wheat flag leaf size

Affiliations

Longer epidermal cells underlie a quantitative source of variation in wheat flag leaf size

Camila M Zanella et al. New Phytol. 2023 Mar.

Abstract

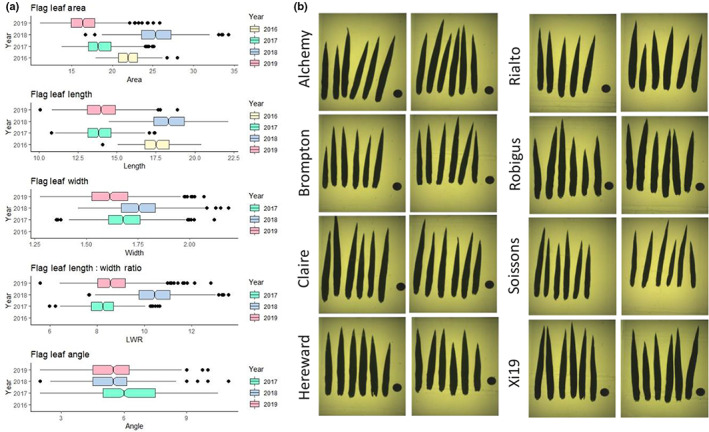
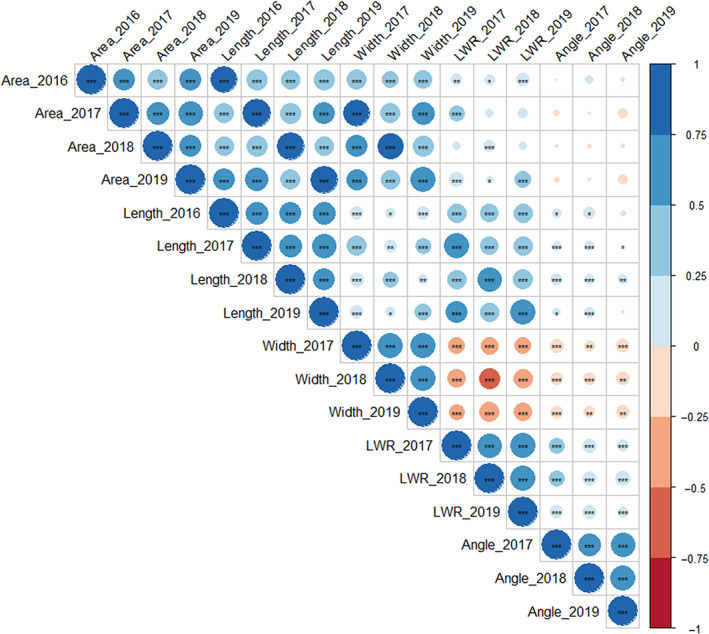
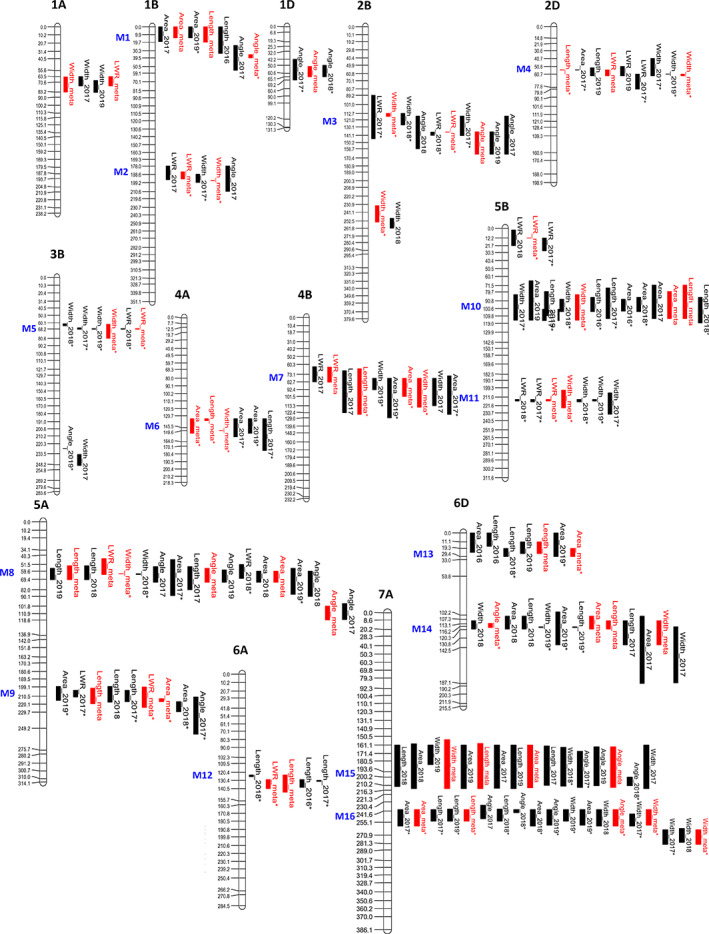
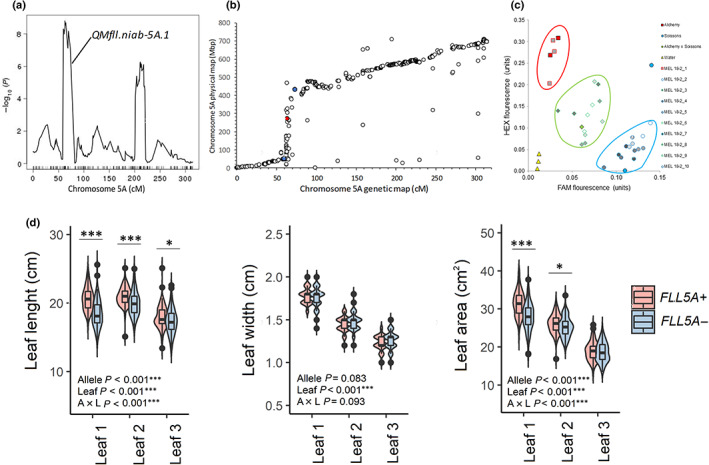
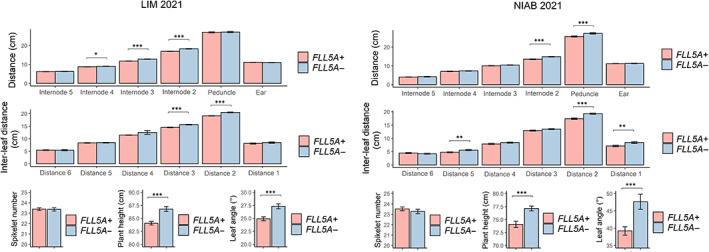
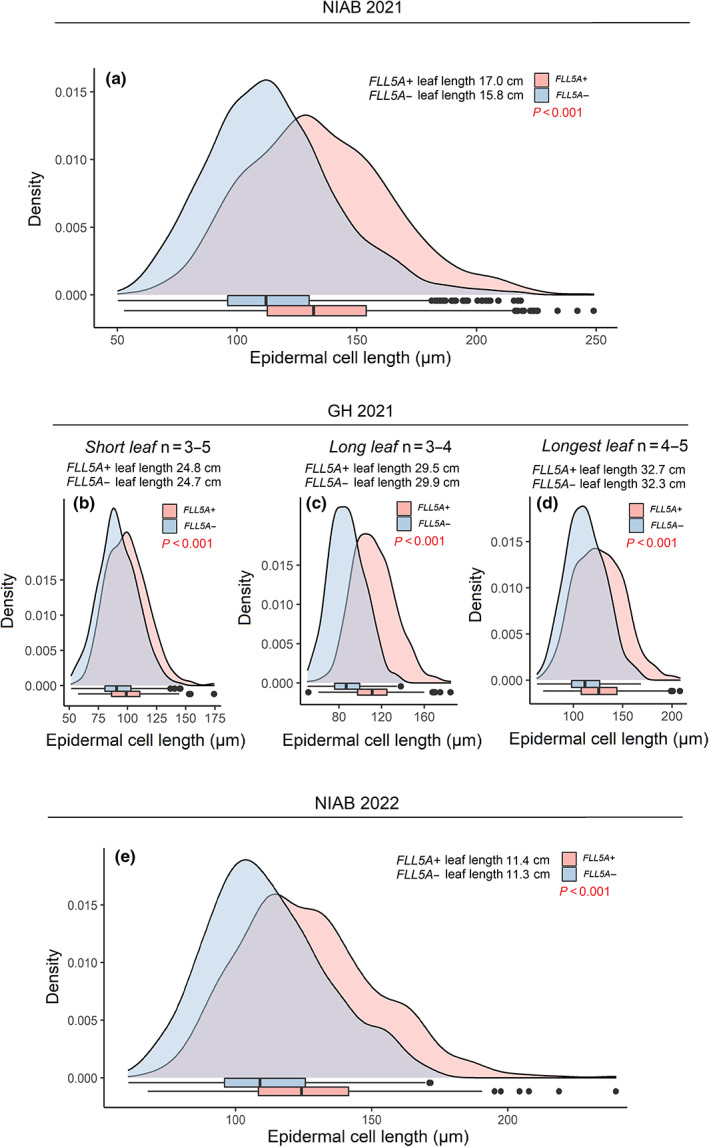
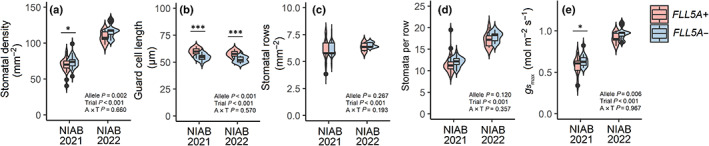
The wheat flag leaf is the main contributor of photosynthetic assimilates to developing grains. Understanding how canopy architecture strategies affect source strength and yield will aid improved crop design. We used an eight-founder population to investigate the genetic architecture of flag leaf area, length, width and angle in European wheat. For the strongest genetic locus identified, we subsequently created a near-isogenic line (NIL) pair for more detailed investigation across seven test environments. Genetic control of traits investigated was highly polygenic, with colocalisation of replicated quantitative trait loci (QTL) for one or more traits identifying 24 loci. For QTL QFll.niab-5A.1 (FLL5A), development of a NIL pair found the FLL5A+ allele commonly conferred a c. 7% increase in flag and second leaf length and a more erect leaf angle, resulting in higher flag and/or second leaf area. Increased FLL5A-mediated flag leaf length was associated with: (1) longer pavement cells and (2) larger stomata at lower density, with a trend for decreased maximum stomatal conductance (Gsmax ) per unit leaf area. For FLL5A, cell size rather than number predominantly determined leaf length. The observed trade-offs between leaf size and stomatal morphology highlight the need for future studies to consider these traits at the whole-leaf level.

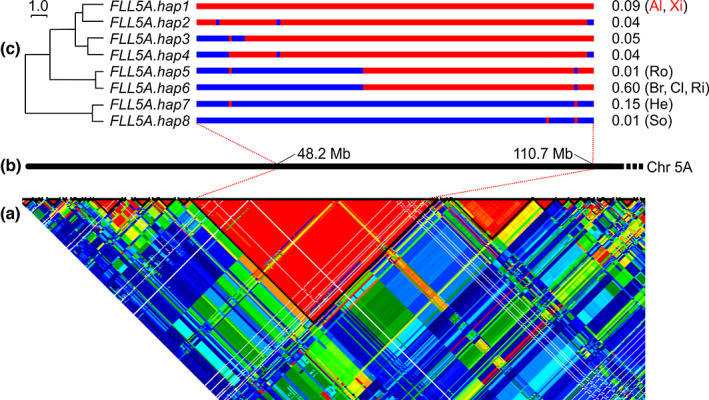
Keywords: flag leaf morphology; haplotype analysis; maximum stomatal conductance (Gsmax); multifounder advanced generation intercross population; quantitative trait variation; wheat (Triticum aestivum L.).


Conflict of interest statement

None declared.

Figures

Fig. 1
Fig. 1
Wheat (Triticum aestivum L.) MAGIC founder flag leaf phenotypes. (a) Boxplots of flag leaf phenotypes from trials NIAB16, NIAB17, NIAB18 and NIAB19. The horizontal lines denote the median, boxes indicate the lower (25%) and upper (75%) quartiles, whiskers indicate the ranges of the minimum and maximum values, and dots predicted outliers. Flag leaf width from NIAB16 was not used, as explained in the Results section. (b) Examples of MAGIC founder flag leaf images from trial NIAB18. Six leaves from plot replicate‐1 and six leaves from plot replicate‐2 shown for each founder. Descriptive flag leaf ideotypes for each founder are listed here, including angle: Alchemy: long leaf with intermediate width resulting in an intermediate area combined with an erect angle. Brompton: short length with intermediate width resulting in a low area combined with intermediate angle. Claire: longest length with intermediate width resulting in the highest area combined with intermediate angle. Hereward: medium length with the widest leaf resulting in high area combined with erect angle. Rialto: short length with wide leaf resulting in intermediate area combined with the most erect angle. Robigus: medium length with wide lead resulting in intermediate area combined with intermediate angle. Soissons: medium length with the narrowest leaf resulting in low area combined with lax angle. Xi19: long length with intermediate width resulting in intermediate area with the most lax angle.
Fig. 2
Fig. 2
Correlations between the five flag leaf traits measured in the winter wheat (Triticum aestivum L.) ‘NIAB Elite MAGIC’ population grown in field trials undertaken in the UK in harvest seasons 2016, 2017, 2018 and 2019. Trait abbreviations: Flag leaf length (Length), flag leaf width (Width), flag leaf area (Area), flag leaf length : width ratio (LWR), flag leaf angle (Angle). Significant correlations at *, P = 0.05; **, P = 0.01; ***, P = 0.001 determined by paired Wilcoxon signed‐rank test are indicated.
Fig. 3
Fig. 3
Quantitative trait loci (QTL) identified for flag leaf traits in the ‘NIAB Elite MAGIC’ wheat (Triticum aestivum L.) population. Trials were conducted in harvest season 2016, 2017, 2018 and 2019. Genetic intervals for QTL and meta‐QTL are indicated in black or red, respectively. QTL identified using identity‐by‐state (IBS) and/or identity‐by‐descent (IBD) mapping approaches only, are indicated with an asterisk. The locations of multitrait QTL (M; genetic loci containing replicated QTL for two or more traits) are indicated. For illustration purposes, only a subset of the genetic markers in the MAGIC genetic map (Gardner et al., 2016) are shown here; units shown are centimorgans (cM).
Fig. 4
Fig. 4
Development and assessment of a near‐isogenic line (NIL) pair for QTL QFll.niab‐5A.1. (a) Results of meta‐QTL analysis for flag leaf length using genetic analysis method CIM‐cov10, showing chromosome 5A QTL QFll.niab‐5A.1. (b) Comparison of genetic (Gardner et al., 2016) vs physical (IWGSC et al., 2018) maps shows the QTL interval is in the region of low genetic recombination spanning the chromosome 5A centromere. The QFll.niab‐5A.1 peak marker is shown in red, and the left and right flanking markers are shown in blue. (c) The use of a codominant Kompetitive Allele‐Specific PCR marker for single‐nucleotide polymorphism (SNP) BS00062996_51 to screen 10 F5 sibling individuals from MAGIC recombinant inbred line (RIL) MEL_018_2. This RIL was heterozygous across QFll.niab‐5A.1, with alleles from the founders Alchemy (HEX, SNP = T:T) and Claire (FAM, SNP = C:C) predicted by CIM genetic analysis to confer long and short alleles at QFll.niab‐5A.1, respectively. Shown are the results using template DNA from Alchemy, Claire, a 50 : 50 mix of Alchemy : Claire to create an artificial heterozygote, 10 F5 individuals of RIL MEL_018_2, and a negative water control. Selection of F5 individuals MEL_018_2_1 (Alchemy allele) and MEL_018_2_2 (Claire allele) established the QFll.niab‐5A.1 NIL pair. (d) Subsequently, this NIL pair (FLL5A+ and FLL5A−) was grown at five field trials (sites NIAB 2019, KWS 2020, NIAB 2020 and LIM 2020) and two glasshouse experiments (GH 2019 and GH 2021), where the first (flag), second and third leaves were phenotyped for length and width, and area calculated. Shown here are data for trial LIM 2021; data for all trials are shown in Fig. S4. Significant differences between each NIL line for flag leaf, leaf‐2 or leaf‐3 indicated as *, P < 0.05; **, P < 0.01; ***, P < 0.001, as assessed by one‐way ANOVA. Also indicated within each panel are P‐values for interallelic (A), interleaf (L) and allele × leaf interaction (A × L), as assessed by two‐way ANOVA. For the boxplots, vertical lines denote the median, boxes indicate the lower (25%) and upper (75%) quartiles, whiskers indicate the ranges of the minimum and maximum values, and dots predicted outliers.
Fig. 5
Fig. 5
Analysis of height components, interleaf distances, flag leaf angle and spikelet number in the near‐isogenic line (NIL) pair for QTL QFll.niab‐5A.1 (FLL5A). FLL5A+ and FLL5A− denote the long (originating from cv Alchemy) and short (cv Claire) flag leaf length allele NIL line, respectively. Data shown are means ± SEM and were sourced from two trials (LIM 2021 and NIAB 2021), with four replicate plots per NIL line in LIM 2021 and two replicate plots per NIL line in NIAB 21, and 30 tillers harvested per plot. For interleaf distances, Distance 1 represents the distance from the base of the ear to the flag leaf, Distance 2 the distance from the flag leaf to leaf‐2, etc. Asterisks represent significant differences between the NIL pair (*, P < 0.05; **, P < 0.01; ***, P < 0.001) according to one‐way analysis of variance.
Fig. 6
Fig. 6
Density plots and box plots illustrating flag leaf epidermal cell length in the near‐isogenic line (NIL) pair for flag leaf morphology QTL QFll.niab‐5A.1 (FLL5A). The contrasting alleles captured in the NIL pair originate from the founders Alchemy (FLL5A+; long flag leaf allele) and Claire (FLL5A−; short flag leaf allele). For boxplots, the vertical lines denote the median, boxes indicate the lower (25%) and upper (75%) quartiles, whiskers indicate the ranges of the minimum and maximum values, and dots predicted outliers. Cell length data shown are: (a) from field trial NIAB 2021, for FLL5A+ measured from flag leaves of mean length of the FLL5A+ plots, for FLL5A− plants measured from flag leaves of mean length within the FLL5A− plots. To determine whether difference in epidermal cell length was independent of flag leaf length, from the GH 2021 trial flag leaves of three different mean lengths were sampled for FLL5A+ and FLL5A− plants: (b) 24.7 cm, (c) 29.6 cm, (d) 32.5 cm, while flag leaves of equal mean length were sampled from FLL5A+ and FLL5A− plots in field trial NIAB 2022. (e) Field trial NIAB 2022, with leaves of equal length selected for each FLL5A allele − the mean flag leaf length of the samples studied are indicated. Cell length in all five panels were significantly different (P < 0.01) according to one‐way analysis of variance.
Fig. 7
Fig. 7
Stomata traits from the upper (adaxial) side of the mid‐region of the flag leaf for the FLL5A near‐isogenic line (NIL) pair grown in field trials NIAB 2021 and NIAB 2022. For NIAB 2021, flag leaves were sampled of mean size for each NIL line (FLL5A+ = 17.0 cm; FLL5A− = 15.8 cm). For NIAB 2022, flag leaves of equal size were sampled from both FLL5A+ and FLL5A− (11.3 ± 0.3 cm). Significant differences between each NIL line within a trial are indicated as *, P < 0.05; **, P < 0.01; ***, P < 0.001, as assessed by one‐way ANOVA. Also indicated within each panel are P‐values for interallelic (A), inter‐trial (T) and allele × trial interaction (A × T), as assessed by two‐way ANOVA. For box plots, the horizontal lines denote the median, boxes indicate the lower (25%) and upper (75%) quartiles, whiskers indicate the ranges of the minimum and maximum values, and dots predicted outliers. (a) Stomatal density, (b) guard cell length, (c) stomatal rows, (d) stomata per row, (e) G smax (maximum stomatal conductance per unit leaf area).
Fig. 8
Fig. 8
Haplotype analysis around the wheat (Triticum aestivum L.) genetic locus, QFll‐niab‐5A.1 (termed, FLL5A). (a) Heatmap of linkage disequilibrium on a region of chromosome 5A in the panel of 403 European wheat varieties genotyped with the 90K single‐nucleotide polymorphism (SNP) array; haploblocks are highlighted via black lines, and the peak SNP for FLL5A was located in the large haploblock of 149 SNPs spanning the centromere. (b) The physical map of chromosome (Chr) 5A from the short arm telomere onwards, indicating the physical position of the manually curated subset of 125 SNPs subsequently investigated manually for defining haplotypes. (c) Haplotypes identified in the varietal panel using 125 SNPs. The Euclidian distance dendrogram to the left illustrates the relationships between haplotypes, while the frequencies of the haplotypes in the varietal panel are listed to the right. The haplotypes to which the MAGIC founders belong are indicated: Al (Alchemy), Br (Brompton), Cl (Claire), He (Hereward), Ri (Rialto), Ro (Robigus), So (Soissons), Xi (Xi19), with the founders contributing alleles with the greatest increasing effect on flag leaf length highlighted in red.

References

    1. Altschul SF, Gish W, Miller E, Myers EW, Lipman DJ. 1990. Basic local alignment search tool. Journal of Molecular Biology 215: 403–410. - PubMed
    1. Araus JL, Tapia L. 1987. Photosynthetic gas exchange characteristics of wheat flag leaf blades and sheaths during grain filling: the case of a spring crop grown under Mediterranean climate conditions. Plant Physiology 85: 667–673. - PMC - PubMed
    1. Austin R, Ford M, Edrich J, Hooper B. 1976. Some effects of leaf posture on photosynthesis and yield in wheat. Annals of Applied Biology 83: 425–446.
    1. Barrett JC, Fry B, Maller J, Daly MJ. 2005. Haploview: analysis and visualization of LD and haplotype maps. Bioinformatics 15: 263–265. - PubMed
    1. Bates D, Mächler M, Bolker B, Walker S. 2015. Fitting linear mixed‐effects models using lme4. Journal of Statistical Software 67: 1–48.

Publication types

LinkOut - more resources