

doi: 10.3324/haematol.2022.281402.
Pirtobrutinib results in reversible platelet dysfunction compared to ibrutinib and acalabrutinib
Affiliations
- PMID: 36519322
- PMCID: PMC10153540
- DOI: 10.3324/haematol.2022.281402
Item in Clipboard
Pirtobrutinib results in reversible platelet dysfunction compared to ibrutinib and acalabrutinib
Haematologica.
.
No abstract available
Figures
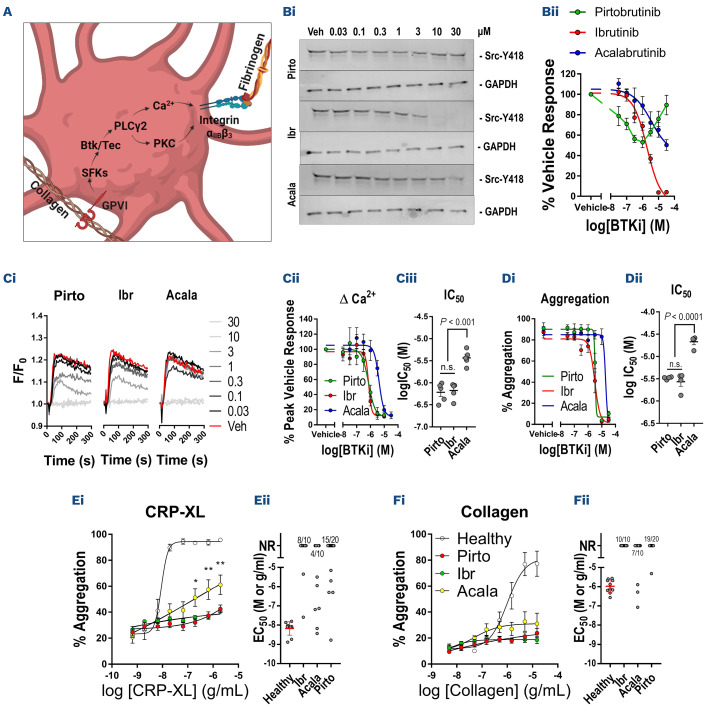
Pirtobrutinib, ibrutinib and acalabrutinib inhibit platelet signaling and function in vitro and ex vivo. (A) Schematic diagram depicting an abridged platelet GPVI signaling pathway in which stimulation of GPVI results in activation of SFK and BTK/TEC followed by PLCy2 which enables cytosolic Ca2+ release and activation of PKC. Subsequent activation of integrin aIIbb3 enables fibrinogen binding and platelet aggregation. (Bi) Western blot analysis of Src Y418 phosphorylation with GAPDH loading control following stimulation of washed platelets with 3 mg/mL collagen-related peptide (CRP-XL) for 3 minutes in the presence of a range of concentrations of pirtobrutinib, acalabrutinib and ibrutinib (30-0.03 mM) or vehicle and (Bii) graph of mean phosphorylation relative to vehicle treated samples. (Ci) Cytosolic Ca2+ levels after stimulation of fura-2 loaded platelet-rich plasma (PRP) with 3 mg/mL CRP-XL in the presence of Bruton tyrosine kinase inhibitors (BTKi) and (Cii) graphs of mean increase in fura-2 signal relative to vehicle-treated samples and (Ciii) log-half maximal inhibitory concentration (IC50) values for the BTKi. (Di) Graph of % aggregation of PRP measured by PBA after stimulation with 3 mg/mL CRP-XL for 5 minutes in the presence of BTKi and (Dii) mean log-IC50 values. Aggregation of PRP from patients receiving BTKi therapy measured in 96-well plates following stimulation with concentration ranges of (A) CRP-XL, (B) collagen. Plots of (i) concentration-response curves for each agonist in which points represent the mean response to each concentration ± standard error of the mean and (ii) scatter plots of half maximal effective concentration (EC50) values, bars represent the mean ± standard deviation. Failure to induce concentration-dependent aggregation was designated ‘No Response’. The proportion of non-responders is noted at the top of relevant scatter plots. Statistical comparisons were performed by two-way ANOVA with Tukey multiple comparisons test. *P<0.05, **P<0.01.
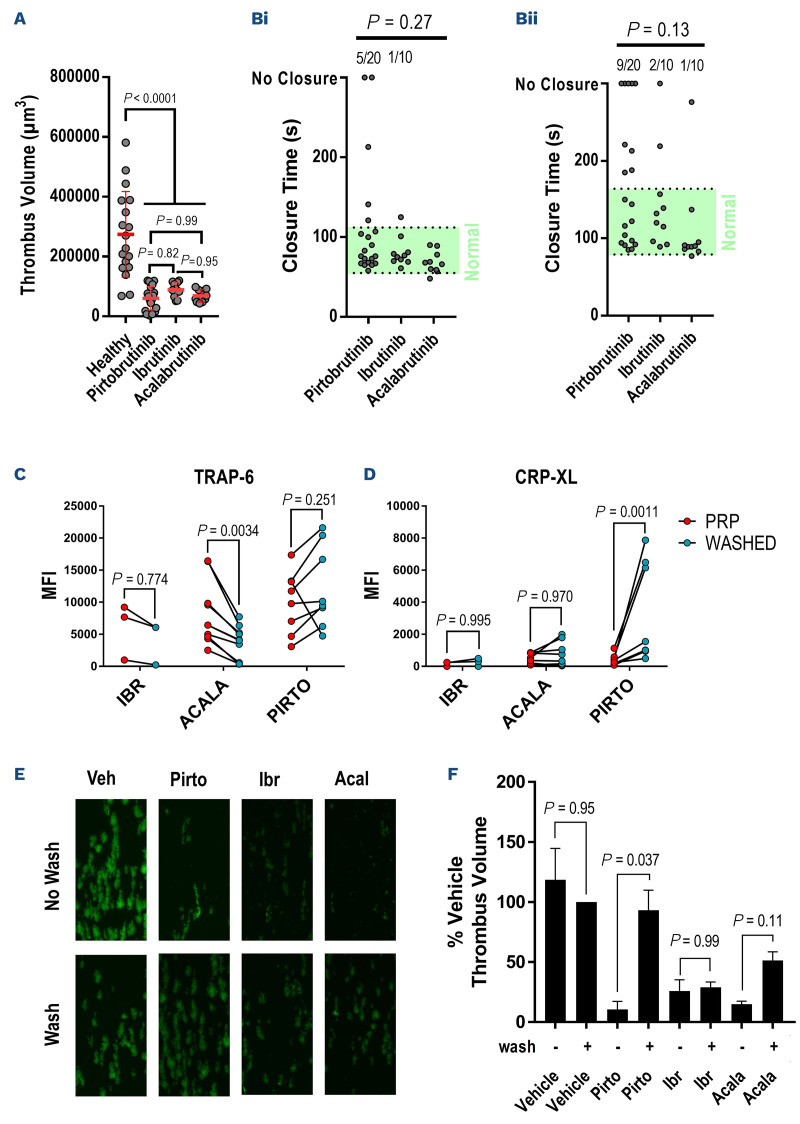
Pirtobrutinib causes similar impairment of platelet function at high shear but the inhibitory effects is rapidly reversed following wash-off. Whole blood from patients receiving Bruton tyrosine kinase inhibitors (BTKi) therapy were perfused through collagen-coated microfluidic chips for 6 minutes at a shear rate of 1,000 s-1 and the volume of resulting thrombi measured by confocal fluorescence microscopy. (A) A scatter plot of thrombus volumes, bars represent the mean ± standard deviation. PFA-200 closure times (CT) were also measured in whole blood samples. Scatter plots CT measured in (Bi) collagen/ADP and (Bii) collagen/epinephrine cartridges, including the normal range (green area) and proportion of CT outside of the range (above plot). The P values were calculated using Fisher’s exact test to compare normal and prolonged CT. Flow cytometry was used to assess a-granule secretion by measuring P-selectin exposure in platelet-rich plasma (PRP) from patients receiving BTKi and then again in washed platelets that had been incubated for 1 hour at room temperature after washing. Scatter plots of P-selectin exposure stimulated by (C) 15 mM TRAP-6 or (D) 3 mg/mL CRP-XL after 20 minutes. Lines connect responses in PRP and washed platelets for each patient. The P values were calculated by matched two-way ANOVA with Tukey’s multiple comparison test. (E) Confocal microscopy images of thrombi formed in type I collagen-coated microfluidic chips after perfusing whole blood from healthy donors treated with vehicle, pirtobrutinib (10 µM), ibrutinib (1 µM) or acalabrutinib (1 µM) for 1 hour with or without inhibitor wash-off. (F) Bar chart of thrombus volumes normalized to the volume of thrombi formed in vehicle-treated whole blood after washing. Bars represent the mean thrombus volume ± standard error of the mean. P values were calculated using one-way ANOVA with Sidak’s multiple comparisons test.
References
-
- Furman RR, Byrd JC, Owen RG, et al. . Pooled analysis of safety data from clinical trials evaluating acalabrutinib monotherapy in mature B-cell malignancies. Leukemia. 2021;35(11):3201-3211. - PubMed
Publication types
MeSH terms
Substances
Grants and funding
LinkOut - more resources
Full Text Sources
