. 2023 Jul 1;108(7):1768-1781.
doi: 10.3324/haematol.2022.281692.

Ex vivo venetoclax sensitivity testing predicts treatment response in acute myeloid leukemia

Affiliations

Ex vivo venetoclax sensitivity testing predicts treatment response in acute myeloid leukemia

Heikki Kuusanmäki et al. Haematologica. .

Abstract

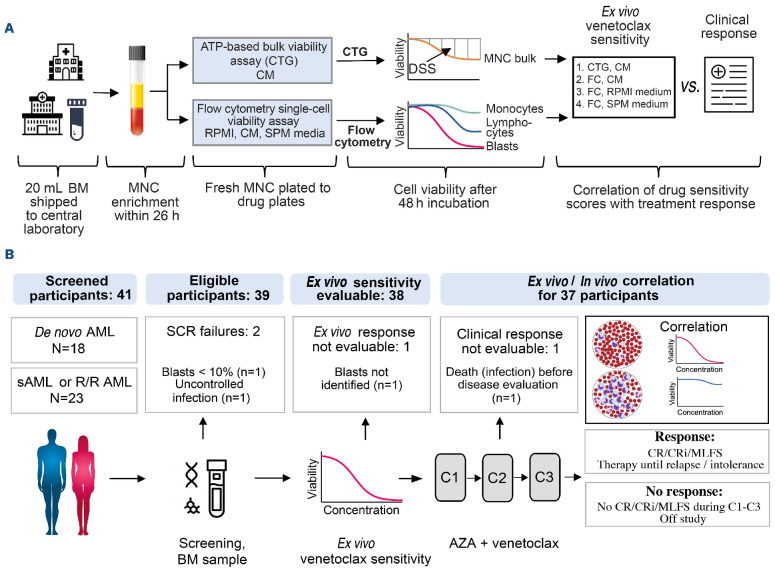
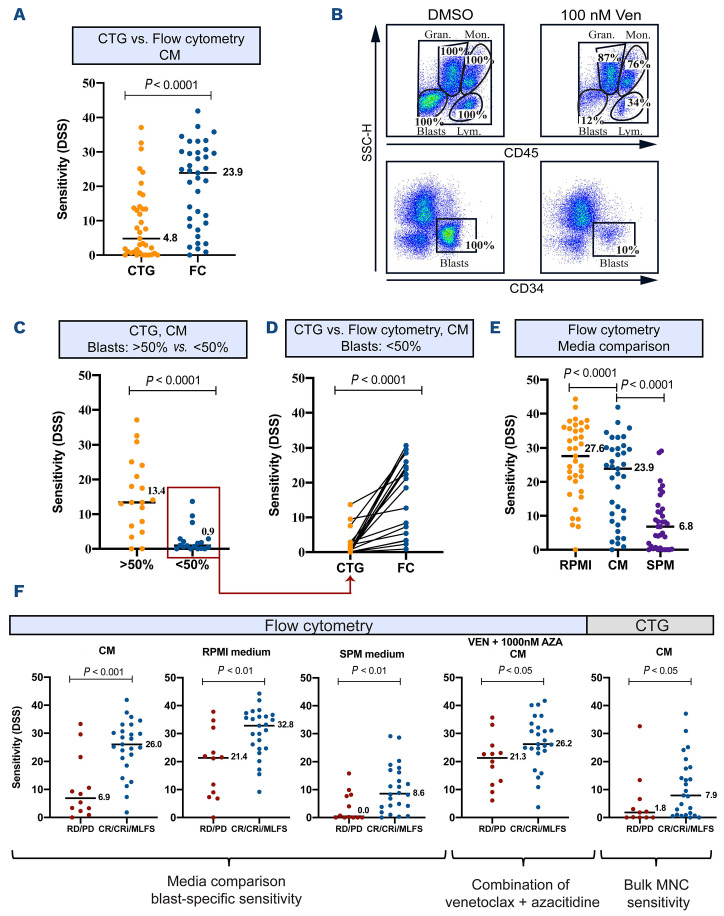
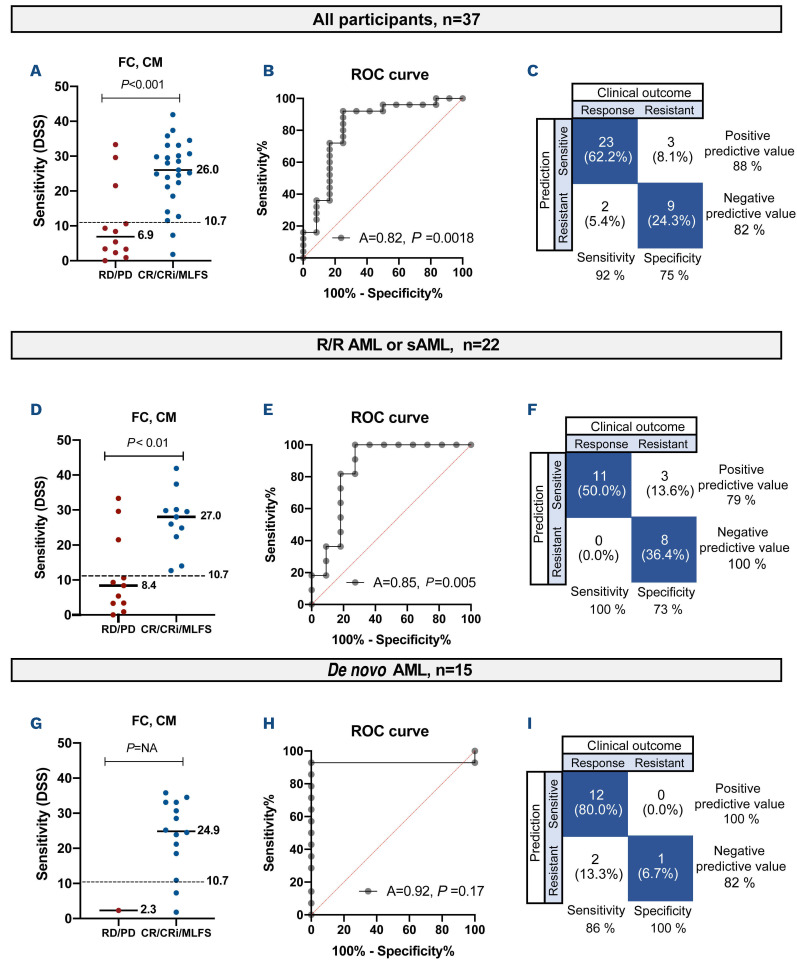
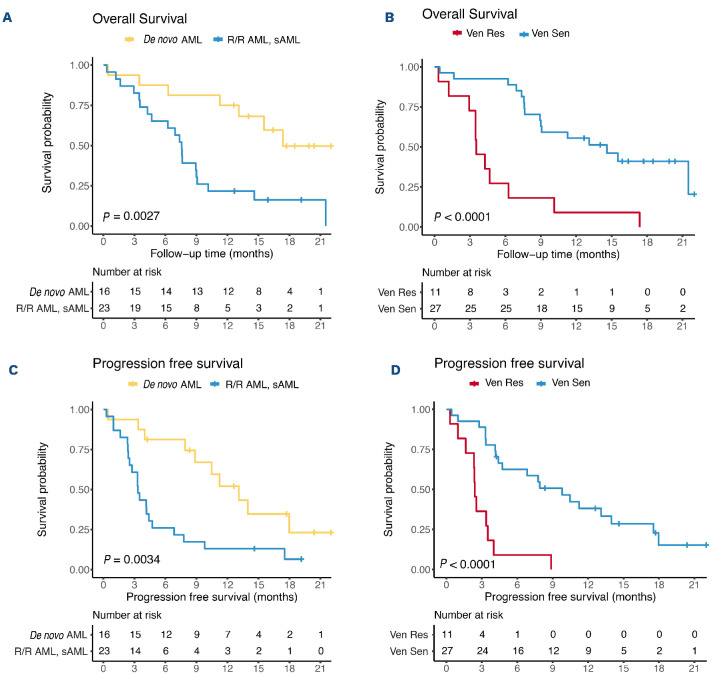
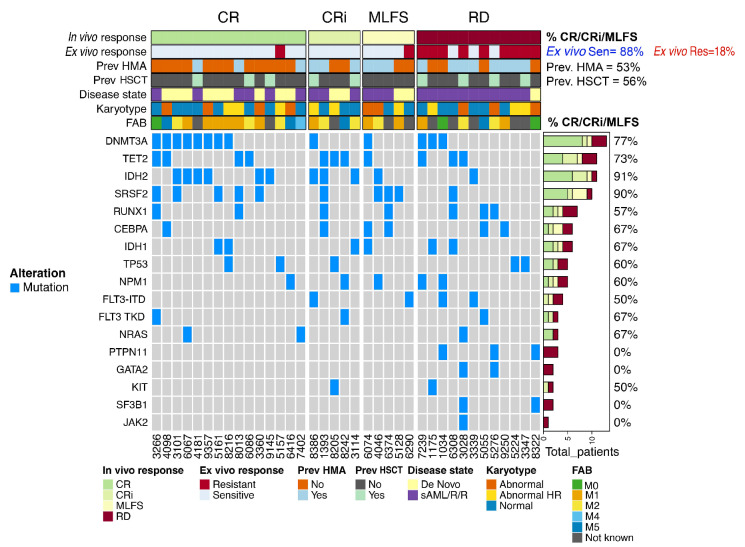
The BCL-2 inhibitor venetoclax has revolutionized the treatment of acute myeloid leukemia (AML) in patients not benefiting from intensive chemotherapy. Nevertheless, treatment failure remains a challenge, and predictive markers are needed, particularly for relapsed or refractory AML. Ex vivo drug sensitivity testing may correlate with outcomes, but its prospective predictive value remains unexplored. Here we report the results of the first stage of the prospective phase II VenEx trial evaluating the utility and predictiveness of venetoclax sensitivity testing using different cell culture conditions and cell viability assays in patients receiving venetoclax-azacitidine. Participants with de novo AML ineligible for intensive chemotherapy, relapsed or refractory AML, or secondary AML were included. The primary endpoint was the treatment response in participants showing ex vivo sensitivity and the key secondary endpoints were the correlation of sensitivity with responses and survival. Venetoclax sensitivity testing was successful in 38/39 participants. Experimental conditions significantly influenced the predictive accuracy. Blast-specific venetoclax sensitivity measured in conditioned medium most accurately correlated with treatment outcomes; 88% of sensitive participants achieved a treatment response. The median survival was significantly longer for participants who were ex vivo-sensitive to venetoclax (14.6 months for venetoclax-sensitive patients vs. 3.5 for venetoclax-insensitive patients, P<0.001). This analysis illustrates the feasibility of integrating drug-response profiling into clinical practice and demonstrates excellent predictivity. This trial is registered with ClinicalTrials.gov identifier: NCT04267081.


Figures

Figure 1.
Figure 1.
Sample processing and trial outline. (A) Outline of sample processing and drug sensitivity testing. (B) Outline of study recruitment, including number of participants, reasons for screening failure, and number of participants eligible for ex vivo/in vivo correlation. BM: bone marrow; MNC: mononuclear cells; CTG: CellTiterGlo®; CM: conditioned medium; DSS: drug sensitivity score; FC: flow cytometry; AML: acute myeloid leukemia; sAML: secondary AML; R/R AML: relapsed and/or resistant AML; SCR: screening; C: cycle; AZA: azacitidine; CR: complete remission; CRi: CR with incomplete blood recovery; MLFS: morphological leukemia-free state.
Figure 2.
Figure 2.
Comparison of venetoclax sensitivity among different assays and cell culture media. (A) Venetoclax sensitivity of trial participants (n=37) assessed using CellTiterGlo® (CTG) and flow cytometry (FC) assays and expressed as measured by the drug sensitivity score. The line represents the median. The P value was calculated using a two-tailed Wilcoxon matched-pairs signed-rank test. (B) FC scatter plot of a sample treated with dimethylsulfoxide (DMSO) control or 100 nM of venetoclax for 48 h. Blasts, lymphocytes, monocytic cells, and granulocytic cells are gated in the upper row plots using side scatter versus CD45, and in the lower row blasts are gated using CD34. Absolute numbers of viable cells present after treatment with 100 nM of venetoclax in each gate were normalized to the number of cells present in the wells containing the DMSO control. (C) Comparison of sensitivity to venetoclax between samples with blast counts <50% (n=19) and >50% (n=18), assessed using the CTG assay in conditioned medium. The line represents the median. The P value was calculated using the Mann-Whitney U test. (D) Sensitivity to venetoclax of samples with blast counts <50% (n=19), assessed using the CTG or FC assay. The line represents the median. The P value was calculated using a two-tailed Wilcoxon matched-pairs signed-rank test. (E) Blast-specific venetoclax sensitivity measured using FC in three different cell culture media. The line represents the median. The P value was calculated using a two-tailed Wilcoxon matched-pairs signed-rank test. (F) The drug sensitivity scores for venetoclax determined using different assays and media and plotted for each participant (n=37). Participants were divided into responders (n=25) and non-responders (n=12). The line represents the median. The P value was calculated using a one-tailed Mann-Whitney U test. CM: conditioned medium; SSC: side scatter; Gran: granulocytes; Mon: monocytes; Lym: lymphocytes; DSS: drug sensitivity score; RD: refractory disease; PD: progressive disease; CR: complete remission; CRi: complete remission with incomplete blood recovery; MLFS: morphological leukemia-free state; AZA: azacitidine.
Figure 3.
Figure 3.
Determination of the predictive value of drug sensitivity testing in different cohorts of patients. (A) The sensitivity of each participant to venetoclax, determined using flow cytometry and conditioned medium and expressed as a drug sensitivity score (DSS). The participants are divided into responders and non-responders. The dashed line at DSS 10.7 represents the best cutoff value. The P value was calculated using a one-tailed Mann-Whitney U test. (B) Receiver operating characteristic (ROC) curve analysis of DSS and clinical response using the Wilson-Brown method. (C) Sensitivity, specificity, positive predictive value and negative predictive value of the test when using the cutoff value of DSS 10.7, illustrated in a confusion matrix. (D) DSS versus clinical response in relapsed/refractory (R/R) or secondary acute myeloid leukemia (sAML). The P value was calculated using a one-tailed Mann-Whitney U test. (E) ROC analysis of R/R or sAML. (F) Predictive value of the test in R/R or sAML. (G) DSS versus clinical response in de novo AML. The P value was calculated using a one-tailed Mann-Whitney U test. (H) ROC analysis of de novo AML. (I) Predictive value of the test in de novo AML. DSS: drug sensitivity score; FC: flow cytometry; CM: conditioned medium; RD: refractory disease; PD: progressive disease; CR: complete remission; CRi: complete remission with incomplete blood recovery; MLFS: morphological leukemia-free state.
Figure 4.
Figure 4.
Overall survival based on disease state and ex vivo sensitivity to venetoclax. (A) The median overall survival for de novo acute myeloid leukemia (AML) versus secondary AML (sAML) or relapsed/refractory AML (R/R AML) was 17.4 months (95% confidence interval [95% CI]: not reached) and 7.6 months (95% CI: 6.5-8.6), respectively. (B) The median overall survival for participants with a drug sensitivity score <10.7 (ex vivo-resistant) versus >10.7 (ex vivo-sensitive) was 3.5 months (95% CI: 2.5-4.6) and 14.6 months (95% CI: 8.8-20.4), respectively. Participants alive at the data cutoff day were censored. The median follow-up time was 18.6 months. (C) The median progression-free survival for de novo AML versus sAML or R/R AML was 13.1 months and 3.3 months, respectively. (D) The median progression-free survival for ex vivo drug-resistant versus ex vivo drug-sensitive patients was 9.8 versus 2.4 months, respectively. Progression-free survival was defined as the number of days from the date of the first dose to the date when the patient was deemed refractory or the earliest evidence of relapse or death. Ven Res: resistant to venetoclax; Ven Sen, sensitive to venetoclax.
Figure 5.
Figure 5.
Genetic predictors of response. Treatment responses, drug testing predictions, previous treatment with a hypomethylating agent, prior allogeneic stem cell transplantation, disease state, French-American-British subtype and recurrent mutations at the time of the screening presented in an OncoPrint heatmap. Percentages correspond to the number of responders with a specific feature. CR: complete remission; CRi: complete remission with incomplete blood recovery; MLFS: morphological leukemia-free state; RD: resistant disease; Sen: sensitive; Res: resistant; HMA: hypomethylating agent; HSCT: allogeneic hematopoietic stem cell transplantation; Prev: previous; FAB: French-American-British; ITD: internal tandem duplication; TKD: tyrosine kinase domain; sAML/R/R: secondary or relapsed and/or resistant acute myeloid leukemia.
Figure 6.
Figure 6.
Cell populations in monocytic acute myeloid leukemia samples have distinct drug response paterns and gene expression profiles. (A) Drug sensitivity score of five myelomonocytic/monocytic samples measured using CellTiterGlo® or flow cytometry assays in conditioned medium. Clinical responses (complete remission/complete remission with incomplete blood recovery/resistant disease) are annotated in the graph. The P value was calculated using a two-tailed Wilcoxon matched-pairs signed-rank test. (B) Uniform Manifold Approximation and Projection (UMAP) representation of monocytic and progenitor cells from three bone marrow samples profiled by single-cell RNA sequencing. The samples were taken from three patients with acute myeloid leukemia before venetoclax-azacitidine treatment. The bar plot on the right shows the proportion of cell phenotypes in each sample. (C) Expression of a set of canonical markers used to identify monocytic and progenitor cell populations. Expression of BCL2 family genes and genes associated with response to venetoclax based on preclinical studies. Dot size corresponds to the percentage of cells expressing a given gene in a given cluster, and dot color corresponds to the average expression of a given gene in a given cluster. Circled dots are differentially expressed in the cluster (Padj<0.05, Bonferroni corrected t test). The clusters are the same as shown in panel (B), and their distributions across patients are shown in the bar plot on the right. DSS: drug sensitivity score; AML: acute myeloid leukemia; CM: conditioned medium; CTG: CellTiterGlo®; sAML: secondary AML; CR: complete remission; CRi: complete remission with incomplete blood recovery; RD: resistant disease; FAB: French-American-British; HPSC: hematopoietic stem and progenitor cell; GMP: granulocyte-monocyte progenitor; Pro-mono: pro-monocyte; DC: dendritic cells; BCL2: BCL2 family gene; Venetoclax: genes associated with venetoclax resistance based on preclinical studies.

Comment in

References

    1. Hourigan CS, Karp JE. Personalized therapy for acute myeloid leukemia. Cancer Discov. 2013;3(12):1336-1338. - PMC - PubMed
    1. Estey E, Levine RL, Löwenberg B. Current challenges in clinical development of “targeted therapies”: the case of acute myeloid leukemia. Blood. 2015;125(16):2461-2466. - PubMed
    1. Malani D, Kumar A, Brück O, et al. . Implementing a functional precision medicine tumor board for acute myeloid leukemia. Cancer Discov. 2022;12(2):388-401. - PMC - PubMed
    1. Tyner JW, Tognon CE, Bottomly D, et al. . Functional genomic landscape of acute myeloid leukaemia. Nature. 2018;562(7728):526-531. - PMC - PubMed
    1. Kornauth C, Pemovska T, Vladimer GI, et al. . Functional precision medicine provides clinical benefit in advanced aggressive hematologic cancers and identifies exceptional responders. Cancer Discov. 2022;12(2):372-387. - PMC - PubMed

MeSH terms

Substances

Associated data

LinkOut - more resources