. 2022 Dec 15;132(24):e159672.
doi: 10.1172/JCI159672.

Delivery of costimulatory blockade to lymph nodes promotes transplant acceptance in mice

Affiliations

Delivery of costimulatory blockade to lymph nodes promotes transplant acceptance in mice

Jing Zhao et al. J Clin Invest. .

Abstract

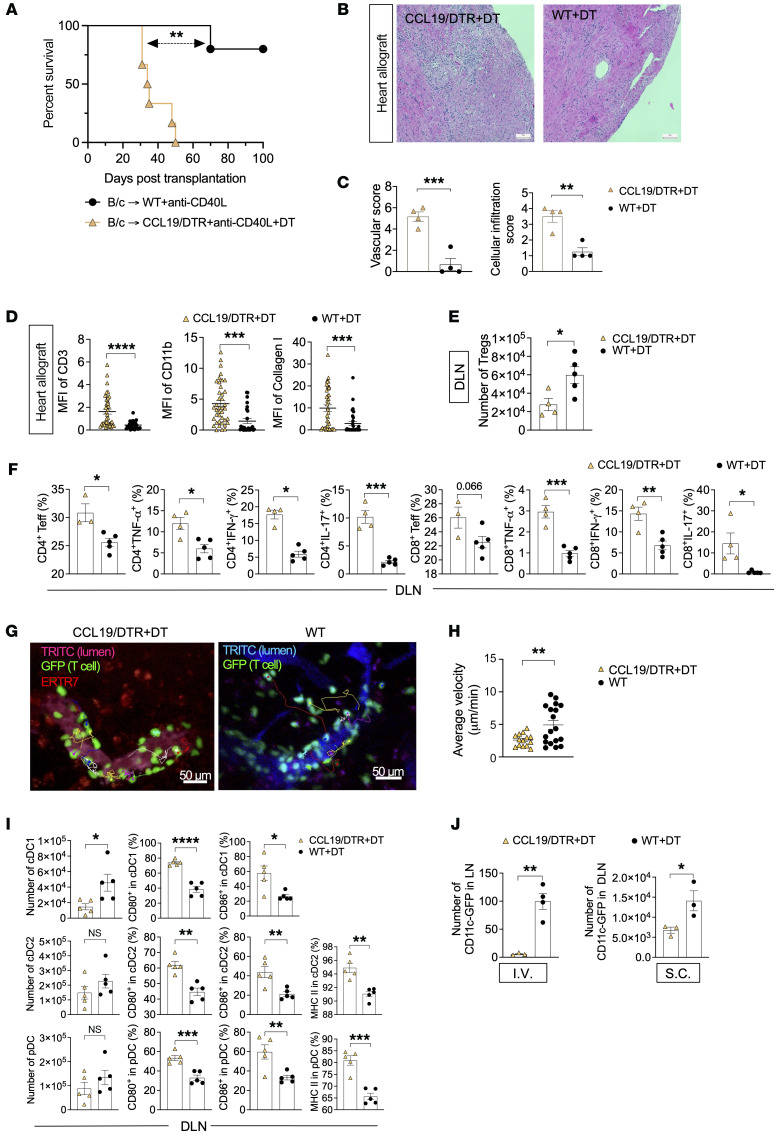
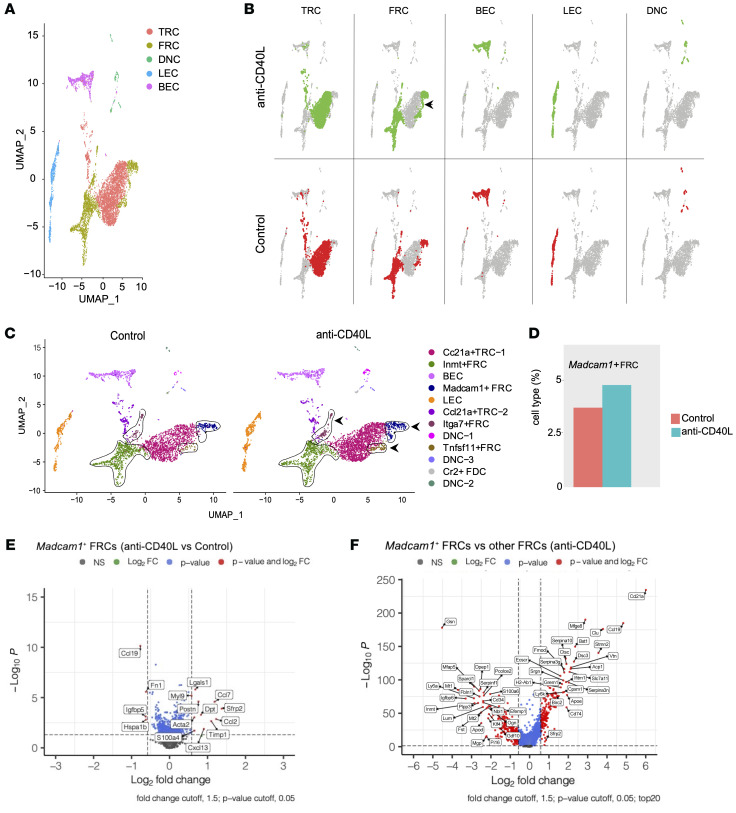
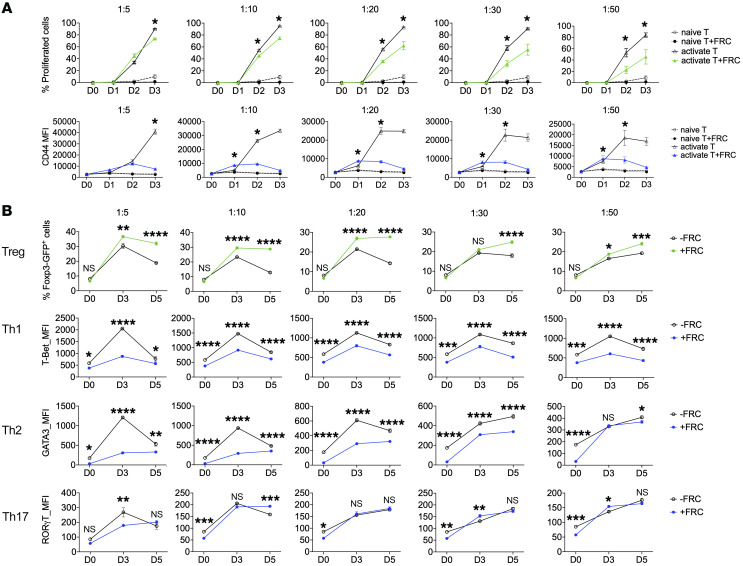
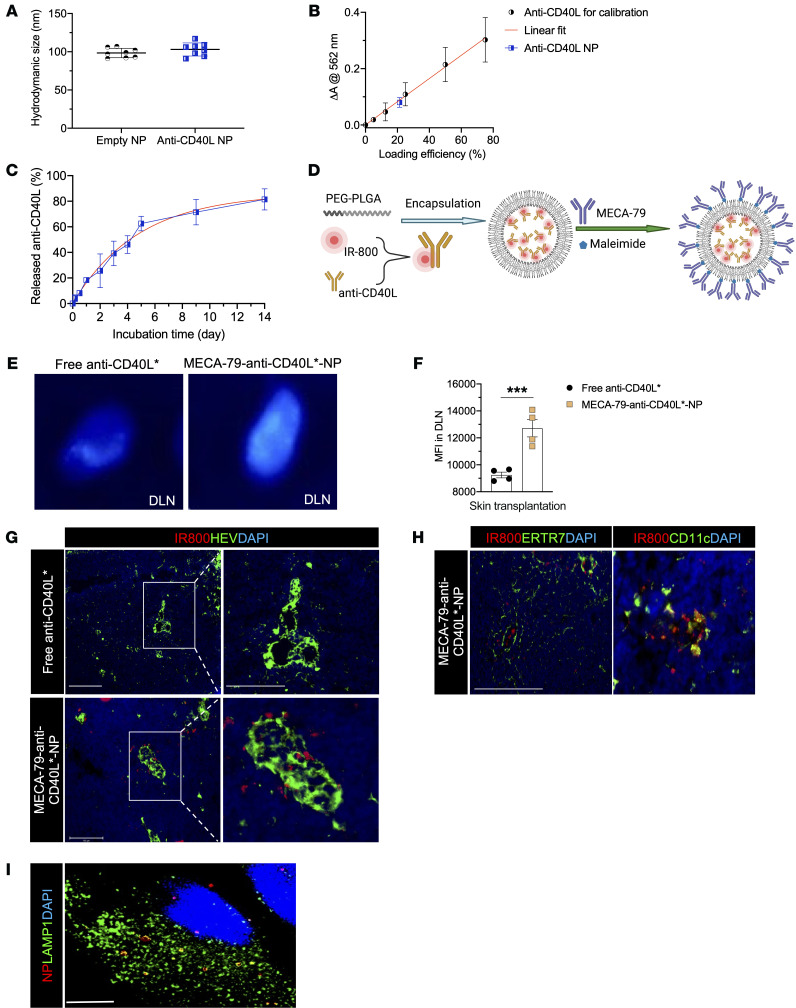
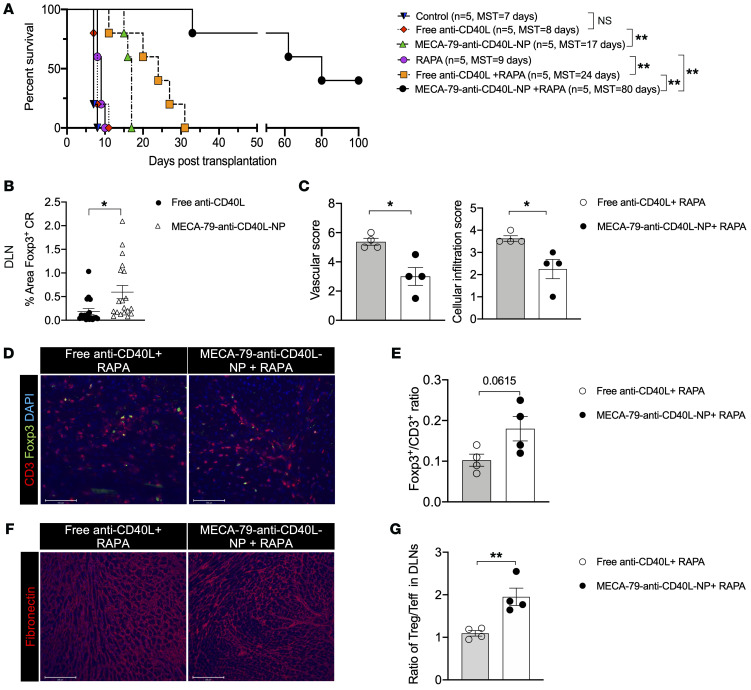
The lymph node (LN) is the primary site of alloimmunity activation and regulation during transplantation. Here, we investigated how fibroblastic reticular cells (FRCs) facilitate the tolerance induced by anti-CD40L in a murine model of heart transplantation. We found that both the absence of LNs and FRC depletion abrogated the effect of anti-CD40L in prolonging murine heart allograft survival. Depletion of FRCs impaired homing of T cells across the high endothelial venules (HEVs) and promoted formation of alloreactive T cells in the LNs in heart-transplanted mice treated with anti-CD40L. Single-cell RNA sequencing of the LNs showed that anti-CD40L promotes a Madcam1+ FRC subset. FRCs also promoted the formation of regulatory T cells (Tregs) in vitro. Nanoparticles (NPs) containing anti-CD40L were selectively delivered to the LNs by coating them with MECA-79, which binds to peripheral node addressin (PNAd) glycoproteins expressed exclusively by HEVs. Treatment with these MECA-79-anti-CD40L-NPs markedly delayed the onset of heart allograft rejection and increased the presence of Tregs. Finally, combined MECA-79-anti-CD40L-NPs and rapamycin treatment resulted in markedly longer allograft survival than soluble anti-CD40L and rapamycin. These data demonstrate that FRCs are critical to facilitating costimulatory blockade. LN-targeted nanodelivery of anti-CD40L could effectively promote heart allograft acceptance.

Keywords: Organ transplantation; Transplantation.


Figures

Figure 1
Figure 1. FRCs are critical for anti-CD40L–induced long-term heart allograft survival.
(A) Comparison of heart allograft survival between WT (n = 5 mice/group, MST > 100 days) and CCL19/DTR recipients (n = 6 mice/group, MST = 34.5 days) of BALB/c (B/c) hearts treated with high-dose anti-CD40L and DT. Log-rank test for graft survival. (B) Representative light micrographs of H&E-stained heart allograft sections from WT and CCL19/DTR recipients on day 50 after heart transplantation. Scale bars: 100 μm. (C) Comparison of cellular infiltration and vascular damage of heart allografts in WT and CCL19/DTR recipients (n = 4 mice/group). (D) Comparison of MFI of CD3+ cells, CD11b+ cells, and collagen I+ cells in heart allografts from WT and CCL19/DTR recipients (n = 4 mice/group). (E) Comparison of Treg numbers in DLNs from WT and CCL19/DTR recipients by flow cytometry (n = 4–5 mice/group). (F) Comparison between percentages of CD4+ Teffs, CD4+TNF-α+, CD4+IFN-γ+, CD4+IL-17+, CD8+ Teffs, CD8+TNF-α+, CD8+IFN-γ+, and CD8+IL-17+ cells in the DLNs of WT and CCL19/DTR recipients by flow cytometry (n = 4–5 mice/group). (G) Intravital imaging showed GFP+ T cells migrating around the HEVs in the DLNs of CCL19/DTR and WT skin allograft recipients. Scale bars: 50 μm. (H) Comparison of average velocity of T cells in the DLNs from WT and CCL19/DTR mice. (I) Comparison between numbers of type I conventional DCs (cDC1), type II conventional DCs (cDC2), and peripheral DCs (pDC) and percentages of CD80+ cDC1, CD86+ cDC1, CD80+ cDC2, CD86+ cDC2, MHC II+ cDC2, CD80+ pDC2, CD86+ pDC2, and MHC II+ pDC2 in the DLNs of WT and CCL19/DTR recipients by flow cytometry (n = 4–5 mice/group). (J) Comparison between numbers of CD11c-GFP cells in DLNs from WT and CCL19/DTR mice 2 hours after i.v. or s.c. injection (n = 3 mice/group). Student’s t test for 2-group comparisons. Data presented as mean ± SEM. *P < 0.05, **P < 0.01, ***P < 0.001, ****P < 0.0001.
Figure 2
Figure 2. Anti-CD40L treatment alters the phenotype of FRCs.
(A) Uniform manifold approximation and projection (UMAP) displays the stromal cell population map in LNs. (B) UMAP map from A, showing cell events by condition: anti-CD40L (top row) versus isotype control (bottom row). (C) UMAP visualization of clustering of different FRC populations, showing isotype control on left and anti-CD40L on right. The arrow shows the subset of FRCs that increase following anti-CD40L treatment. (D) Bar graph shows comparison of Madcam1+ FRC populations from C. (E) Volcano plot shows comparison of gene expression in Madcam1+ FRCs between the anti-CD40L–treated group and isotype control–treated group. (F) Volcano plot showing gene expression in Madcam1+ FRCs in comparison to other FRC subsets in the anti-CD40L–treated group.
Figure 3
Figure 3. FRCs exert tolerogenic regulation on CD4+ T cells.
(A) Analysis of naive versus activated T cells with/without FRC coculture at different time points. Flow cytometric analysis demonstrating MFI of different T cell subtypes on days 0, 1, 2, and 3 following coculture with FRCs in complete T cell medium supplemented with anti-CD28 and anti-CD3. FRCs suppressed T cell proliferation and activation as analyzed by flow cytometry on days 0, 1, 2, and 3. (B) CD4+ T cell differentiation in the presence or absence of FRCs was analyzed along with different FRC and T cell ratios by flow cytometric assay on days 0, 3, and 5. In the presence of FRCs, a higher percentage of Foxp3-GFP+ cells and lower MFI of Th1, Th2, and Th17 cells were found. Two-way ANOVA with Sidak’s multiple comparisons test for multiple comparisons of each group. Data presented as mean ± SEM. *P < 0.05, **P < 0.01, ***P < 0.001, ****P < 0.0001.
Figure 4
Figure 4. Characterization of anti-CD40L-NPs and nanodelivery of anti-CD40L to DLNs.
(A) Comparison of hydrodynamic size between empty NPs and anti-CD40L-NPs. (B) Loading efficiency of anti-CD40L in NPs was confirmed by BCA assay, using a calibration curve of free anti-CD40L. (C) Release kinetics of anti-CD40L from the NPs. (D) Schema of anti-CD40L–IR-800 (IR-800 indicated by *) synthesis and conjugation with MECA-79 mAb. Created with BioRender.com. (E) Skin allograft recipients were injected i.v. with either free anti-CD40L* or MECA-79–anti-CD40L*-NPs on day 8 after transplantation. Live fluorescence imaging at 24 hours after administration (i.v.) showed greater fluorescence signal in the DLNs of mice injected with MECA-79–anti-CD40L*-NPs. (F) Comparison of MFI in DLNs treated with free anti-CD40L*– or MECA-79–anti-CD40L*-NP–injected groups (n = 4 DLNs/group). (G) Immunofluorescent staining of HEVs of DLNs from mice treated with MECA-79–anti-CD40L*-NP or anti-CD40L*. Scale bars: 100 μm and 50 μm (zoomed images). (H) Immunofluorescent staining of CD11c+ cells and ERTR7 fibers in DLNs of mice treated with MECA-79–anti-CD40L*-NPs. Scale bar: 50 μm. (I) PNAd+ CHO cells internalize MECA-79-NPs. Scale bar: 20 μm. Student’s t test for 2-group comparisons. Data presented as mean ± SEM. ***P < 0.001.
Figure 5
Figure 5. MECA-79–anti-CD40L-NPs alone or in combination with rapamycin prolongs heart allograft survival in mice.
(A) Comparison of heart allograft survival between WT recipients of BALB/c hearts that were given no treatment, free anti-CD40L, or MECA-79–anti-CD40L-NPs (n = 5 mice/group; MST = 7 days vs. 8 days vs. 17 days, respectively); comparison of heart allograft survival between C57BL/6 recipients of BALB/c hearts that were treated with rapamycin (RAPA) (n = 5 mice/group, MST = 9 days), a combination of free anti-CD40L and RAPA (n = 5 mice/group, MST = 24 days), or a combination of MECA-79–anti-CD40L-NPs and RAPA (n = 5 mice/group, MST = 80 days). Log-rank test for graft survival. (B) Comparison of percentage of area in cortical area of Foxp3+ Tregs in DLNs by immunofluorescence. (C) Comparison of cellular infiltration and vascular damage between heart allografts in WT recipients following treatment with a combination of free anti-CD40L and RAPA or a combination of MECA-79–anti-CD40L-NPs and RAPA (n = 4 mice/group). (D) Representative florescence micrographs of CD3+ T cells and Foxp3+ Tregs in heart allograft sections of WT recipients. Scale bars: 100 μm. (E) Quantification of Foxp3+/CD3+ ratio in heart allografts by immunofluorescence. (F) Representative fluorescence micrographs of fibronectin staining in heart allograft sections of WT recipients. Scale bars: 100 μm. (G) Comparison of the Treg/Teff ratio in DLNs by flow cytometry. Student’s t test for 2-group comparisons. Data presented as mean ± SEM. *P < 0.05; **P < 0.01.

Comment in

  • Fibroblastic reticular cells orchestrate long-term graft survival following recipient treatment with CD40 ligand-targeted costimulatory blockade

References

    1. Li X, et al. Lymph node fibroblastic reticular cells deposit fibrosis-associated collagen following organ transplantation. J Clin Invest. 2020;130(8):4182–4194. - PMC - PubMed
    1. Azzi J, et al. Targeted delivery of immunomodulators to lymph nodes. Cell Rep. 2016;15(6):1202–1213. doi: 10.1016/j.celrep.2016.04.007. - DOI - PMC - PubMed
    1. Bahmani B, et al. Targeted delivery of immune therapeutics to lymph nodes prolongs cardiac allograft survival. J Clin Invest. 2018;128(11):4770–4786. doi: 10.1172/JCI120923. - DOI - PMC - PubMed
    1. Bahmani B, et al. Ectopic high endothelial venules in pancreatic ductal adenocarcinoma: A unique site for targeted delivery. EBioMedicine. 2018;38:79–88. doi: 10.1016/j.ebiom.2018.11.030. - DOI - PMC - PubMed
    1. Bahmani B, et al. Active targeted delivery of immune therapeutics to lymph nodes. Curr Opin Organ Transplant. 2018;23(1):8–14. doi: 10.1097/MOT.0000000000000495. - DOI - PMC - PubMed

Publication types