. 2022 Dec 15;132(24):e158742.
doi: 10.1172/JCI158742.

Thalamocortical circuits drive remifentanil-induced postoperative hyperalgesia

Affiliations

Thalamocortical circuits drive remifentanil-induced postoperative hyperalgesia

Yan Jin et al. J Clin Invest. .

Abstract

Remifentanil-induced hyperalgesia (RIH) is a severe but common postoperative clinical problem with elusive underlying neural mechanisms. Here, we discovered that glutamatergic neurons in the thalamic ventral posterolateral nucleus (VPLGlu) exhibited significantly elevated burst firing accompanied by upregulation of Cav3.1 T-type calcium channel expression and function in RIH model mice. In addition, we identified a glutamatergic neuronal thalamocortical circuit in the VPL projecting to hindlimb primary somatosensory cortex glutamatergic neurons (S1HLGlu) that mediated RIH. In vivo calcium imaging and multi-tetrode recordings revealed heightened S1HLGlu neuronal activity during RIH. Moreover, preoperative suppression of Cav3.1-dependent burst firing in VPLGlu neurons or chemogenetic inhibition of VPLGlu neuronal terminals in the S1HL abolished the increased S1HLGlu neuronal excitability while alleviating RIH. Our findings suggest that remifentanil induces postoperative hyperalgesia by upregulating T-type calcium channel-dependent burst firing in VPLGlu neurons to activate S1HLGlu neurons, thus revealing an ion channel-mediated neural circuit basis for RIH that can guide analgesic development.

Keywords: Anesthesiology; Neuroscience; Pain.


Figures

Figure 1
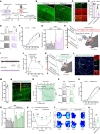
Figure 1. Remifentanil induces postoperative hyperalageisa in incisional mice.
(A) Schematic of the experimental procedure for surgery and behavioral tests of mice. (B and C) Time course of changes in the response threshold to mechanical force assessed using von Frey tests in ipsilateral (B, F(1,21) = 16.14, P = 0.0006) and contralateral (C, F(1,21) = 52.68, P < 0.0001) hindpaws of mice with plantar incision infused with remi (inci + remi) or saline (inci + saline) (inci + saline, n = 11 mice; inci + remi, n = 12 mice). (D and E) Time course of changes in the response to thermal pain assessed using Hargreaves tests in ipsilateral (D, F(1,17) = 0.9832, P = 0.3353) and contralateral (E, F(1,17) = 5.323, P = 0.0339) hindpaws in inci + remi and inci + saline mice (inci + saline, n = 10; inci + remi, n = 9 mice). (F and G) Time course of spontaneous pain scores of ipsilateral (F, F(1,18) = 3.308, P = 0.0856) and contralateral (G, F(1,18) = 6.135, P = 0.0234) hindpaws in inci + remi and inci + saline mice (n = 10 mice per group). (H) Schematic for RT-PEAP tests. (I and J) Heatmaps showing the locations of naive and incisional mice treated with saline or remifentanil in RT-PEAP tests. (K) Summary of data from von Frey filament stimulus-induced place aversion (n = 10 mice per group; F(3,36) = 5.113, P = 0.0047). Data are presented as mean ± SEM. *P < 0.05, **P < 0.01, ***P < 0.001. 2-way repeated measures ANOVA with post hoc Bonferroni’s test in (BG); 1-way ANOVA with post hoc Bonferroni’s test in (K).
Figure 2
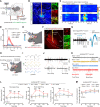
Figure 2. Enhanced ipsilateral VPLGlu neuronal activity in the mouse model of RIH.
(A) Schematic diagram of the fiber photometry setup. (B) Representative images validating the virus injection site (left) and GCaMP6m+ neurons costained with glutamate immunofluorescence (right) within the ipsilateral VPL. Scale bars: 1 mm (left) and 20 μm (right). (C and D) Heatmaps (C) and the mean data (D) showing VPL-GluGCaMP6m signals in mice. Color scale at the right in (C) indicates ΔF/F (%). (E) Schematic diagram of optogenetic tagging and electrophysiological recording. Enlargement showing optrodes. (F) Representative images of virus injection site of the VPL (left) and Cherry+ neurons colocalized with glutamate immunofluorescence (right). Scale bars: 200 μm (left) and 20 μm (right). (G) Example recording of spontaneous and light-evoked spikes from a VPLGlu neuron (left) and overlay of averaged spontaneous (red) and light-evoked (blue) spike waveforms from the example unit (right). (H) Schematic of the multi-channel recording. Enlargement showing the multichannel tetrode. (I) Average spike waveform of widespiking putative VPLGlu neurons recorded through a single tetrode. (J) Representative traces recorded from a VPLGlu neuron showing the spontaneous burst and tonic firing. (K) Example traces of the spike firing recorded from ipsilateral VPLGlu neurons. Tonic and burst firing are highlighted by dotted frames. (L and M) Quantitative data of total spike firing rate (left, F(3,445.018) = 5.306, P = 0.002), burst number/min (middle, F(3,459.614) = 6.161, P < 0.0001), percentage of spikes in bursts (right, F(3,418.152) = 15.572, P = 0.005), and tonic spike firing rate (M, F(3,527.508) = 1.086, P = 0.354) of ipsilateral VPLGlu neurons (n = 37–91 neurons from 8 mice per group). Data are presented as mean ± SEM. *P < 0.05, **P < 0.01, ***P < 0.001. Linear mixed models with post hoc Bonferroni’s test in (L and M).
Figure 3
Figure 3. Hyperactivity of burst firing in ipsilateral VPLGlu neurons causes postoperative RIH.
(A) Schematic diagram of whole-cell recordings. (B) Spontaneous burst firing from an ipsilateral VPLGlu neuron. (C) The percent of spontaneous burst firing in ipsilateral VPLGlu neurons (n = 60–65 neurons from 6 mice per group; P = 0.0011, κ2 test). (DF) Representative traces (D) and quantitative data of the number (E, F(3,529.867) = 7.332, P < 0.0001) and rheobase (F, F(3,104) = 4.722, P = 0.005) from 10 mice per group). (G) Virus injection and recording configuration in brain slices. (H and I) Representative traces (H) and the percentage (I) of burst firing induced by yellow light (n = 10 neurons from 5 mice). (J) Schematic of multi-channel recordings. (K) Viral expression within the VPL. Scale bars, 200 μm (left) and 20 μm (right). (L) The percentage of eNpHR3.0-EYFP-labeled neurons coexpressing with glutamate immunofluorescence (n = 16 slices from 8 mice). (M) Raster plot (top) and the histogram (bottom) showing the firing rate of VPLGlu neurons. (N) Multi-channel recordings of spike firings from VPLGlu neurons. (O) The percentage of bursts induced by yellow light (n = 10 neurons from 5 mice). (P) Quantitative data of spike frequency (left, F(1,280.105) = 14.96, P = 0.048) and burst number/min (right, F(1,286.984) = 5.312, P = 0.022) of VPLGlu neurons (n = 50 neurons from 8 mice per group). (Q) Summary of pain thresholds in mice (n = 8 mice per group; F(2,32) = 9.602, P = 0.0005).Data are presented as mean ± SEM. *P < 0.05, **P < 0.01, ***P < 0.001. Linear mixed models with post hoc Bonferroni’s test in E and P; nested 1-way ANOVA test in F; 2-way repeated measures ANOVA with post hoc Bonferroni’s test in Q.
Figure 4
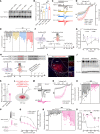
Figure 4. Downregulation of T-type calcium channels blocks burst firing and relieves postoperative RIH.
(A and B) Cav3.1 protein level in cell membrane fractions from ipsilateral VPL tissue (B, n = 6–7 mice per group; F(3,22) = 7.633, P = 0.0011). (C) Representative traces of T-type calcium currents. (D and E) Current-voltage (I-V) curves (D, F(3,569.088) = 46.526, P < 0.0001) and quantitative data (E, F(3,52) = 6.694, P = 0.0007; at −115 mV) of current density (n = 14 neurons from 6 mice per group). (F) Schematic of the experimental procedure. (G) The effect of microinjection of Mibe on the postoperative hyperalgesia (n = 8 mice per group; F(1,14) = 14.34, P = 0.002). (H) Schematic for virus injection. (I) Virus expression within the VPL. Scale bars: 200 μm (left) and 20 μm (right). (J and K) Cav3.1 expression in ipsilateral VPL lysates (AAV-control, n = 4 mice; AAV-RNAi, n = 5 mice; t(7) = 3.08, P = 0.0178). (L) Schematic of virus injection and recording configuration. (M) Representative traces of T-type calcium currents. (N and O) Current-voltage (I-V) curves (N, F(1,622.864) = 267.89, P < 0.0001) and quantitative data (O, t(46) = 6.265, P < 0.0001; at −115 mV) of current density (n = 24 neurons from 8 mice per group). (PR) Representative traces (P) and quantitative data of the number (Q, F(1,333) = 53.601, P < 0.0001) and rheobase (R, t(20) = 4.215, P = 0.0004) of the burst spike (n = 33 neurons from 11 mice per group). (S) Quantitative data for mechanical thresholds (AAV-control, n = 10 mice; AAV-RNAi, n = 8 mice; F(1,16) = 148.2, P < 0.0001). Data are presented as mean ± SEM. *P < 0.05, **P < 0.01, ***P < 0.001. 1-way ANOVA with post hoc Bonferroni’s test in (B); linear mixed models with post hoc Bonferroni’s test in (D, N and Q); nested 1-way ANOVA test in (E); 2-way repeated measures ANOVA with post hoc Bonferroni’s test in (G and S); unpaired 2-tailed Student’s t test in (K); and nested 2-tailed t test in (O and R).
Figure 5
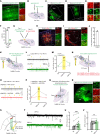
Figure 5. Dissection of the VPLGlu→S1HLGlu circuit.
(A) Representative images of EYFP+ fibers in the S1HL. Scale bars: 200 μm (left) and 20 μm (right). (B) Schematic of strategy for virus injection. (C and D) Viral expression within the VPL (C) and S1HL (D). Scale bars: 200 μm. (E and F) Colocalization of GFP+ and glutamate+ signals within the S1HL (F, n = 5 slices from 5 mice per group; t(8) = 32.36, P < 0.0001) showing. Scale bars: 20 μm in (E). (G) Schematic of the virus tracing strategy. (H) The injected site (left) and viral expression (right) within the S1HL. Scale bars: 200 μm (left) and 20 μm (right). (I and J) Colocalization of DsRed-labeled neurons and glutamate+ signals within the VPL (J, n = 5 slices from 5 mice). Scale bars: 200 μm (left) and 20 μm (right) in (I). (K) Schematic of the optrode implantation in the S1HL and virus infusion. (L and M) Representative traces (L) and summarized data (M, n = 13 neurons from 6 mice per group; F(1,74) = 22.81, P < 0.0001) of the firing rate of the S1HLGlu neurons. (N) Schematic of of the experimental procedure. (O and P) Example traces (O) and quantitative data (P) of spike firing in S1HLGlu neurons (n = 25–32 neurons from 8 mice per group; F(1,190.74) = 26.171, P < 0.0001). (Q) Schematic for the preparation of thalamocortical somatosensory slices. (R) EYFP+ fibers in thalamocortical somatosensory slices. Scale bars: 1 mm (left) and 20 μm (right). (S) Schematic for the light stimulation within the VPL and recording configuration. (TV) Representative traces and quantitative data of the frequency (U, t(15) = 4.775, P = 0.0002) and amplitude (V, t(15) = 0.2537, P = 0.8212) of sEPSCs recorded from S1HLGlu neurons. Data are presented as mean ± SEM. **P < 0.01, ***P < 0.001. Unpaired 2-tailed Student’s t test in F; linear mixed models with post hoc Bonferroni’s test in M and P; paired 2-tailed t test in U and V.
Figure 6
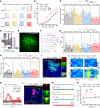
Figure 6. Increased ipsilateral S1HLGlu neuronal excitability in mice with remifentanil induced allodynia.
(AC) Representative traces (A) and quantitative data of the firing rate (B, F(3,956.954) = 18.748, P < 0.0001) and rheobase (C, F(3,28) = 8.543, P = 0.0003) of action potentials recorded in ipsilateral S1HLGlu neurons (n = 23-25 neurons from 8 mice per group). (D) Schematic paradigm of in vivo 2-photon (2P) calcium imaging in head-restrained C57 mice. (E and F) Representative images of 2P GCaMP6f+ imaging fields (E) and numbers matching spontaneous ΔF/F time series traces (F) of ipsilateral S1HLGlu neurons. Scale bar: 20 μm. (G and H) Average of spontaneous calcium responses (G, F(3,28) = 4.4, P = 0.0117) and calcium event rates (H, F(3,28) = 4.505, P = 0.0106) in GCaMP6+ ipsilateral S1HLGlu neurons (n = 154–159 neurons from 8 mice per group). (I) Representative images of GCaMP6m expression within the VPL (left) and colocalization of GCaMP6m+ neurons and glutamate immunofluorescence (right). Scale bars: 200 μm (left) and 50 μm (right). (J and K) Heatmaps (J) and the representative average ΔF/F traces (K) of S1HL GluGCaMP6m signals. (L) Representative images of the tetrode placement site in the S1HL. Scale bars: 200 μm (left) and 40 μm (right). (M and N) Example traces (M) and quantitative data (N, n = 22–48 neurons from 8 mice per group; F(3,575.662) = 9.436, P < 0.0001) of spike firing of ipsilateral S1HLGlu neurons. Dil, 1,1′-dioctadecyl-3,3,3′,3′-tetramethylindocarbocyanine perchlorate. Data are presented as mean ± SEM. *P < 0.05, **P < 0.01, ***P < 0.001. Linear mixed models with post hoc Bonferroni’s test in (B and N); nested 1-way ANOVA with post hoc Bonferroni’s test in (C, G and H).
Figure 7
Figure 7. The VPLGlu
S1HLGlu circuit controls allodynia in RIH mice. (A) Schematic of the experimental procedure. (B) c-Fos expression in ipsilateral S1HL. Scale bars: 200 μm. (C) Colocalization of c-Fos+ neurons with tdTomato+. Scale bars: 20 μm. (D) The percentage of c-Fos+ and glutamate expression (left, t(14) = 0.4611, P = 0.6518; right, t(14) = 17.61, P < 0.0001) in the ipsilateral S1HL (n = 8 slices from 5 mice per group). (EG) Representative traces (E) and quantitative data of the firing rate (F, F(1,348.99) = 67.193, P < 0.0001) and rheobase (G, t(33) = 4.207, P = 0.0002) of action potentials from ipsilateral S1HLGlu neurons (n = 20 neurons from 8 ACSF mice; n = 15 neurons from 7 Mibe mice). (H) Virus injection and optrode implantation in RIH mice. (I and J) Example traces (I) and quantitative data (J) for spike firing (n = 25–49 neurons from 8 mice per group; F(1,270.918) = 18.013, P = 0.0002). (K) Schematic of microinjection. (L) Viral expression within the VPL. Scale bars: 200 μm (left) and 20 μm (right). (M) The percentage of glutamate+ neurons expressing GFP signals (n = 8 slices from 5 mice). (N) GFP+ fibers in the S1HL. Scale bars: 200 μm. (O) Effects of CNO on VPLGlu neurons (n = 5 neurons from 5 mice per group; F(1,188) = 118.596, P < 0.0001). (PR) Representative traces (P) and quantitative data of the firing rate (Q, F(1,460.808) = 39.677, P < 0.0001) and rheobase (R, t(13) = 4.954, P = 0.0003) of action potentials from ipsilateral S1HLGlu neurons (n = 23 neurons from 7 GFP mice or 8 GFP-hM4Di mice).(S) Mechanical pain thresholds in RIH mice injected with CNO in the S1HL (n = 9 mice per group; F(1,16) = 64.69, P < 0.0001). (T and U) Heatmaps (T) and summary data (U, GFP, n = 10 mice; hM4Di-GFP, n = 9 mice; t(17) = 1.242, P = 0.231) for RT-PEAP tests of RIH mice. Data are presented as mean ± SEM. *P < 0.05, **P < 0.01, ***P < 0.001. Unpaired 2-tailed Student’s t test in D and U, linear mixed models with post hoc Bonferroni’s test in F, J, O and Q, nested2-tailed t test in G and R; 2-way repeated measures ANOVA with post hoc Bonferroni’s test in S.
Figure 8
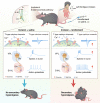
Figure 8. Remifentanil-induced functional upregulation of T-type calcium channels enhances thalamocortical VPLGlu→S1HLGlu circuit activity to promote secondary pain in mice.
Plantar incision to the left hindpaw with intra-operative remifentanil infusion leads to enhanced burst firing via increased T-type calcium channel activity in ipsilateral VPLGlu neurons. The elevated ipsilateral VPLGlu neuronal burst firing upregulates the sEPSCs in ipsilateral S1HLGlu neurons. The subsequent strong excitation of ipsilateral S1HLGlu neurons was associated with central sensitization and postoperative secondary pain in right hindpaws of mice.

Comment in

  • Opioid-induced hyperalgesia: Are thalamic T-type calcium channels treatment targets? doi: 10.1172/JCI165977

References

    1. Feldman PL, et al. Design, synthesis, and pharmacological evaluation of ultrashort- to long-acting opioid analgesics. J Med Chem. 1991;34(7):2202–2208. doi: 10.1021/jm00111a041. - DOI - PubMed
    1. Yu EH, et al. Remifentanil tolerance and hyperalgesia: short-term gain, long-term pain? Anaesthesia. 2016;71(11):1347–1362. doi: 10.1111/anae.13602. - DOI - PubMed
    1. Zhu X, et al. Distinct thalamocortical circuits underlie allodynia induced by tissue injury and by depression-like states. Nat Neurosci. 2021;24(4):542–553. doi: 10.1038/s41593-021-00811-x. - DOI - PubMed
    1. Kim SH, et al. Remifentanil-acute opioid tolerance and opioid-induced hyperalgesia: a systematic review. Am J Ther. 2015;22(3):e62–e74. doi: 10.1097/MJT.0000000000000019. - DOI - PubMed
    1. Fletcher D, Martinez V. Opioid-induced hyperalgesia in patients after surgery: a systematic review and a meta-analysis. Br J Anaesth. 2014;112(6):991–1004. doi: 10.1093/bja/aeu137. - DOI - PubMed

Publication types