

Air pollution and mobility patterns in two Ugandan cities during COVID-19 mobility restrictions suggest the validity of air quality data as a measure for human mobility
- PMID: 36520281
- PMCID: PMC9751517
- DOI: 10.1007/s11356-022-24605-1
Air pollution and mobility patterns in two Ugandan cities during COVID-19 mobility restrictions suggest the validity of air quality data as a measure for human mobility
Abstract
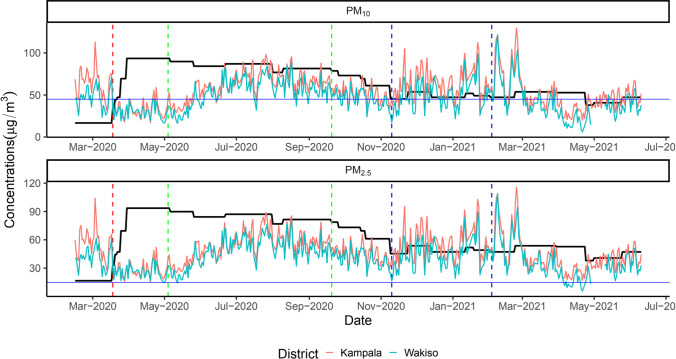
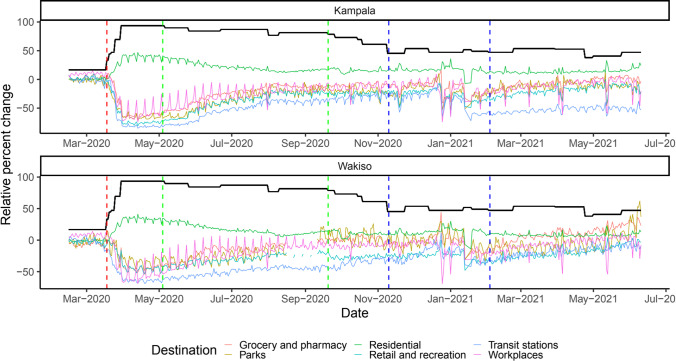
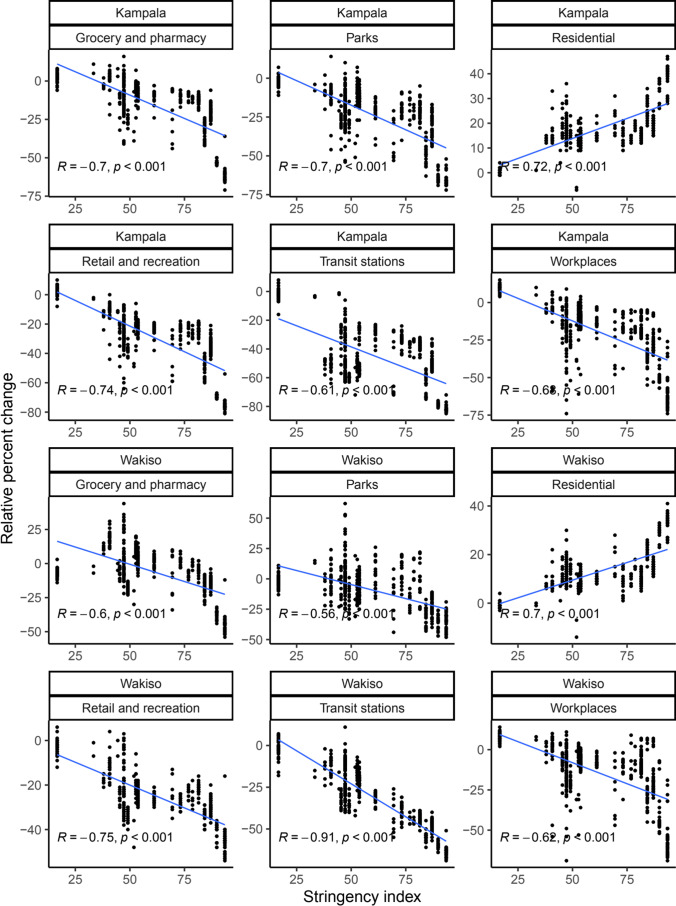
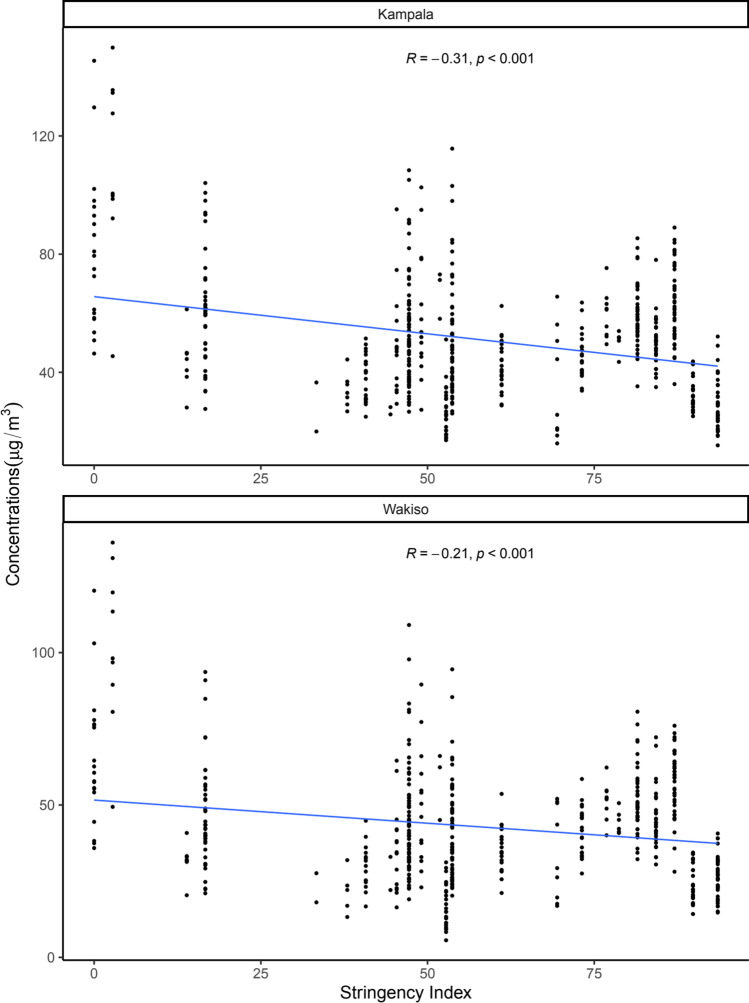
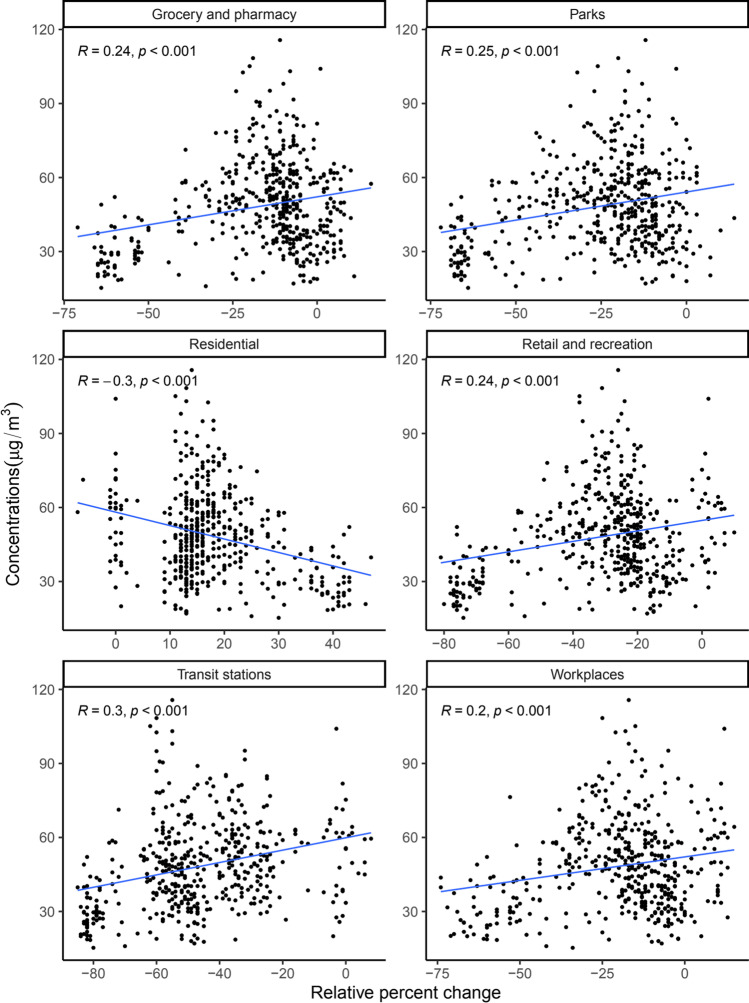
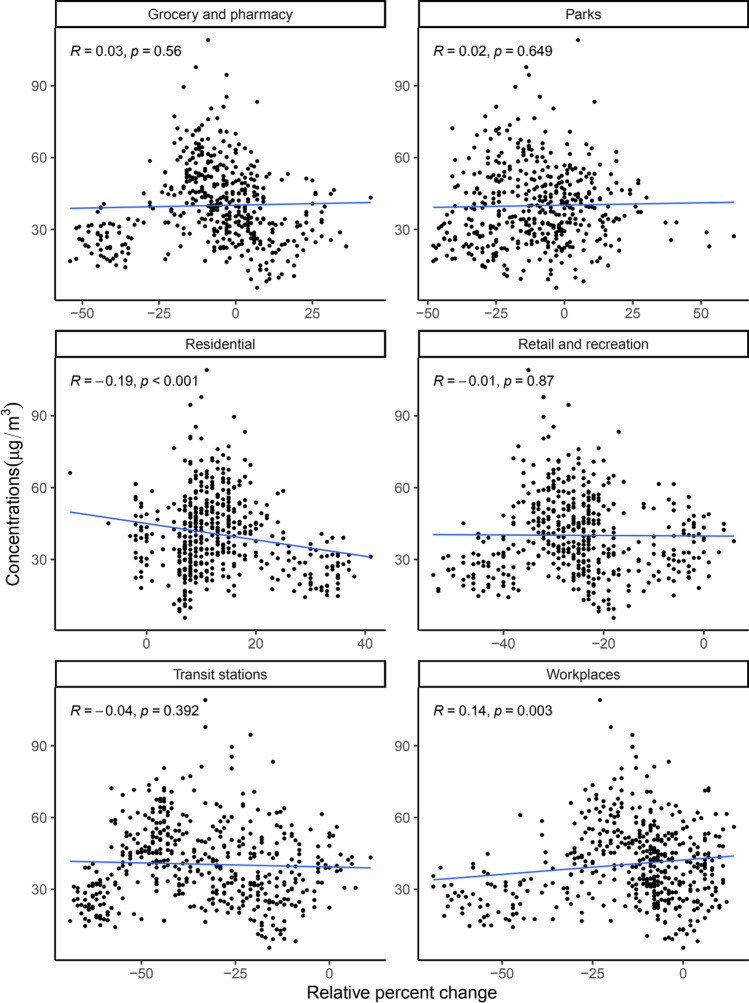
We explored the viability of using air quality as an alternative to aggregated location data from mobile phones in the two most populated cities in Uganda. We accessed air quality and Google mobility data collected from 15th February 2020 to 10th June 2021 and augmented them with mobility restrictions implemented during the COVID-19 lockdown. We determined whether air quality data depicted similar patterns to mobility data before, during, and after the lockdown and determined associations between air quality and mobility by computing Pearson correlation coefficients ([Formula: see text]), conducting multivariable regression with associated confidence intervals (CIs), and visualized the relationships using scatter plots. Residential mobility increased with the stringency of restrictions while both non-residential mobility and air pollution decreased with the stringency of restrictions. In Kampala, PM2.5 was positively correlated with non-residential mobility and negatively correlated with residential mobility. Only correlations between PM2.5 and movement in work and residential places were statistically significant in Wakiso. After controlling for stringency in restrictions, air quality in Kampala was independently correlated with movement in retail and recreation (- 0.55; 95% CI = - 1.01- - 0.10), parks (0.29; 95% CI = 0.03-0.54), transit stations (0.29; 95% CI = 0.16-0.42), work (- 0.25; 95% CI = - 0.43- - 0.08), and residential places (- 1.02; 95% CI = - 1.4- - 0.64). For Wakiso, only the correlation between air quality and residential mobility was statistically significant (- 0.99; 95% CI = - 1.34- - 0.65). These findings suggest that air quality is linked to mobility and thus could be used by public health programs in monitoring movement patterns and the spread of infectious diseases without compromising on individuals' privacy.
Keywords: Air quality; COVID-19; Human mobility; Infectious diseases; Particulate matter; Transmission.
© 2022. The Author(s).
Conflict of interest statement
The authors declare no competing interests.
Figures
Similar articles
-
Unprecedented reduction in air pollution and corresponding short-term premature mortality associated with COVID-19 lockdown in Delhi, India.J Air Waste Manag Assoc. 2021 Sep;71(9):1085-1101. doi: 10.1080/10962247.2021.1905104. Epub 2021 Apr 15. J Air Waste Manag Assoc. 2021. PMID: 33764280
-
How mobility restrictions policy and atmospheric conditions impacted air quality in the State of São Paulo during the COVID-19 outbreak.Environ Res. 2021 Jul;198:111255. doi: 10.1016/j.envres.2021.111255. Epub 2021 May 8. Environ Res. 2021. PMID: 33971134 Free PMC article.
-
Air quality and health impact of 2019-20 Black Summer megafires and COVID-19 lockdown in Melbourne and Sydney, Australia.Environ Pollut. 2021 Apr 1;274:116498. doi: 10.1016/j.envpol.2021.116498. Epub 2021 Jan 13. Environ Pollut. 2021. PMID: 33524649
-
A mini-review: positive impact of COVID-19 on Arial health and ecology.Environ Sci Pollut Res Int. 2022 Jun;29(27):40520-40530. doi: 10.1007/s11356-022-19961-x. Epub 2022 Mar 29. Environ Sci Pollut Res Int. 2022. PMID: 35349061 Free PMC article. Review.
-
Effect of COVID-19 pandemic on air quality: a study based on Air Quality Index.Environ Sci Pollut Res Int. 2021 Jul;28(27):35564-35583. doi: 10.1007/s11356-021-14462-9. Epub 2021 May 25. Environ Sci Pollut Res Int. 2021. PMID: 34036496 Free PMC article. Review.
Cited by
-
Urban birds become less fearful following COVID-19 reopenings.Proc Biol Sci. 2023 Aug 30;290(2005):20231338. doi: 10.1098/rspb.2023.1338. Epub 2023 Aug 23. Proc Biol Sci. 2023. PMID: 37608719 Free PMC article.
-
A Study on Environmental Impact of Slow Moving Electric Vehicles Using Microsimulation on Lucknow Urban Road With an On-Ramp.Environ Health Insights. 2024 Mar 15;18:11786302241231706. doi: 10.1177/11786302241231706. eCollection 2024. Environ Health Insights. 2024. PMID: 38495797 Free PMC article.
-
AirQo sensor kit: A particulate matter air quality sensing kit custom designed for low-resource settings.HardwareX. 2023 Nov 2;16:e00482. doi: 10.1016/j.ohx.2023.e00482. eCollection 2023 Dec. HardwareX. 2023. PMID: 38020545 Free PMC article.
References
-
- Aspler A, Chong H, Kunimoto D, Chui L, Der E, Boffa J, Long R. Sustained intra- and inter-jurisdictional transmission of tuberculosis within a mobile, multi-ethnic social network: lessons for tuberculosis elimination”. Can J Publ Health. 2010;101(3):205–209. doi: 10.1007/BF03404391. - DOI - PMC - PubMed
MeSH terms
Substances
Grants and funding
LinkOut - more resources
Full Text Sources
Medical
