. 2023 Feb 6;220(2):e20220605.
doi: 10.1084/jem.20220605. Epub 2022 Dec 15.

Microglial pattern recognition via IL-33 promotes synaptic refinement in developing corticothalamic circuits in mice

Affiliations

Microglial pattern recognition via IL-33 promotes synaptic refinement in developing corticothalamic circuits in mice

Rafael T Han et al. J Exp Med. .

Abstract

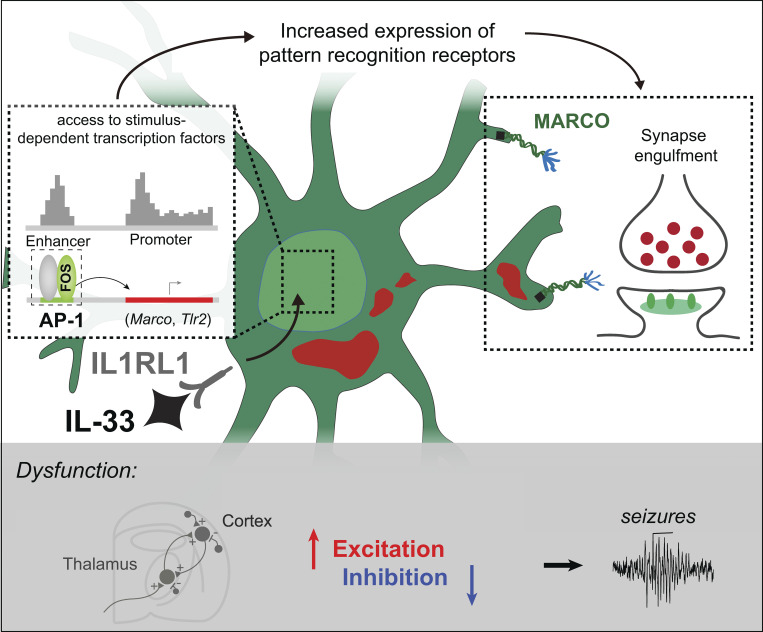
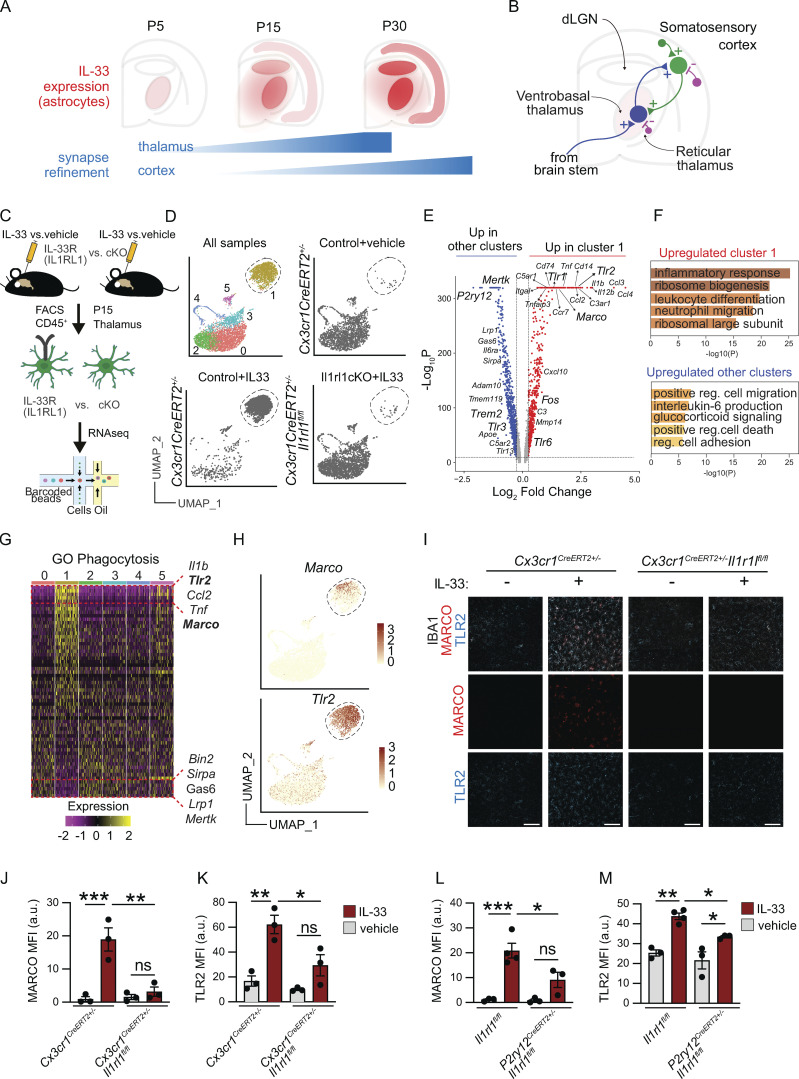
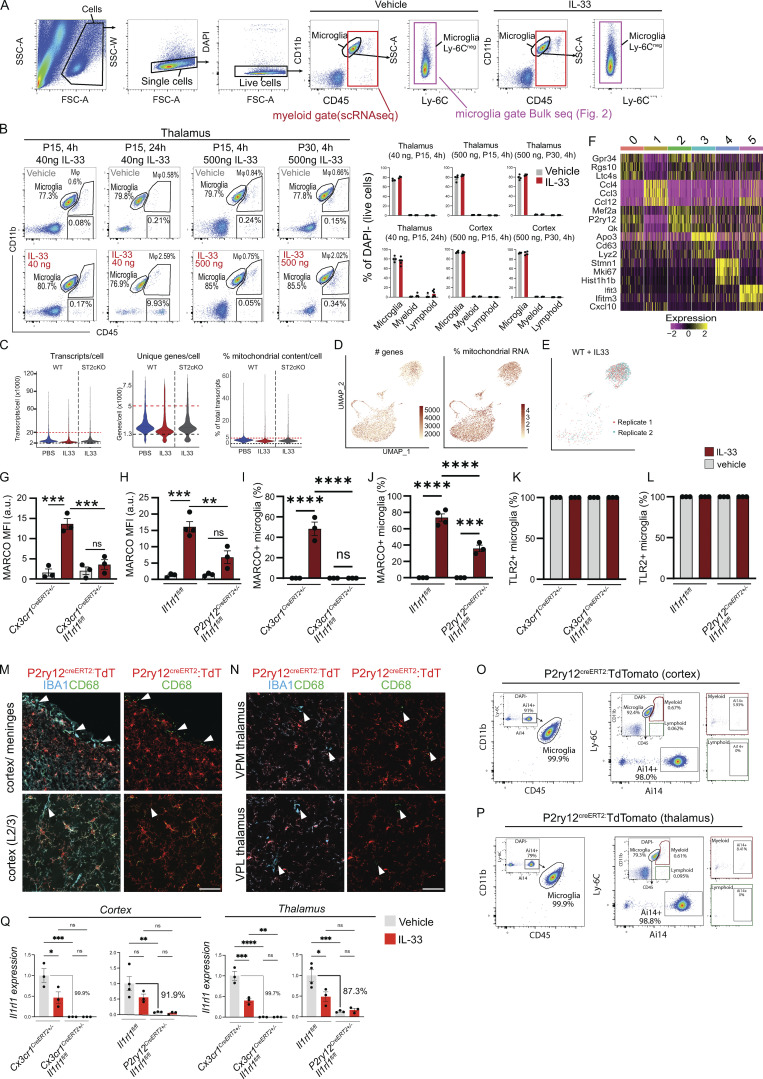
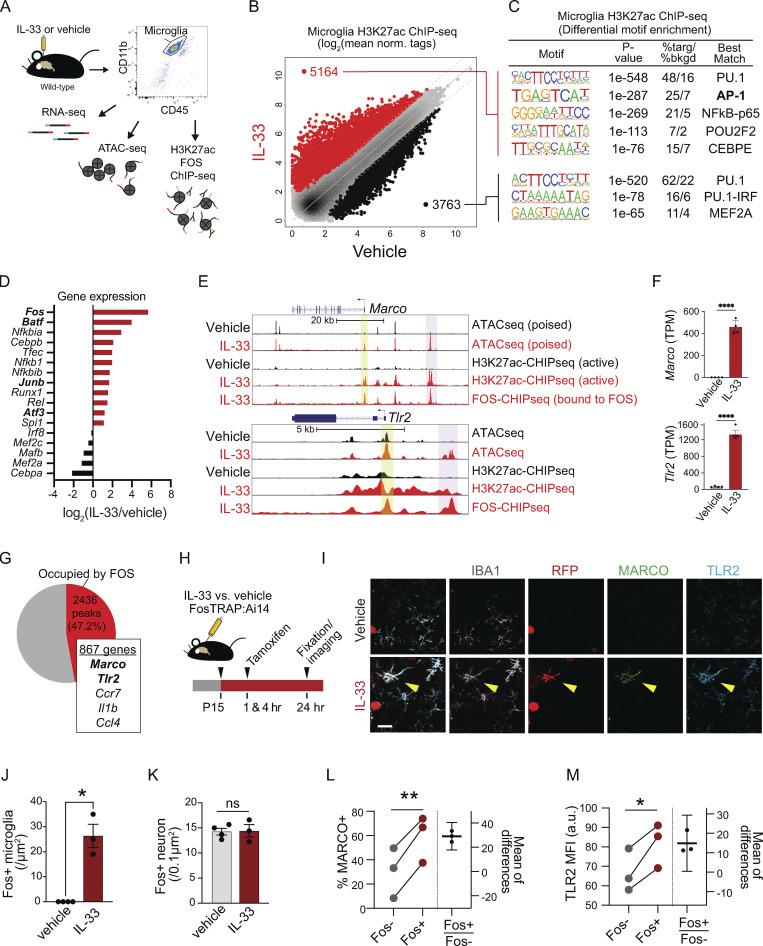
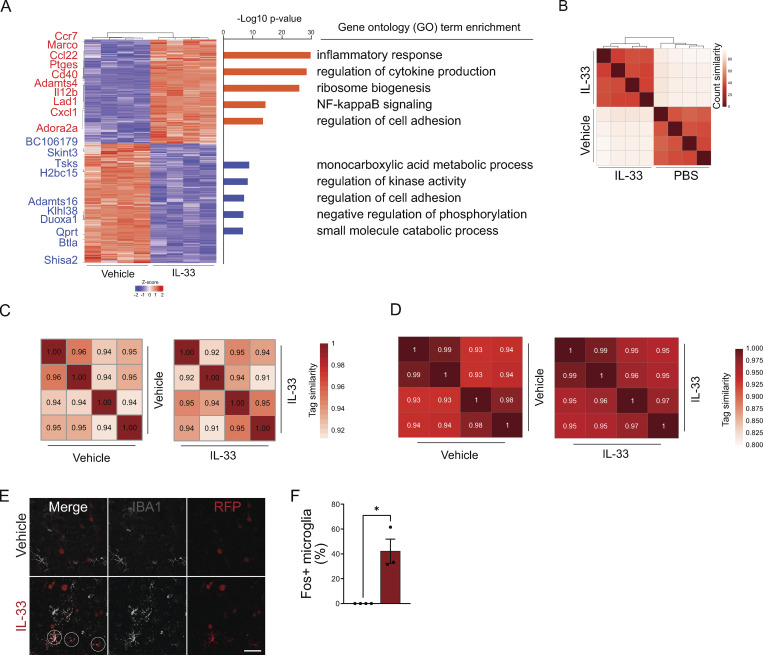
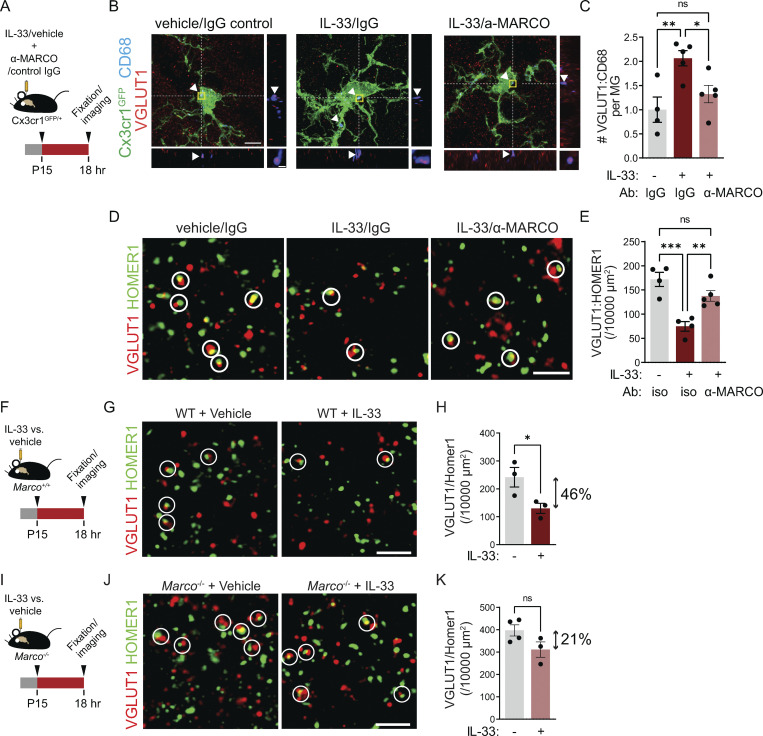
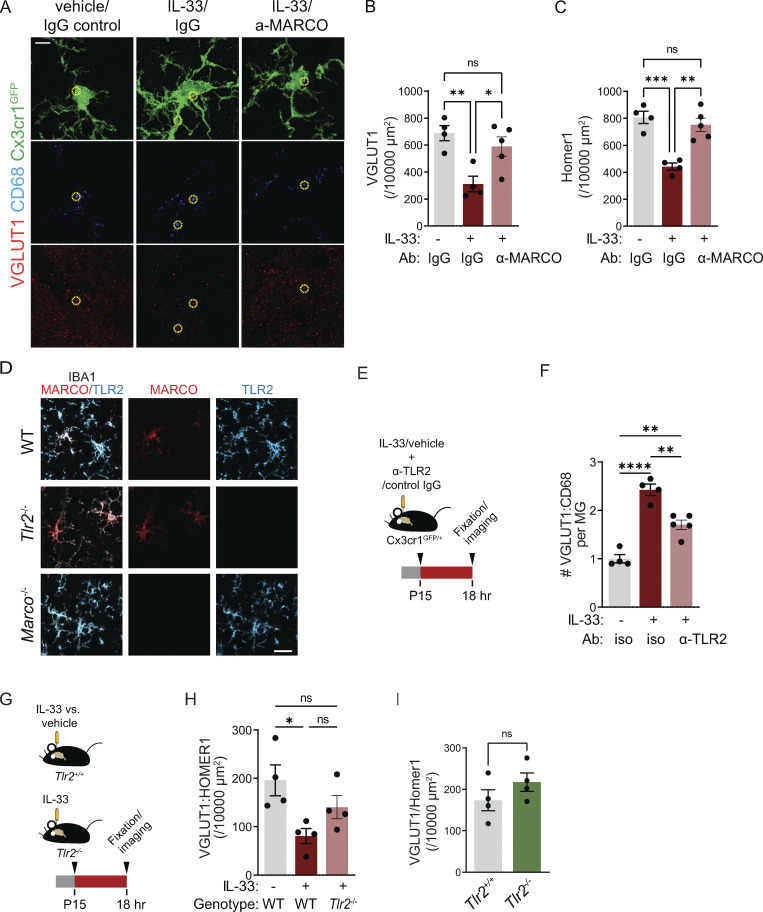
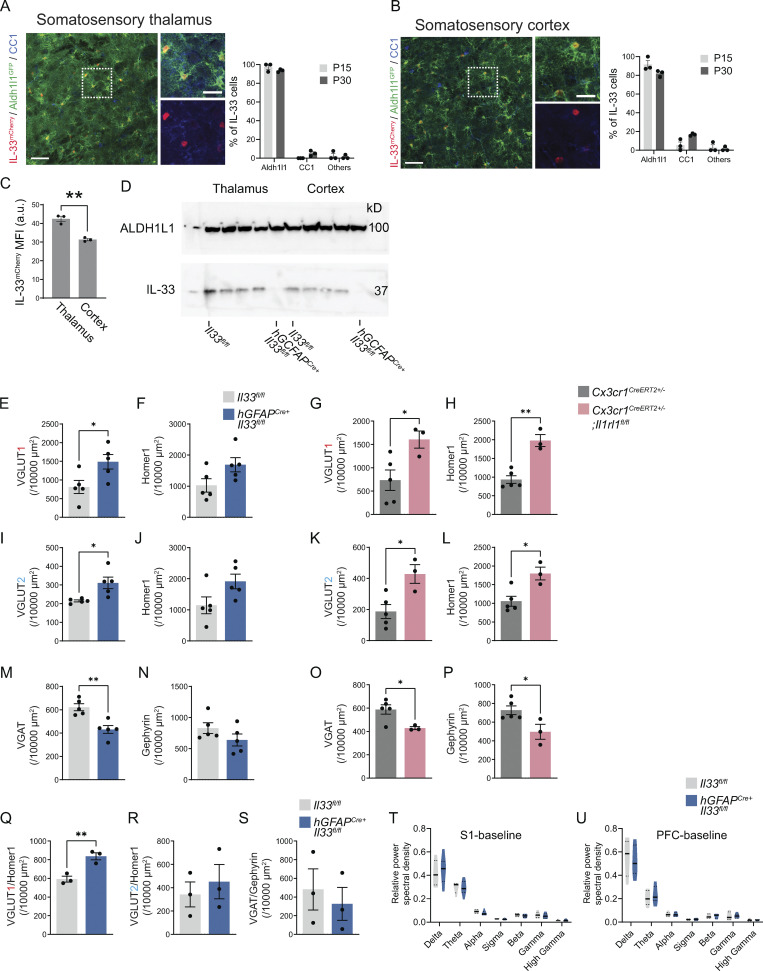
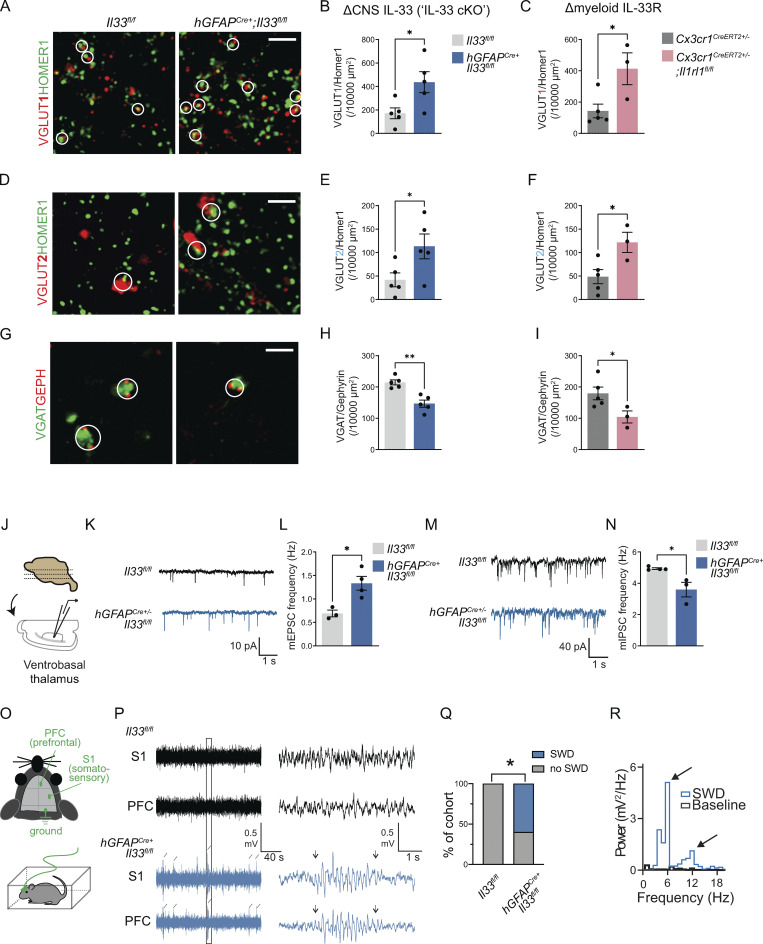
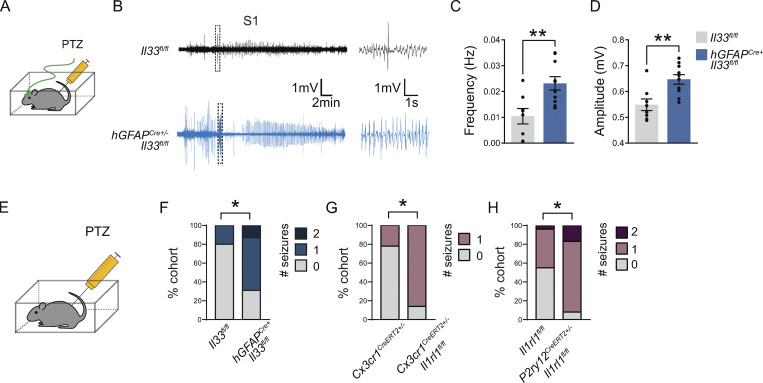
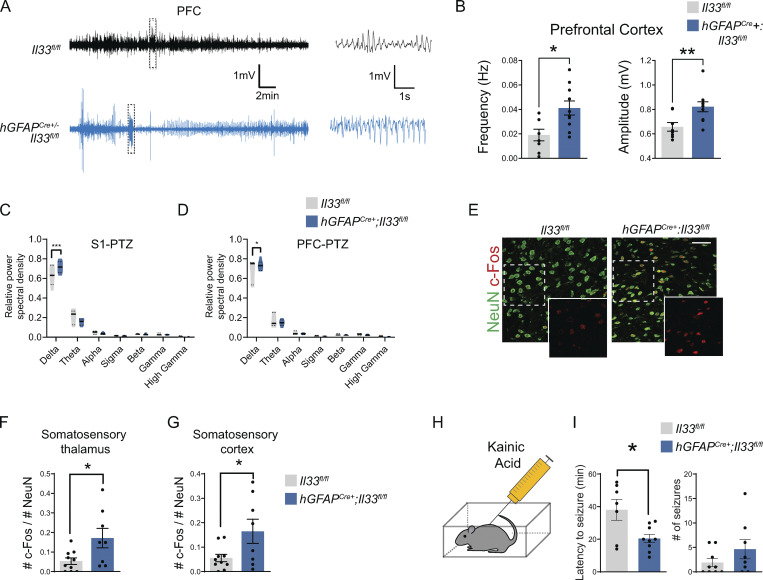
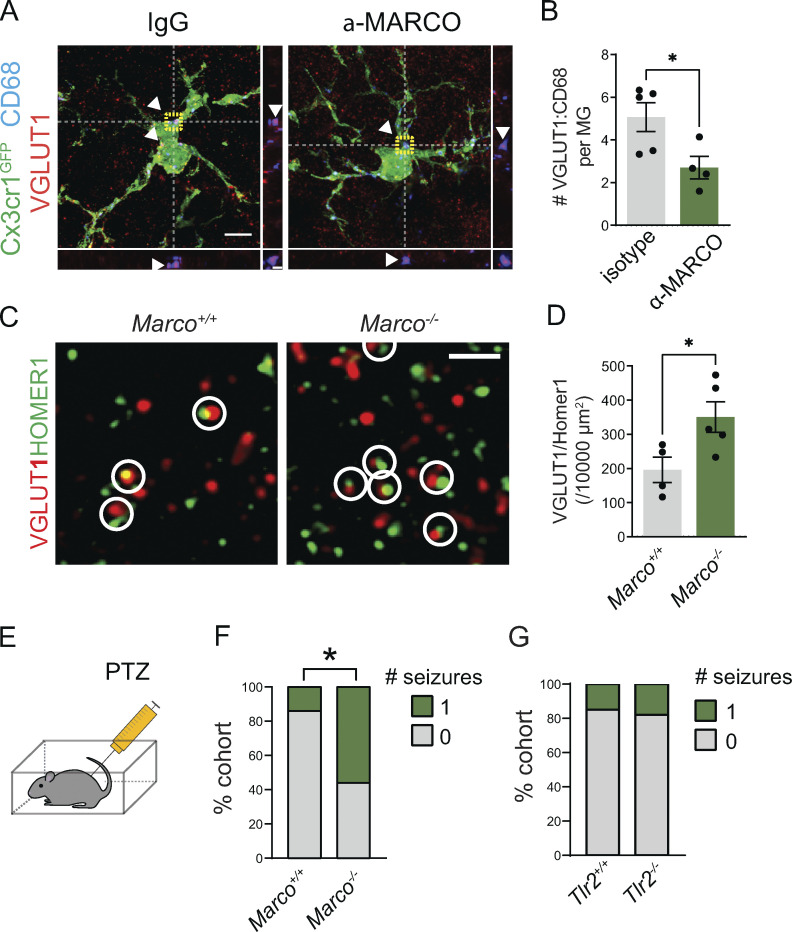
Microglia are critical regulators of brain development that engulf synaptic proteins during postnatal synapse remodeling. However, the mechanisms through which microglia sense the brain environment are not well defined. Here, we characterized the regulatory program downstream of interleukin-33 (IL-33), a cytokine that promotes microglial synapse remodeling. Exposing the developing brain to a supraphysiological dose of IL-33 altered the microglial enhancer landscape and increased binding of stimulus-dependent transcription factors including AP-1/FOS. This induced a gene expression program enriched for the expression of pattern recognition receptors, including the scavenger receptor MARCO. CNS-specific deletion of IL-33 led to increased excitatory/inhibitory synaptic balance, spontaneous absence-like epileptiform activity in juvenile mice, and increased seizure susceptibility in response to chemoconvulsants. We found that MARCO promoted synapse engulfment, and Marco-deficient animals had excess thalamic excitatory synapses and increased seizure susceptibility. Taken together, these data define coordinated epigenetic and functional changes in microglia and uncover pattern recognition receptors as potential regulators of postnatal synaptic refinement.


Conflict of interest statement

Disclosures: The authors declare no competing interests exist.

Figures

None
Graphical abstract
Figure 1.
Figure 1.
IL-33 induces a phagocytic program in microglia that upregulates extracellular sensing and scavenging pathways. (A) Schematic of developmental induction of IL-33 during corticothalamic synapse refinement (adapted from data in Vainchtein et al., 2018). (B) Circuit diagram of the corticothalamic circuit, including excitatory thalamocortical (blue), corticothalamic (green), and inhibitory connections (violet). (C) Experimental paradigm for scRNA-seq from P15 thalamus (vehicle = PBS). (D) Unsupervised clustering of single-cell sequencing data from all three conditions (upper left). Same plot showing only Cx3cr1CreERT2+/− sample 4 h after vehicle injection (upper right), Cx3cr1CreERT2+/− sample 4 h after 40 ng IL-33 injection (lower left), and Cx3cr1CreERT2+/− Il1rl1fl/fl sample 4 h after 40 ng of IL-33 injection (lower right) plotted in UMAP space. Each dot represents a cell from one independent experiment. (E) Volcano plot of differentially expressed genes between the IL-33 responsive cluster 1 vs. aggregated cells from all other clusters. Red dots are upregulated in cluster 1 with log2 fold change >0.25, pAdj < 10−10, using the MAST test in Seurat. Blue dots are upregulated in all other aggregated clusters vs. cluster 1 with log2 fold change <0.25, pAdj < 10−10. (F) Top five GO terms upregulated in cluster 1 (upper) and upregulated in all other aggregated clusters (lower). (G) Heatmap showing expression of phagocytosis-related genes (GO: 0006909) across clusters, highlighting top five upregulated genes (top, yellow) and downregulated genes (bottom, purple) in cluster1 (ordered based on expression in cluster 1, centered normalized expression values). (H) Feature plots showing Marco (upper) and Tlr2 (lower) expression with cluster 1 highlighted (dotted line). (I) Representative images of MARCO and TLR2 protein expression in thalamic microglia 18 h after vehicle or IL-33 injection in Cx3cr1CreERT2+/− or Cx3cr1CreERT2+/−:Il1rl1fl/fl mice. Scale bar = 100 µm. (J) Quantification of MARCO mean fluorescence intensity (MFI) in thalamic microglia 18 h after vehicle or IL-33 injection in Cx3cr1CreERT2+/− or Cx3cr1CreERT2+/−:Il1rl1fl/fl mice. Each dot represents a mouse. Two-way ANOVA followed by Tukey’s post hoc comparison (genotype and treatment). (K) Quantification of TLR2 MFI in thalamic microglia 18 h after vehicle or IL-33 injection in Cx3cr1CreERT2+/− or Cx3cr1CreERT2+/−:Il1rl1fl/fl mice. Each dot represents a mouse. Two-way ANOVA followed by Tukey’s post hoc comparison (genotype and treatment). Data points represent the average of three technical repeats. (L and M) Quantification of MARCO (L) and TLR2 (M) expression in thalamic microglia 18 h after vehicle or IL-33 injection in Il1rl1fl/fl or P2ry12creERT2+:Il1rl1fl/fl mice. Each dot represents a mouse. Two-way ANOVA followed by Tukey’s post hoc comparison (genotype and treatment). Data points represent the average of two technical repeats. Data represented as mean ± SEM for bar graphs. Mice aged P15–P17 were used for I–M. dLGN: dorsal lateral geniculate nucleus of thalamus. *P < 0.05, **P < 0.01, ***P < 0.001.
Figure S1.
Figure S1.
Quality control of single-cell sequencing of microglial response to IL-33. (A) Gating strategy for isolation by FACS of all CD45+ (red) for scRNA-seq in Fig. 1, or microglia only (CD11b+, CD45low, Ly-6C, violet) for bulk RNA-/ATAC-/ChIP-seq (Fig. 2). (B) Gating strategy showing microglia (CD45lowCD11b+), myeloid (CD45highCD11b+), and lymphoid cells (CD45+CD11b) after vehicle or IL-33, gated on CD11b and CD45. Representative plots from thalamus, quantifications include thalamus and cortex. Dots = mice. (C) Violin plots of scRNA-seq data showing transcripts/cell, unique genes/cell, and percentage mitochondrial content/cell for each sample. Cut-off boundaries are marked (upper: red line; bottom: black line). (D) Feature plots for the number of genes and percentage mitochondrial RNA for all samples combined from scRNA-seq data. Each dot represents a cell. (E) Feature plot showing correlation between two replicates used for WT + IL-33 scRNA-seq sample. (F) Heatmap for the top three genes in each cluster from scRNA-seq data. (G and H) Mean fluorescence intensity for MARCO protein in cortex from Cx3cr1creERT2 (G) and P2ry12-creERT2 (H) mice. Dots = individual mice. Two-way ANOVA with Tukey’s post hoc comparison (genotype and treatment). (I and J) Percentage of microglia expressing MARCO protein in thalamus from Cx3cr1creERT2 (I) and P2ry12-creERT2 (J) mice. Dots = individual mice. Two-way ANOVA with Tukey’s post hoc comparison (genotype and treatment). (K and L) Percentage of microglia expressing TLR2 protein in thalamus from Cx3cr1creERT2 (K) and P2ry12-creERT2 (L) mice. Dots = individual mice. Two-way ANOVA with Tukey’s post hoc comparison (genotype and treatment). (M and N) Representative images for P2ry12creERT2 crossed to a R26R-TdTomato (TdT) reporter (Ai14). (M) Top row shows cortex with overlying meninges. Arrowheads indicate meningeal macrophages that are CD68+IBA1+TdT. Bottom row shows L2/3 cortex. Arrowhead indicates perivascular macrophage that is CD68+IBA1+TdT. (N) Ventral posteromedial (VPM; top) and ventral posterolateral (VPL; bottom) nuclei of thalamus. Arrowhead indicates perivascular macrophage that is CD68+IBA1+TdT. Scale bar = 50 μm. (O and P) Representative flow plots of cortex (O) and thalamus (P) showing P2ry12creERT2 driven Ai14 (TdTomato) expression at P15. Two gating strategies shown: Left panel shows that of Ai14+ cells, 99.9% fell within the CD45/CD11b microglial gate. Right panels pre-gate on microglia, myeloid, and lymphoid cells based on CD11b and CD45 followed by Ly-6C and Ai14, to show the percentage of each population with detectable TdT. (Q) qRT-PCR of Il1rl1 expression in cortical and thalamic microglia comparing Cx3cr1creERT2 and P2ry12creERT2 mice. Values normalized to housekeeper (Hmbs) and then control + vehicle (PBS) condition. In Cx3cr1creERT2 the control = Cx3cr1creERT2+/− + vehicle (PBS). In P2ry12creERT2 the control = Il1rl1fl/fl + vehicle (PBS). Each dot represents a mouse. Two-way ANOVA followed by Tukey’s post hoc comparison (genotype and treatment). Data points represent the average of three technical repeats for Cx3cr1creERT and two technical repeats for P2ry12creERT. Data represented as mean ± SEM for bar graphs. *P < 0.05, **P < 0.01, ***P < 0.001, ****P < 0.0001.
Figure 2.
Figure 2.
AP-1/FOS activation drives pattern recognition receptor expression in microglia. (A) Schematic of bulk RNA-seq, ATAC-seq, and H3K27ac/FOS ChIP-seq paradigm. Cells were collected 4 h after injection for analysis from one independent experiment. Vehicle = PBS. (B) Scatter plot of normalized H3K27ac ChIP-seq in regions with ATAC-seq signal, in microglia after vehicle or IL-33 exposure. Data focuses on putative enhancers (chromatin regions >3 kb from transcriptional start site). Colors indicate significant changes (FDR < 0.05 and FC > 2) in H3K27ac ChIP-seq signal (IL-33 enriched = red, vehicle enriched = black). (C) Enriched de novo motifs in enhancers that gained or lost H3K27ac ChIP-seq signal after treatment with IL-33 or vehicle, showing best-matched TFs binding to those motifs. (D) Log2 fold-change of gene expression of all transcription factors that bind DNA elements identified in C. All transcription factors shown have adj. P value < 0.001 by RNA-seq. (E) Browser tracks of ATAC-seq and H3K27ac or FOS ChIP-seq peaks in the vicinity of Marco and Tlr2. Yellow shading = promoter regions, pink shading = distal gene regulatory elements (enhancers). (F) Bar graphs illustrate mRNA expression (transcripts per million, TPM) from bulk RNA-seq for Marco and Tlr2. Error bars = standard deviation. Each dot represents a mouse (two-tailed unpaired t test). (G) Venn diagram depicting percentage of induced active open enhancer peaks occupied by FOS after IL-33. FOS-occupied enhancers putatively regulate 867 genes including Marco and Tlr2. (H) Experimental paradigm using the Fos-Trap2 allele crossed to the Ai14 TdTomato reporter to label, or “trap” Fos + cells. Tamoxifen was administered 1 and 4 h after IL-33 or vehicle i.c.v. injection to capture Fos+ cells, and animals were sacrificed 20 h after the last tamoxifen injection. (I) Representative images of staining for Fos-TRAP (TdT+), MARCO, and TLR2 after vehicle or IL-33 injection. Scale bar = 10 µm. (J) Quantification of Fos+ microglia in the cortex after vehicle or IL-33 injection. Dots = mice. (K) Quantification of Fos+ neurons in the cortex after vehicle or IL-33 injection. Dots = mice. (L) Quantification of percent microglia that are MARCO+ after IL-33 injection. Lines (left) connect paired measurements of Fos+ and Fos microglia in the same mouse; estimation plot (right) shows the difference between the two means per mouse, error bars indicate 95% confidence interval. (M) Quantification of TLR2 mean fluorescent intensity after IL-33 injection. Lines (left) connect paired measurements of Fos+ and Fos microglia in the same mouse. The estimation plot (right) shows the difference between the two means per mouse, error bars indicate 95% confidence interval. Data represented as mean ± SEM for J and K. Data points represent the average of two technical repeats for K–M. (J and K) Two-tailed unpaired t test. (L and M) Two tailed paired t = tests. Mice at P30 were used for A–G. *P < 0.05, **P < 0.01, ****P < 0.0001.
Figure S2.
Figure S2.
Quality control for bulk transcriptomic and epigenomic profiling of microglia after IL-33 exposure. (A) Heatmap of differentially expressed genes (DEG) in cortical microglia 4 h after vehicle (PBS) or 500 ng of IL-33 treatment (Padj < 0.01). Left: Top 10 up- (red) and downregulated (blue) genes indicated. Right: Top GO categories associated with DEG (Padj < 0.01, fold-change > 2). (B) Heatmap of sample-to-sample Pearson correlation of bulk RNA-seq replicates. (C) Heatmaps of sample-to-sample correlation for ATAC-seq replicates. Values indicate Pearson correlation. (D) Heatmaps of sample-to-sample correlation for H2K27ac ChIP-seq replicates. Values indicate Pearson correlation. (E) Low magnification representative images of staining for Fos-TRAP (TdT+) after vehicle or IL-33 injection. Scale bar = 40 µm. (F) Percentage of Fos+ microglia in the cortex after vehicle or IL-33 injection. Dots = mice. Two-tailed unpaired t test. Data represented as mean ± SEM for F. *P < 0.05.
Figure 3.
Figure 3.
The scavenger receptor MARCO partly mediates microglial synapse engulfment and synapse elimination in response to exogenous IL-33. (A) Schematic of i.c.v. injection of IL-33 and MARCO-blocking antibody in Cx3cr1GFP reporter animals. (B) Representative images of Z-stack maximum projection from Cx3cr1GFP microglia in the somatosensory thalamus for the indicated conditions. Arrowheads and orthogonal projections highlight engulfed VGLUT1 within CD68+ phagolysosomes. Vehicle = PBS. Scale bars = 5 µm (main panel) and 0.5 µm (inset). (C) Quantification of VGLUT1 within CD68+ phagolysosomes within microglia 18 h after vehicle or IL-33 injection after co-injection of a MARCO-blocking antibody or isotype control (values normalized to vehicle + isotype control condition; n = 4 mice for vehicle + isotype control, n = 5 mice for IL-33 + isotype control and IL33 + MARCO blocking antibody). (D and E) Representative images and quantification of corticothalamic synapses in somatosensory thalamus 18 h after vehicle or IL-33 injection in the presence of MARCO blocking antibody or isotype control (n = 4 mice for vehicle + isotype control, n = 5 mice for IL-33 + isotype control and IL-33 + α-MARCO). Scale bar = 2 µm. (F) Schematic of i.c.v. injection of IL-33 in wild-type animals. (G and H) Representative images (G) and quantification (H) of corticothalamic excitatory synapses in somatosensory thalamus after vehicle or IL-33 injection into wild-type animals (n = 3 mice/condition). Scale bar = 2 µm. Two-tailed unpaired t test was used. Arrow indicates the magnitude of the difference between the two conditions. (I) Schematic of i.c.v. injection of IL-33 in Marco−/− animals. (J and K) Representative images (J) and quantification (K) of corticothalamic excitatory synapses in somatosensory thalamus after vehicle or IL-33 injection into Marco−/− animals (n = 4 mice for vehicle and 3 mice for IL-33). Scale bar = 2 µm. Two-tailed unpaired t test was used. Arrow indicates the magnitude of the difference between two conditions. Dots = individual mice. Data points represent the average of three technical repeats for all experiments. Mice aged P15–P17 used for all experiments. One-way ANOVA with Tukey’s comparison was used for C and E. *P < 0.05, **P < 0.01, ***P < 0.001.
Figure S3.
Figure S3.
Validation of MARCO and TLR2 deficient animals and impact of TLR2 on synapses. (A) Representative images separated into individual channels for presynaptic protein (VGLUT1), phagolysosome (CD68), and Cx3cr1GFP microglia (GFP) from a Z-stack maximum projection in the somatosensory thalamus for the indicated conditions. Vehicle = PBS. Yellow circles indicate representative colocalized VGLUT1 inside lysosomes (not all colocalized puncta are indicated.) Scale bar = 5 µm. (B and C) Same data as in Fig. 3 E, presented without colocalization, demonstrating changes in pre- (B) and post- (C) synaptic protein puncta of corticothalamic synapses in somatosensory thalamus 18 h after vehicle or IL-33 injection in the presence of MARCO blocking antibody or isotype control (n = 4 mice for vehicle + isotype control, n = 4 mice for IL-33 + isotype control, and n = 5 mice for IL-33 + α-MARCO). (D) Representative images of MARCO and TLR2 immunostaining in wild-type (top), Tlr2-deficient (middle) or Marco-deficient (bottom) animals to illustrate the specificity of antibody and lack of protein in Marco−/− and Tlr2−/− animals. Experiments were done 18 h after 40 ng of IL-33 i.c.v. injection at P17. Scale bar = 20 µm. (E) Schematic of i.c.v. injection of IL-33 and TLR2 blocking antibody in Cx3cr1GFP reporter animals. (F) Quantification of VGLUT1 within CD68+ phagolysosomes within individual microglia 18 h after vehicle or IL-33 injection in the presence of TLR2 blocking antibody or isotype control (values normalized to vehicle + isotype control condition; n = 4 mice for vehicle + isotype control and IL-33 + isotype control, and n = 5 mice for IL33 + TLR2 blocking antibody). Age P15–P16. Data points represent the average of three technical repeats. (G) Schematic of i.c.v. injection of IL-33 in Tlr2+/+ or Tlr2−/− animals. (H) Quantification of corticothalamic synapses in somatosensory thalamus 18 h after vehicle or IL-33 injection into Tlr2+/+ and Tlr2−/− mice (n = 4 mice/condition). Age P15–P16. Data points represent the average of three technical repeats. (I) Quantification of excitatory synapses in ventrobasal thalamus of Tlr2+/+ and Tlr2−/− mice. n = 4 mice/condition. Age P28–P30. Data points represent the average of two technical repeats. Dots = independent mice. Data represented as mean ± SEM for bar graphs. One-way ANOVA followed by post hoc Tukey’s comparison was used for all analysis except I. Two-tailed unpaired t test was used for I. *P < 0.05, **P < 0.01, ***P < 0.001, ****P < 0.0001.
Figure S4.
Figure S4.
Cellular sources of IL-33, efficiency of IL-33 depletion using hGFAPcre:Il33fl/fl, and further analysis of cortical synapse numbers and electrocorticography in IL-33 cKO. (A) Representative image and quantification of percent IL-33mCherry+ cells in the somatosensory thalamus of Il33mCherry;Aldh1l1GFP mice stained with CC1 (oligodendrocytes) at P15 and P30. GFP expression marks astrocytes. Scale bars = 50 µm (left) and 20 µm (inset). (B) Representative image and quantification of percent IL-33mCherry+ cells in the somatosensory cortex of Il33mCherry;Aldh1l1GFP mice stained with CC1 (oligodendrocytes) at P15 and P30. Scale bars = 50 µm (left) and 20 µm (inset). (C) Comparison of mean fluorescent intensity (MFI) of IL-33mCherry in the thalamus and the cortex at P15. (D) Western blot from cortex and thalamus of hGFAPCre+:Il33fl/fl animals and Il33fl/fl controls at P35. ALDH1L1 used as a loading control. (E and F) The same data as in Fig. 4 B, presented separately for pre- and postsynaptic excitatory synaptic proteins. Quantification of pre- (E) and post- (F) synaptic terminal of corticothalamic excitatory synapses in ventrobasal thalamus of hGFAPCre+;Il33fl/fl vs. Il33fl/fl control. n = 5 mice/genotype. Two-tailed unpaired t test. (G and H) The same data as in Fig. 4 C, presented separately for pre- and postsynaptic excitatory synaptic proteins. Quantification of pre- (G) and post- (H) synaptic terminal of corticothalamic excitatory synapses in ventrobasal thalamus of Cx3cr1CreERT2+/−;Il1rl1fl/fl) vs. Cx3cr1CreERT2+/−. Cx3cr1CreERT2+/−;Il1rl1fl/fl: n = 3 mice. Cx3cr1CreERT2+/−: n = 5 mice. Two-tailed unpaired t test. (I and J) The same data as in Fig. 4 E, presented separately for pre- and postsynaptic excitatory synaptic proteins. Quantification of pre- (I) and post- (J) synaptic terminal of brainstem afferent excitatory synapses in ventrobasal thalamus of hGFAPCre+;Il33fl/fl vs. Il33fl/fl control. n = 5 mice/genotype. Two-tailed unpaired t test. (K and L) The same data as in Fig. 4 F, presented separately for pre- and postsynaptic excitatory synaptic proteins. Quantification of pre- (K) and post- (L) synaptic terminal of brainstem afferent excitatory synapses in ventrobasal thalamus of Cx3cr1CreERT2+/−;Il1rl1fl/fl) vs. Cx3cr1CreERT2+/−. Cx3cr1CreERT2+/−;Il1rl1fl/fl: n = 3 mice. Cx3cr1CreERT2+/−: n = 5 mice. Two-tailed unpaired t test. (M and N) The same data as in Fig. 4 H, presented separately for pre- and postsynaptic excitatory synaptic proteins. Quantification of pre- (M) and post- (N) synaptic terminal of thalamic inhibitory synapses in hGFAPCre+;Il33fl/fl vs. Il33fl/fl control. n = 5 mice/genotype. Two-tailed unpaired t test. (O and P) The same data as in Fig. 4 I, presented separately for pre- and postsynaptic excitatory synaptic proteins. Quantification of pre- (O) and post- (P) synaptic terminal of thalamic inhibitory synapse in Cx3cr1CreERT2+/−;Il1rl1fl/f) vs. Cx3cr1CreERT2+/−. Cx3cr1CreERT2+/−;Il1rl1fl/fl: n = 3 mice. Cx3cr1CreERT2+/−: n = 5 mice. Two-tailed unpaired t test. (Q–S) Quantification of synapses in somatosensory cortex in Il33fl/lfl and hGFAPCre+:Il33fl/fl animals, including excitatory intracortical (Q), excitatory thalamocortical (R), and inhibitory (S) synapses. n = 3 Il33fl/lfl and n = 3 hGFAPCre+:Il33fl/fl mice in Q–S. Two-tailed unpaired t test. (T and U) Relative power of ECoG frequency bands from baseline recording in somatosensory (S1, T) and PFC (U) corties. (n = 10 hGFAPCre+: IL33fl/fl mice and 8 littermate IL33fl/fl controls; two-way ANOVA followed by Sidak’s multiple comparison). In all bar graphs, dots represent independent mice. Delta: 0.5–4 Hz; Theta: 4–8 Hz; Alpha: 8–12 Hz; Sigma: 12–15 Hz; Beta: 15–30 Hz; Gamma: 30–90 Hz; High Gamma: 90–150 Hz. Data are shown as mean ± SEM for bar graphs and as median ± interquartile range for violin plots. Mice from P28–P35 were used for E–S. *P < 0.05, **P < 0.01. Source data are available for this figure: SourceData FS4.
Figure 4.
Figure 4.
Loss of IL-33 signaling leads to excess corticothalamic excitatory synapses and spontaneous absence seizures. (A) Representative images of corticothalamic excitatory synapses within the ventrobasal thalamus as defined by colocalized presynaptic (VGLUT1) and postsynaptic (HOMER1) puncta in hGFAPCre+;Il33fl/fl vs. Il33fl/fl control. Circles indicate colocalization, defining a functional synapse. Scale bar = 2 µm. (B) Quantification of corticothalamic excitatory synapses in ventrobasal thalamus of hGFAPCre+;Il33fl/fl vs. Il33fl/fl control. n = 5 mice/genotype. (C) Quantification of corticothalamic excitatory synapses in ventrobasal thalamus with myeloid-specific deletion of IL-33 receptor (Cx3cr1CreERT2+/−;Il1rl1fl/fl) vs. control (Cx3cr1CreERT2 +/−). n = 3 mice in Cx3cr1CreERT2+/−;Il1rl1fl/fl and n = 5 mice in Cx3cr1CreERT2+/−. (D) Representative images of brainstem afferent (lemniscal) synapses as defined by colocalized pre- (VGLUT2) and post- (HOMER1) synaptic puncta in hGFAPCre+;Il33fl/fl vs. Il33fl/fl. Circles indicate colocalization, defining a functional synapse. Scale bar = 2 µm. (E) Quantification of brainstem afferent synapses in hGFAPCre+;Il33fl/fl vs. Il33fl/fl control mice. 5 mice/genotype. (F) Quantification of brainstem afferent synapses after myeloid-specific deletion of IL-33 receptor (Cx3cr1CreERT2+/−;Il1rl1fl/fl) vs. control (Cx3cr1CreERT2 +/−). Cx3cr1CreERT2+/−;Il1rl1fl/fl: n = 3 mice. Cx3cr1CreERT2+/−: n = 5 mice. (G) Representative images of inhibitory synapses in ventrobasal thalamus as defined by colocalized presynaptic (VGAT) and postsynaptic (Gephyrin) puncta in hGFAPCre+;Il33fl/fl vs. Il33fl/fl control. Circles indicate co-localization, defining a functional synapse. Scale bar = 2 µm. (H) Quantification of thalamic inhibitory synapses in hGFAPCre+;Il33fl/fl vs. Il33fl/fl control. n = 5 mice/genotype. (I) Quantification of inhibitory synapses in ventrobasal thalamus in myeloid-specific deletion of IL-33 receptor (Cx3cr1CreERT2+/−;Il1rl1fl/fl) vs. control (Cx3cr1CreERT2+/−). Cx3cr1CreERT2+/−;Il1rl1fl/fl: n = 3 mice. Cx3cr1CreERT2+/−: n = 5 mice. (J) Experimental paradigm for whole cell patch-clamp electrophysiology of ventrobasal thalamic neurons. (K) Representative traces of mEPSC. (L) Quantification of mEPSC frequency in ventrobasal thalamic neurons (Il33fl/fl control: n = 17 neurons from three mice, hGFAPCre+;Il33fl/fl: n = 18 neurons from four mice, two independent cohorts). (M) Representative traces of mIPSC. (N) Quantification of mIPSC frequency in ventrobasal thalamic neurons (n = 16 neurons from three mice in Il33fl/fl, n = 17 neurons from three mice in hGFAPCre+;Il33fl/fl, two independent cohorts). (O) Schematic of lead placement and setup for ECoG in 35–45-d-old mice. (P) Representative traces of recordings from somatosensory and prefrontal cortices of freely behaving mice. Diagonal lines indicate detected SWDs that were detected simultaneously in both cortical locations. Boxed area is enlarged to highlight a representative SWD lasting about 3 s, occurring in hGFAPCre+;Il33fl/fl. Arrowheads indicate the beginning and end of the SWD event. (Q) Quantification of percent of cohort with SWDs. n = 10 hGFAPCre+;Il33fl/fl mice and 8 = Il33fl/fl mice from three independent experiments (Fisher’s exact test). (R) Representative fast Fourier transform of an SWD observed in hGFAPCre+;Il33fl/fl mice. Note the peak at 4–6 Hz and a harmonic at 8–12 Hz. In all experiments, dots represent independent mice. Data points represent the average of two technical repeats for B, E, and H. Data points represent the average of three technical repeats for C, F, and I. Data in B–N are represented as mean ± SEM for bar graphs. Two-tailed unpaired t test used for A–N. P28–P35 mice were used for A–N. *P < 0.05, **P < 0.01.
Figure 5.
Figure 5.
Increased seizure susceptibility after the loss of CNS IL-33 or microglial IL-33 receptor. (A) Schematic of ECoG recordings after injection of the GABA-A receptor antagonist PTZ. (B) Representative ECoG traces from the somatosensory cortex of PTZ-injected mice. Boxed area is enlarged to highlight epileptiform spikes (right). (C and D) Quantification of total spike frequency (C) and average amplitude (D) of detected ECoG spikes. n = 10 hGFAPCre+;Il33fl/fl mice and 8 Il33fl/fl mice from three independent experiments (35–45-d-old, two-tailed unpaired t test, mean ± SEM). (E) Schematic for seizure quantification after PTZ injection in non-implanted mice. (F) Percent of mice that experienced generalized tonic-clonic seizures during the 1-h recording. n = 16 hGFAPCre+;Il33fl/fl mice and 15 Il33fl/fl, four independent experiments. Age P29–P35. Fisher’s exact test. (G) Percent of mice that experienced generalized tonic-clonic seizures during the 1 h recording. n = 7 Cx3cr1CreERT2+/−;Il1rl1fl/fl mice and n = 9 Cx3cr1CreERT2+/− mice, three independent experiments. Age P29–P35. Fisher’s exact test. (H) Percent of mice that experienced generalized tonic-clonic seizures during the 1 h recording from n = 12 P2ry12CreERT2+/−;Il1rl1fl/fl mice and n = 22 Il1rl1fl/fl mice, five independent experiments. Age P29–P35. Fisher’s exact test. Dots represent individual mice. Data represented as mean ± SEM for bar graphs. ECoG, electrocorticography; S1, somatosensory cortex. *P < 0.05, **P < 0.01.
Figure S5.
Figure S5.
Additional characterization of seizure phenotypes after conditional deletion of IL-33. (A and B) Representative traces and quantification of total spike frequency (left) and average amplitude (right) of detected spike events from prefrontal cortex during 1-h recording session. n = 10 hGFAPCre+;Il33fl/fl mice and n = 8 Il33fl/fl mice (two-tailed unpaired t test). Each dot represents a mouse. Mice were P35–P45. (C and D) Relative power of ECoG frequency bands from somatosensory (C) and prefrontal (D) cortices after PTZ administration (n = 10 IL-33 hGFAPCre+: IL33fl/fl mice and 8 littermate IL33fl/fl controls; two-way ANOVA followed by Sidak’s multiple comparison). (E–G) Representative images (E) in thalamus and quantification (F) of c-Fos expression in the thalamus and cortex (G) following PTZ administration (two-tailed unpaired t test). Scale bar = 50 µm. Dots = mice. (H) Schematic of kainic acid administration. (I) Quantification of latency to first seizure onset (left) and incidence of seizures (right) for 3 h following kainic acid administration from four independent experiments (two-tailed unpaired t test). All dots represent independent mice. Data represented as mean ± SEM for bar graphs and as median ± interquartile range for violin plots. Delta: 0.5–4 Hz; Theta: 4–8 Hz; Alpha: 8–12 Hz; Sigma: 12–15 Hz; Beta: 15–30 Hz; Gamma: 30–90 Hz; High Gamma: 90–150 Hz. *P < 0.05, **P < 0.01.
Figure 6.
Figure 6.
MARCO deficiency leads to impaired synaptic protein engulfment, excess excitatory synapses, and increased seizure susceptibility. (A and B) Representative image (A) and quantification (B) of VGLUT1 within CD68+ phagolysosomes within microglia 18 h after a MARCO-blocking antibody or isotype control at age P15–P16 (n = 5 mice for isotype control, n = 4 mice for MARCO-blocking antibody). Two-tailed unpaired t test. Scale bars = 5 µm (main panel) and 1 µm (inset). (C and D) Representative image (C) and quantification (D) of excitatory synapses in ventrobasal thalamus of Marco+/+ and Marco−/− mice. Marco+/+: n = 4 mice. Marco−/−: n = 5 mice. Scale bar = 1 μm. Age P28–P30. Two-tailed unpaired t test. (E) Schematic for seizure quantification after PTZ injection. (F) Percent of mice that experienced generalized tonic-clonic seizures in 1 h after PTZ injection from n = 21 wild-type and 16 Marco−/− mice from four independent experiments. Age P29–P35. Fisher’s exact test. (G) Percent of mice that experienced generalized tonic-clonic seizures in 1 h after PTZ injection from. n = 13 wild-type and 11 Tlr2−/− animals from two independent experiments. Age P28–P30. Fisher’s exact test. In all bar graphs, dots represent independent mice. Data represented as mean ± SEM for bar graphs. *P < 0.05.

References

    1. Anders, S., Pyl P.T., and Huber W.. 2015. HTSeq--a python framework to work with high-throughput sequencing data. Bioinformatics. 31:166–169. 10.1093/bioinformatics/btu638 - DOI - PMC - PubMed
    1. Antoine, M.W., Langberg T., Schnepel P., and Feldman D.E.. 2019. Increased excitation-inhibition ratio stabilizes synapse and circuit excitability in four autism mouse models. Neuron. 101:648–661.e4. 10.1016/j.neuron.2018.12.026 - DOI - PMC - PubMed
    1. Ayata, P., Badimon A., Strasburger H.J., Duff M.K., Montgomery S.E., Loh Y.E., Ebert A., Pimenova A.A., Ramirez B.R., Chan A.T., et al. . 2018. Epigenetic regulation of brain region-specific microglia clearance activity. Nat. Neurosci. 21:1049–1060. 10.1038/s41593-018-0192-3 - DOI - PMC - PubMed
    1. Bennett, F.C., and Molofsky A.V.. 2019. The immune system and psychiatric disease: A basic science perspective. Clin. Exp. Immunol. 197:294–307. 10.1111/cei.13334 - DOI - PMC - PubMed
    1. Bowdish, D.M.E., and Gordon S.. 2009. Conserved domains of the class A scavenger receptors: Evolution and function. Immunol. Rev. 227:19–31. 10.1111/j.1600-065X.2008.00728.x - DOI - PubMed

Publication types