Wildfires and the Changing Landscape of Air Pollution-related Health Burden in California
- PMID: 36520960
- PMCID: PMC11972552
- DOI: 10.1164/rccm.202207-1324OC
Wildfires and the Changing Landscape of Air Pollution-related Health Burden in California
Abstract
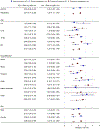
Rationale: Wildfires are a growing source of pollution including particulate matter ⩽2.5 μm in aerodynamic diameter (PM2.5), but associated trends in health burden are not well characterized. Objectives: We investigated trends and disparities in PM2.5-related cardiorespiratory health burden (asthma, chronic obstructive pulmonary disease, and all-cause respiratory and cardiovascular emergency department [ED] visits and hospital admissions) for all days and wildfire smoke-affected days across California from 2008 to 2016. Methods: Using residential Zone Improvement Plan code and daily PM2.5 exposures, we estimated overall and subgroup-specific (age, gender, race and ethnicity) associations with cardiorespiratory outcomes. Health burden trends and disparities were evaluated on the basis of relative risk, attributable number, and attributable fraction by demographic and geographic factors and over time. Measurements and Main Results: PM2.5-attributed burden steadily decreased, whereas the fraction attributed to wildfire smoke varied by fire season intensity, constituting up to 15% of the annual PM2.5-burden. The highest relative risk and PM2.5-attributed burden (92 per 100,000 people) was observed for respiratory ED visits, accounting for 2.2% of the respiratory annual burden. Disparities in overall morbidity in the oldest age, Black, and "other" race groups were also reflected in PM2.5-attributed burden, whereas Asian populations had the highest risk rate in respiratory outcomes and thus the largest fraction of the total burden attributed to the exposure. In contrast, high wildfire PM2.5-attributed burden rates in rural, central, and northern California populations occurred because of differential exposure. Conclusions: In California, wildfires' impact on air quality offset the public health gains achieved through reductions in nonsmoke PM2.5. Disproportionate effects could be attributed to differences in subpopulation susceptibility, relative risk, and differential exposure.
Keywords: burden of disease; respiratory outcomes; wildfire smoke exposure.
Figures


Comment in
-
Cardiopulmonary Health Burden of Wildfire Particulate Exposure Urges Us to Consider Interventions.Am J Respir Crit Care Med. 2023 Apr 1;207(7):807-809. doi: 10.1164/rccm.202212-2340ED. Am J Respir Crit Care Med. 2023. PMID: 36638559 Free PMC article. No abstract available.
References
-
- Chen B, Jin Y, Scaduto E, Moritz MA, Goulden ML, Randerson JT. Climate, Fuel, and Land Use Shaped the Spatial Pattern of Wildfire in California’s Sierra Nevada. Journal of Geophysical Research: Biogeosciences. 2021;126(2):e2020JG005786. doi:10.1029/2020JG005786 - DOI
-
- Bay Area Council Economic Institute. The True Cost of Wildfires: Analyzing the Impact of Wildfires on the California Economy. Published online November 2021. http://www.bayareaeconomy.org/files/pdf/BACEI_WildfireImpacts_Nov2021.pdf
-
- U.S. EPA (U.S. Environmental Protection Agency). National Emissions Inventory (NEI). Published online 2021. Accessed February 10, 2021. https://www.epa.gov/air-emissions-inventories/national-emissions-invento...
-
- U.S. EPA (U.S. Environmental Protection Agency). U.S. EPA. Integrated Science Assessment (ISA) for Particulate Matter. Published online December 2019. https://cfpub.epa.gov/ncea/isa/recordisplay.cfm?deid=347534
Publication types
MeSH terms
Substances
Grants and funding
LinkOut - more resources
Full Text Sources
Medical

