. 2023 Jun 27;7(12):2855-2871.
doi: 10.1182/bloodadvances.2022008762.

IL-3-zetakine combined with a CD33 costimulatory receptor as a dual CAR approach for safer and selective targeting of AML

Affiliations

IL-3-zetakine combined with a CD33 costimulatory receptor as a dual CAR approach for safer and selective targeting of AML

Vincenzo Maria Perriello et al. Blood Adv. .

Abstract

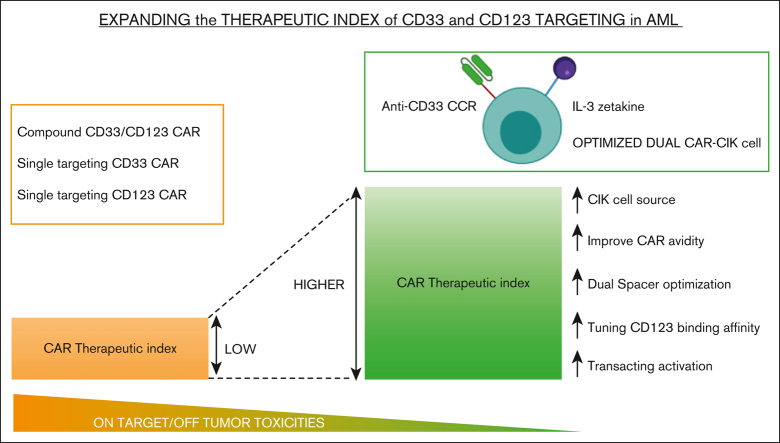
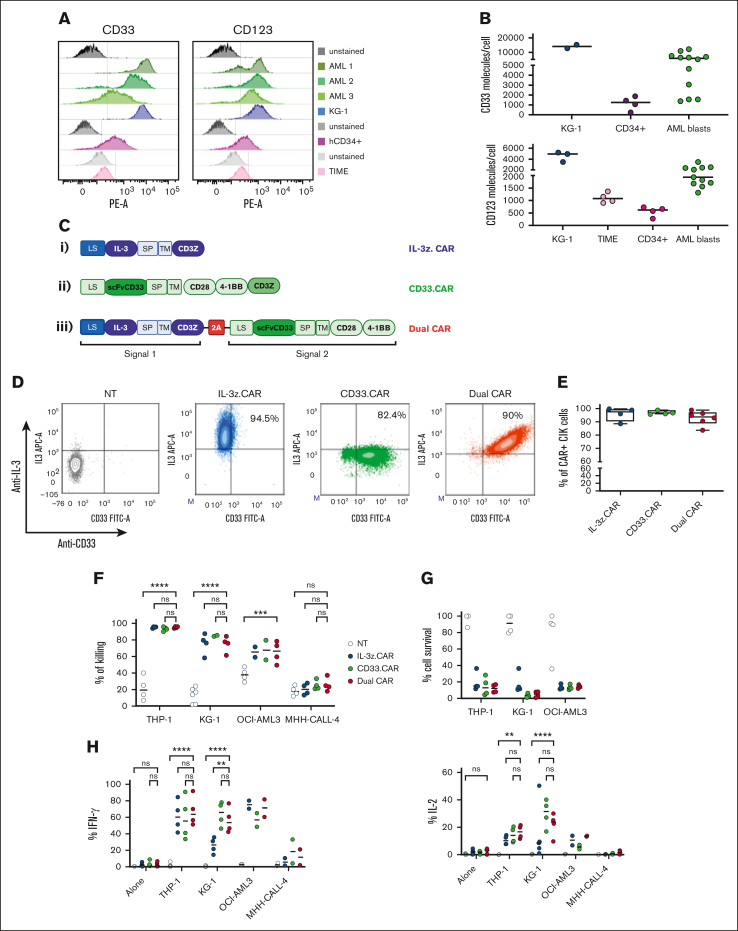
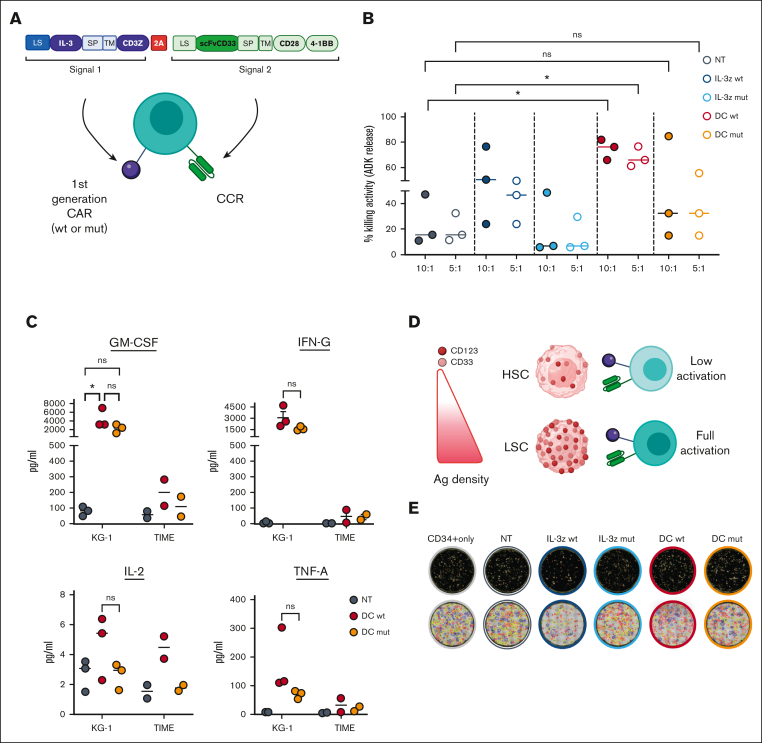
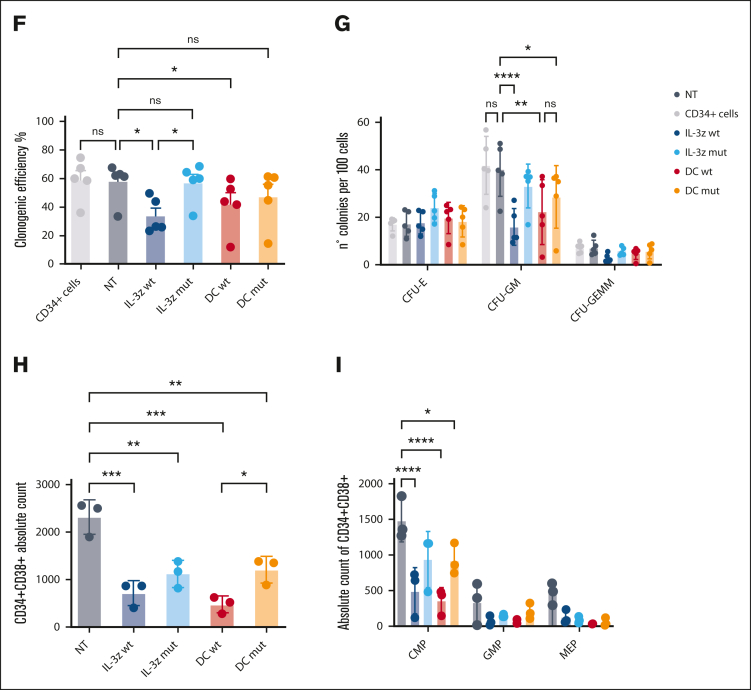
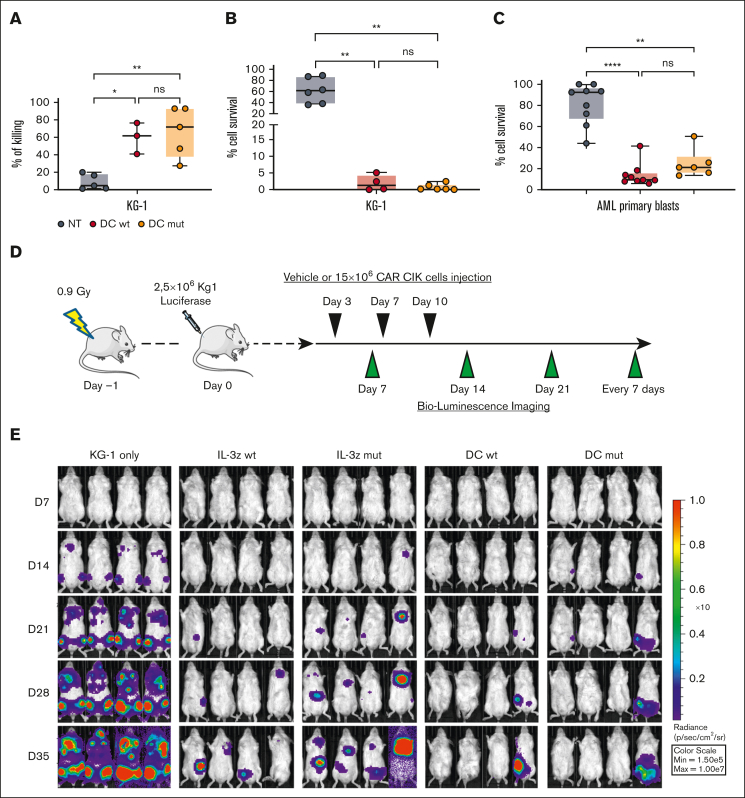
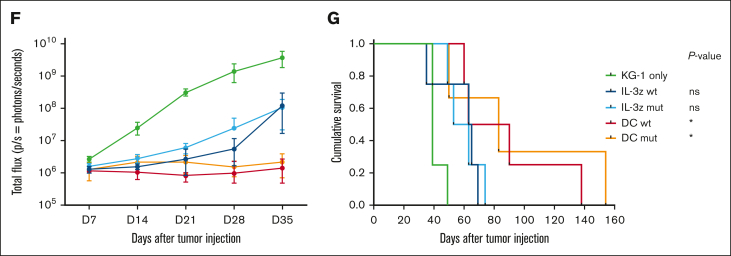
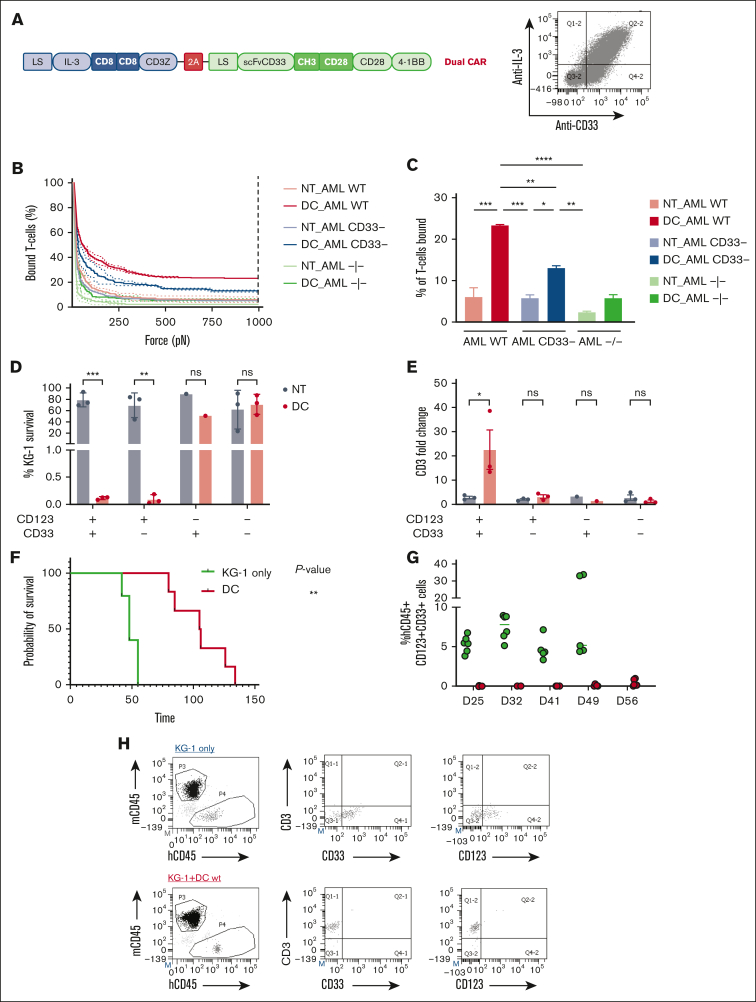
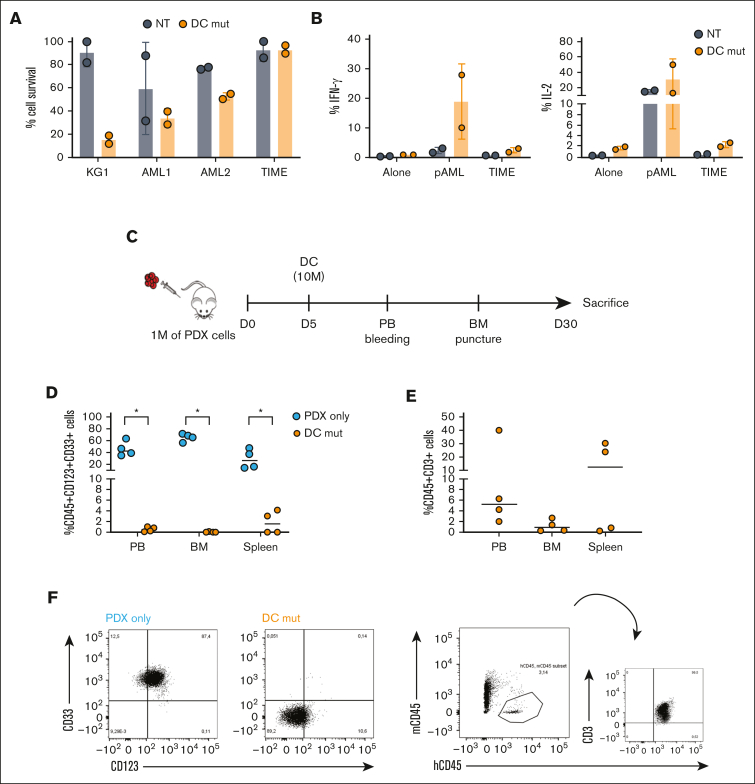
Acute myeloid leukemia (AML) still represents an unmet clinical need for adult and pediatric patients. Adoptive cell therapy by chimeric antigen receptor (CAR)-engineered T cells demonstrated a high therapeutic potential, but further development is required to ensure a safe and durable disease remission in AML, especially in elderly patients. To date, translation of CAR T-cell therapy in AML is limited by the absence of an ideal tumor-specific antigen. CD123 and CD33 are the 2 most widely overexpressed leukemic stem cell biomarkers but their shared expression with endothelial and hematopoietic stem and progenitor cells increases the risk of undesired vascular and hematologic toxicities. To counteract this issue, we established a balanced dual-CAR strategy aimed at reducing off-target toxicities while retaining full functionality against AML. Cytokine-induced killer (CIK) cells, coexpressing a first-generation low affinity anti-CD123 interleukin-3-zetakine (IL-3z) and an anti-CD33 as costimulatory receptor without activation signaling domains (CD33.CCR), demonstrated a powerful antitumor efficacy against AML targets without any relevant toxicity on hematopoietic stem and progenitor cells and endothelial cells. The proposed optimized dual-CAR cytokine-induced killer cell strategy could offer the opportunity to unleash the potential of specifically targeting CD123+/CD33+ leukemic cells while minimizing toxicity against healthy cells.


Conflict of interest statement

Conflict-of-interest disclosure: Fondazione Tettamanti submitted a PCT application on 6 November 2015 (PCT/EP2015/075980), “Improved method for the generation of genetically modified cells,” Biondi, A., Biagi, E., Magnani, C.F., Tettamanti, S. The technology was licensed to CoImmune, Inc. for further development. M.P.M. reports honoraria from Rasna Therapeutics, Inc. for scientific advisor activities and serves as consultant for scientific advisory boards of AbbVie, Amgen, Celgene, Janssen, Novartis, Pfizer, and Jazz Pharmaceuticals. B.F. licensed a patent on NPM1 mutants (#102004901256449) and declares honoraria from Rasna Therapeutics, Inc. for scientific advisor activities. The remaining authors declare no competing financial interests.

Figures

None
Graphical abstract
Figure 1.
Figure 1.
CD33 and/or CD123 KO affects proliferation in NPM1 mutant OCI-AML3 cell line. (A) Representative histograms of CD33 and CD123 expression in WT and KO OCI-AML3 Luc/GFP+ clones, measured by flow cytometry after single-cell cloning. (B) Cell growth expansion curves of CD33 and/or CD123 KO Luc/GFP+ clones compared with the parental WT Luc/GFP+ OCI-AML3 cell line, monitoring luminescence emitted 2 hours after luciferine exposure for 3 days using a Spark plate reader (Tecan). Mean ± SD from biological triplicates is shown. (C) Luc/GFP+ OCI-AML3 KO cells were cocultured with GFP- OCI-AML3 WT cells at a 1:1 E:T ratio, and GFP expression was measured to assess clonal competition at the indicated time points by flow cytometry. Mean ± SD from representative biological triplicates is shown. P values from the Wilcoxon test are indicative of each KO clone condition compared with WT OCI-AML3 control at day 9. ∗∗∗∗P value <.0001. (D) Tumor burden of Luc/GFP+ OCI-AML3 WT and KO clones, measured by bioluminescent imaging at day 21 after NSG mice injection. (E) Kaplan-Meier curves of overall survival after Luc/GFP+ OCI-AML3 cell injection. P values adjusted for multiple comparisons are from the log-rank test and indicate comparisons between each KO clone condition and WT OCI-AML3 control. ∗P value <.05; ns, not significant (P value >.05). P values are indicative of each KO clone condition compared with WT OCI-AML3 control. (F) Gene expression variation of cyclin, HLA, and HOX family–related DEGs in OCI-AML3-CD33 KO, CD123 KO, and CD33-123 KO compared with WT. Upregulated and downregulated DEGs (log2 fold change) are colored in red and blue, respectively. DEGs, differentially expressed genes; GFP, green fluorescent protein; SD, standard deviation.
Figure 2.
Figure 2.
DC CIK cells express both CAR and CCR efficiently and show potent and specific in vitro antileukemic activity against CD123+CD33+ targets. (A) Flow cytometric analysis of CD33 and CD123 expression on AML primary cells, KG-1 cell line, and on normal hCD34+ cells and endothelial TIME cell line. (B) CD33 and CD123 quantification on cell surface. The number of CD33 (n = 2 for KG-1, n = 4 for CD34+, n = 12 for AML blasts) and CD123 (n = 3 for KG-1, n = 5 for TIME, n = 4 for CD34+, n = 12 for AML blasts) molecules on the cell surface was quantified using a BD QuantiBRITE PE fluorescence quantitation kit. (C) DC IL-3z/CD33 vector scheme. Single CARs are included as controls. (i) single IL-3z CAR, (ii) single CD33 CAR with CD28-4-1BB in cis costimulation, and (iii) bicistronic DC IL-3z/CD33 CCR with a self-cleaving 2A peptide. (D) Representative dot plot of IL-3z CAR, CD33 CAR, and DC expression on CIK cells at the end of differentiation. Unmanipulated (NT) CIK cells were used as control. (E) Expression of IL-3 and scFv CD33 on the surface of IL-3z CAR (n = 4), CD33 CAR (n = 4), and DC CIK cells (n = 6) by flow cytometry at the end of differentiation. (F) Short-term (E:T ratio of 5:1; n = 4 in all groups) and (G) long-term (E:T ratio of 1:100; n = 4 in all groups) cytotoxicity and (H) cytokine release against CD123+/CD33+ KG-1, OCI-AML3, and THP-1 AML cell lines (n = 4 in all groups except for OCI-AML3 and MHH-CALL-4, n = 2). CD123/CD33 CHH-CALL4 B-ALL cell line has been included as control. Summary from 4 independent CAR CIK cell donors is shown in panels F, G, and H. Paired comparisons were performed using the Tukey test and adjusted for multiple comparisons. ns, not significant (P value >.05); ∗∗P value <.01, ∗∗∗P value <.001, ∗∗∗∗P value <.0001. B-ALL, B-cell acute lymphoblastic leukemia; LS, leader sequence; SP, spacer; TM, transmembrane domain.
Figure 3.
Figure 3.
MD for the prediction of IL-3 mutants with low binding affinity to CD123. (A-B), WT and Mut4 interface interaction between IL-3 and IL-3Ra. HB is represented in yellow; salt bridge is represented in magenta; distance in Å for each interaction are also reported in magenta color. (C) ΔGbinding energies vs simulation time in WT and Mut4 systems. (D) Scatter plot of ΔGbinding energies of all analyzed frames in WT and Mut4 systems. (E) Time-course analysis of apoptosis measured by caspase-3 activation on target TIME cells cocultured for 8 hours with NT, IL-3z WT CAR-, and IL-3z mutant CAR–engineered CIK cells (E:T ratio of 5:1) using Operetta CLS. Custom-made MatLab-based software provided the image analyses for extraction of the populated area of the different dyes; n = 3 wells. (F) Live-cell imaging of the dynamic processes over time and space. First row represents the frame took at time 0, whereas the second row reports the frame taken after 8 hours.
Figure 4.
Figure 4.
Low affinity IL-3z CAR displays lower cytotoxicity toward CD123+ endothelial cells and HSPCs. (A) Vector scheme of the DC construct. (B) Short-term cytotoxicity measured by adenylate kinase release (ToxiLightTM BioAssay Kit) by TIME cells after 4-hour coculture of NT CIK cells, IL-3z WT CAR CIK cells, IL-3z mutant CAR CIK cells, DC WT CIK cells, and DC mutant CIK cells (E:T ratio of 5:1 and 10:1). Median from 3 independent experiments (mean of triplicates) is shown for each condition. (C) Th1/Tc1 cytokine release after long-term cytotoxicity assays of KG-1 and TIME cells cocultured with NT, DC WT– and DC mutant–engineered CIK cells. Median from 3 independent experiments is shown for each condition. (D) Schematic diagram of the trans-acting activation whereby DC CIK cells can be fully activated only by CD123/CD33 overexpressing LSCs but not by CD123/CD33 low expressing HSPCs. (E) Representative pictures of STEMvision-scanned cultures showing duplicates of CFUs, generated from CD34+ cells previously cocultured with NT or CAR CIK cells. Red circles label erythroid (BFU-E), yellow circles label myeloid (CFU-GM), and blue labels mixed (CFU-GEMM) colonies. (F-G) Clonogenic efficiency of 500 resiDual CD34+ HSPCs after 24 hours coincubation with NT and CAR CIK cells (E:T 1:1). BFU-E, CFU-GM, and CFU-GEMM from NT and CAR CIK cell–treated conditions were quantified after 14 days and compared with CD34+ cells (n = 5 CAR CIK cell donors). (H-I), Absolute quantification by flow cytometry of CD34+/CD38+ residual cells after exposure to NT or CAR CIK cells (24 hours, E:T 1:1), separated by CMPs, GMPs, and MEPs. Gating strategy is detailed in supplemental Figure 5 (n = 3 CAR CIK cell donors). Paired comparisons were performed using the Tukey test and adjusted for multiple comparisons in panels B-C,F-I. ns, not significant (P value >.05); ∗P value <.05, ∗∗P value <.01, ∗∗∗P value <.001, ∗∗∗∗P value <.0001. CMP, common myeloid progenitors; GEMM, granulocyte, erythrocyte, monocyte, megakaryocyte; GMP, granulocyte–monocyte progenitors; LSCs, leukemic stem cells; MEP, megakaryocyte-erythroid progenitor.
Figure 4.
Figure 4.
Low affinity IL-3z CAR displays lower cytotoxicity toward CD123+ endothelial cells and HSPCs. (A) Vector scheme of the DC construct. (B) Short-term cytotoxicity measured by adenylate kinase release (ToxiLightTM BioAssay Kit) by TIME cells after 4-hour coculture of NT CIK cells, IL-3z WT CAR CIK cells, IL-3z mutant CAR CIK cells, DC WT CIK cells, and DC mutant CIK cells (E:T ratio of 5:1 and 10:1). Median from 3 independent experiments (mean of triplicates) is shown for each condition. (C) Th1/Tc1 cytokine release after long-term cytotoxicity assays of KG-1 and TIME cells cocultured with NT, DC WT– and DC mutant–engineered CIK cells. Median from 3 independent experiments is shown for each condition. (D) Schematic diagram of the trans-acting activation whereby DC CIK cells can be fully activated only by CD123/CD33 overexpressing LSCs but not by CD123/CD33 low expressing HSPCs. (E) Representative pictures of STEMvision-scanned cultures showing duplicates of CFUs, generated from CD34+ cells previously cocultured with NT or CAR CIK cells. Red circles label erythroid (BFU-E), yellow circles label myeloid (CFU-GM), and blue labels mixed (CFU-GEMM) colonies. (F-G) Clonogenic efficiency of 500 resiDual CD34+ HSPCs after 24 hours coincubation with NT and CAR CIK cells (E:T 1:1). BFU-E, CFU-GM, and CFU-GEMM from NT and CAR CIK cell–treated conditions were quantified after 14 days and compared with CD34+ cells (n = 5 CAR CIK cell donors). (H-I), Absolute quantification by flow cytometry of CD34+/CD38+ residual cells after exposure to NT or CAR CIK cells (24 hours, E:T 1:1), separated by CMPs, GMPs, and MEPs. Gating strategy is detailed in supplemental Figure 5 (n = 3 CAR CIK cell donors). Paired comparisons were performed using the Tukey test and adjusted for multiple comparisons in panels B-C,F-I. ns, not significant (P value >.05); ∗P value <.05, ∗∗P value <.01, ∗∗∗P value <.001, ∗∗∗∗P value <.0001. CMP, common myeloid progenitors; GEMM, granulocyte, erythrocyte, monocyte, megakaryocyte; GMP, granulocyte–monocyte progenitors; LSCs, leukemic stem cells; MEP, megakaryocyte-erythroid progenitor.
Figure 5.
Figure 5.
Low affinity DC CIK cells retain high antileukemic efficacy. (A) Short-term (E:T ratio of 5:1, n = 5 for NT and DC mutant, n = 3 for DC WT) and (B) long-term (E:T ratio of 1:10, n = 6 for NT and DC mutant, n = 4 for DC WT) cytotoxicity against CD123+/CD33+ KG-1 cell line. Box and whiskers plot from independent CAR CIK cell donors is shown. (C) Long-term (E:T ratio of 1:10) cytotoxicity against primary AML cells (n = 4 different primary AMLs). Box and whiskers plot from independent CAR CIK cell donors is shown. (D) Schematic of the Luc KG-1 xenograft model. NSG mice were sublethally irradiated (0.9 Gy) on day −1 and injected via tail vein on day 0 with 2.5 × 105 KG-1 cells stably expressing GFP/luciferase. Mice were randomized to 5 treatment groups, each receiving 3 injections of vehicle or gene-modified CIK cells at day 3, 7, and 10 (n = 4 per group). (E) Bioluminescent imaging weekly measurements to quantify AML burden. (F) Longitudinal profile of the mean tumor burden imaged within the first 35 days showing suppression of leukemic growth in mice treated with DC CIK cells. (G) Kaplan-Meier curves of overall survival. P values adjusted for multiple comparisons are from the log-rank test and indicate comparisons between the KG-1 only cohort and the CAR CIK-treated cohorts. ∗P value <.05; ns, not significant (P value >.05). Paired comparisons were performed using the Tukey test and adjusted for multiple comparisons in panels A-C. ns, not significant (P value >.05); ∗P value <.05, ∗∗P value <.01, ∗∗∗∗P value <.0001.
Figure 5.
Figure 5.
Low affinity DC CIK cells retain high antileukemic efficacy. (A) Short-term (E:T ratio of 5:1, n = 5 for NT and DC mutant, n = 3 for DC WT) and (B) long-term (E:T ratio of 1:10, n = 6 for NT and DC mutant, n = 4 for DC WT) cytotoxicity against CD123+/CD33+ KG-1 cell line. Box and whiskers plot from independent CAR CIK cell donors is shown. (C) Long-term (E:T ratio of 1:10) cytotoxicity against primary AML cells (n = 4 different primary AMLs). Box and whiskers plot from independent CAR CIK cell donors is shown. (D) Schematic of the Luc KG-1 xenograft model. NSG mice were sublethally irradiated (0.9 Gy) on day −1 and injected via tail vein on day 0 with 2.5 × 105 KG-1 cells stably expressing GFP/luciferase. Mice were randomized to 5 treatment groups, each receiving 3 injections of vehicle or gene-modified CIK cells at day 3, 7, and 10 (n = 4 per group). (E) Bioluminescent imaging weekly measurements to quantify AML burden. (F) Longitudinal profile of the mean tumor burden imaged within the first 35 days showing suppression of leukemic growth in mice treated with DC CIK cells. (G) Kaplan-Meier curves of overall survival. P values adjusted for multiple comparisons are from the log-rank test and indicate comparisons between the KG-1 only cohort and the CAR CIK-treated cohorts. ∗P value <.05; ns, not significant (P value >.05). Paired comparisons were performed using the Tukey test and adjusted for multiple comparisons in panels A-C. ns, not significant (P value >.05); ∗P value <.05, ∗∗P value <.01, ∗∗∗∗P value <.0001.
Figure 6.
Figure 6.
Spacer and transmembrane optimization endow DC CIK cells of higher selectivity toward double-positive CD33/CD123 cells. (A) DC vector scheme. Bicistronic DC IL-3z/CD33 CCR carrying different spacers and transmembrane domains. (B-C), Immune synapse-binding avidity of NT and DC WT CIK cells to OCI-AML3 WT, OCI-AML3 CD33, and OCI-AML3 CD123/CD33 targets assessed via acoustic force microfluidic microscopy. Data represent mean ± SD and combined experiments from 2 separate donors. (D-E), Long-term (E:T ratio of 1:10) cytotoxicity against KG-1 cell line. Percentage of residual KG-1 cells after the 1-week coculture (D) and CD3 fold change after the 1-week coculture (E). Mean ± SEM from independent CIK cell donors is shown (n = 3 for all the conditions except for n = 1 against CD123/CD33+ KG-1 cells). (F) Kaplan-Meier curves of overall survival. P value indicates comparison between the KG-1 only cohort and the DC CIK-treated cohorts. ns, not significant (P value >.05), ∗P value <.05. (G) Representative dot plot of PB analysis. (H) Analysis of hCD45+/CD33+/CD123+ cells in the PB of untreated and treated mice. (I) Analysis of hCD45+/CD3+ cells in the PB of DC CIK cell–treated mice. Paired comparisons were performed using the Tukey test and adjusted for multiple comparisons in panels D-E. ns, not significant (P value >.05); ∗P value <.05, ∗∗P value <.01, ∗∗∗P value <.001. SEM, standard error of the mean.
Figure 7.
Figure 7.
Optimized low affinity Dual CAR CIK cells control AML growth while reducing off-targeted toxicities. (A) Long-term (E:T ratio of 1:10, n = 2 for NT and DC mut) cytotoxicity against CD123+/CD33+ KG-1 cell line, primary AML cells and TIME cell line. Scatted plot (mean ± SD) from two independent CAR-CIK donors is shown. (B) Cytokine release against CD123+/CD33+ primary AML cells and TIME cell line (n = 2 for NT and DC mut). (C) Schematic of the AML patient xenograft mouse model. NSG mice were injected via tail vein on day 0 with 1 × 10⁶ tertiary PDX AML cells. Mice were randomized to 2 treatment groups each receiving one injection of vehicle or gene-modified DC mut CIK cells at day 5 (n = 4 per group). (D) Analysis of hCD45+/CD33+/CD123+ cells in the PB, BM and spleen of untreated and treated mice. (E) Analysis of hCD45+/CD3+ cells in the PB, BM and spleen of Dual CAR-CIK treated mice. (F) Representative dot plot of PB analysis. P-values from the Wilcoxon test are referred to the comparison of DC mut-CIK-treated mice compared with untreated mice within PB, BM and spleen. ∗, p-value < 0.05.

References

    1. Papaemmanuil E, Gerstung M, Bullinger L, et al. Genomic classification and prognosis in acute myeloid leukemia. N Engl J Med. 2016;374(23):2209–2221. - PMC - PubMed
    1. Heuser M, Mina A, Stein EM, Altman JK. How precision medicine is changing acute myeloid leukemia therapy. Am Soc Clin Oncol Educ Book. 2019;39:411–420. - PubMed
    1. Estey EH. Acute myeloid leukemia: 2021 update on risk-stratification and management. Am J Hematol. 2020;95(11):1368–1398. - PubMed
    1. Rambaldi A, Biagi E, Bonini C, Biondi A, Introna M. Cell-based strategies to manage leukemia relapse: efficacy and feasibility of immunotherapy approaches. Leukemia. 2015;29(1):1–10. - PubMed
    1. Martínez-Cuadrón D, Serrano J, Gil C, et al. Evolving treatment patterns and outcomes in older patients (≥60 years) with AML: changing everything to change nothing? Leukemia. 2021;35(6):1571–1585. - PubMed