. 2023 Jan 10;56(1):58-77.e11.
doi: 10.1016/j.immuni.2022.11.013. Epub 2022 Dec 14.

Prolonged hypernutrition impairs TREM2-dependent efferocytosis to license chronic liver inflammation and NASH development

Affiliations

Prolonged hypernutrition impairs TREM2-dependent efferocytosis to license chronic liver inflammation and NASH development

Xiaochen Wang et al. Immunity. .

Abstract

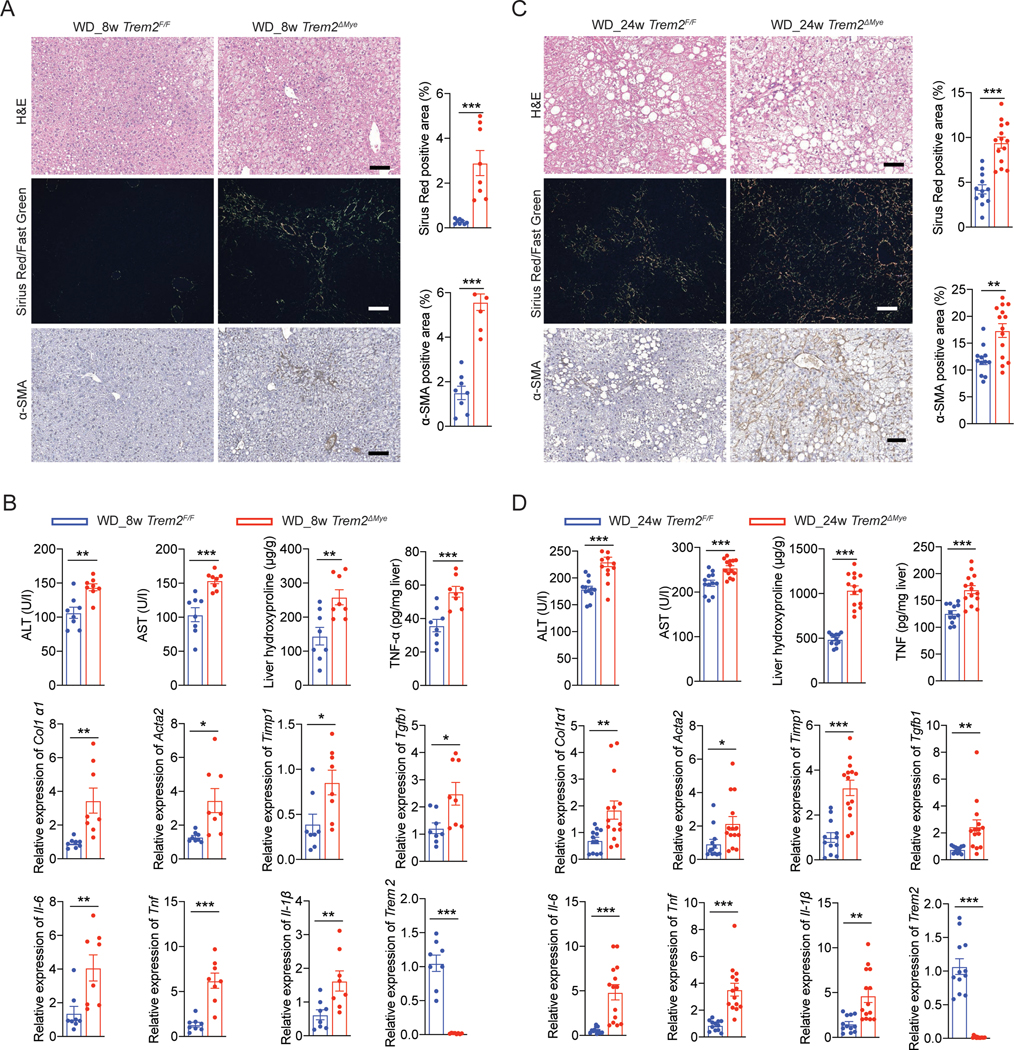
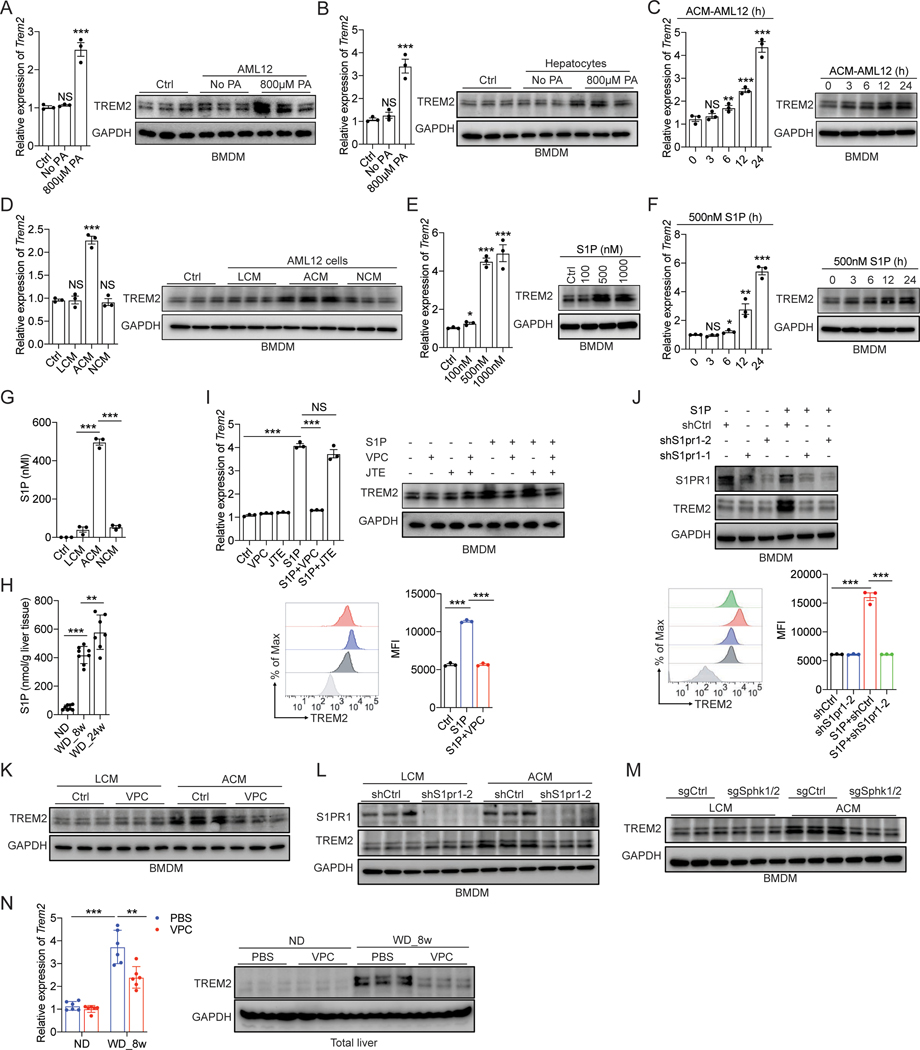
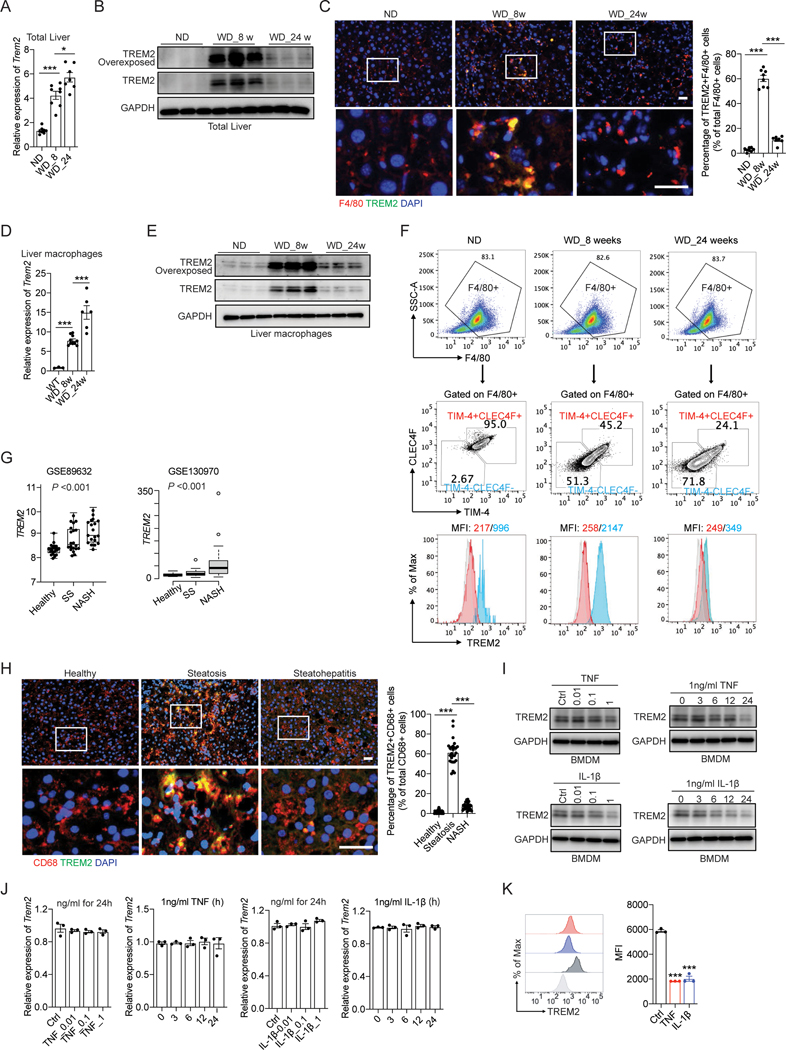
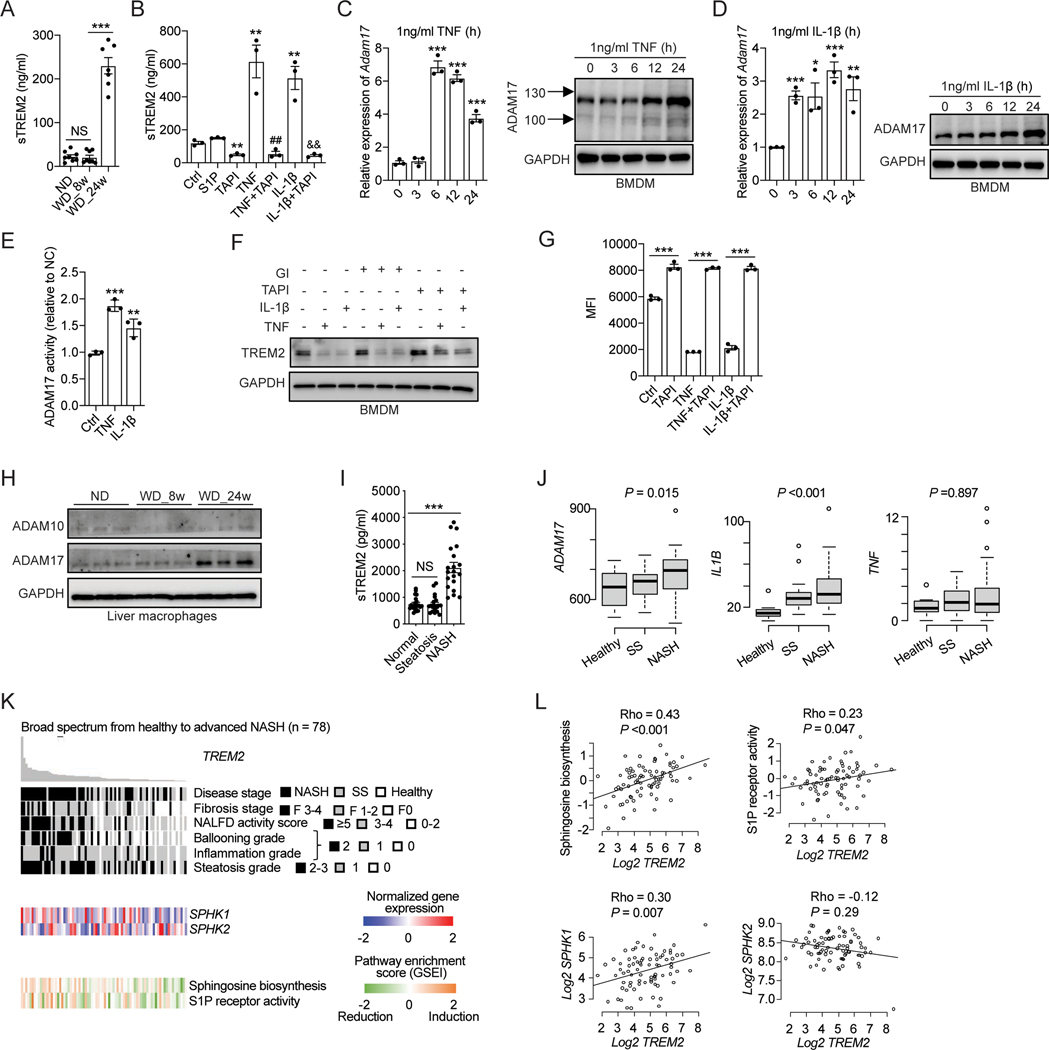
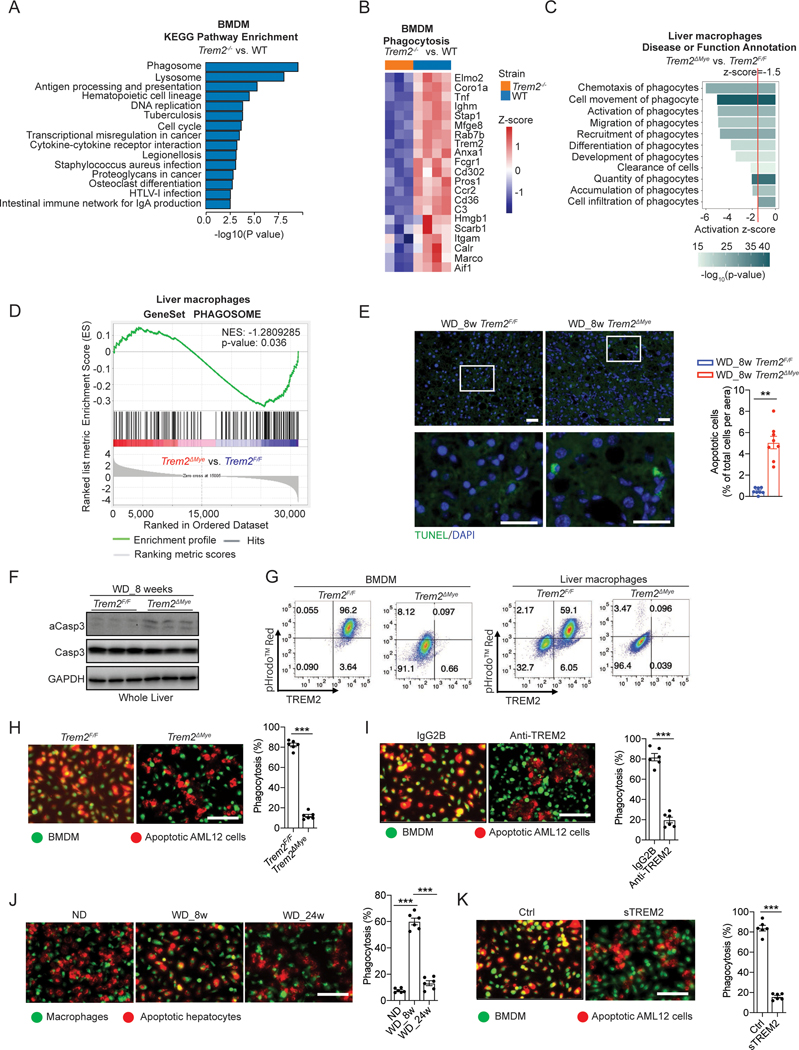
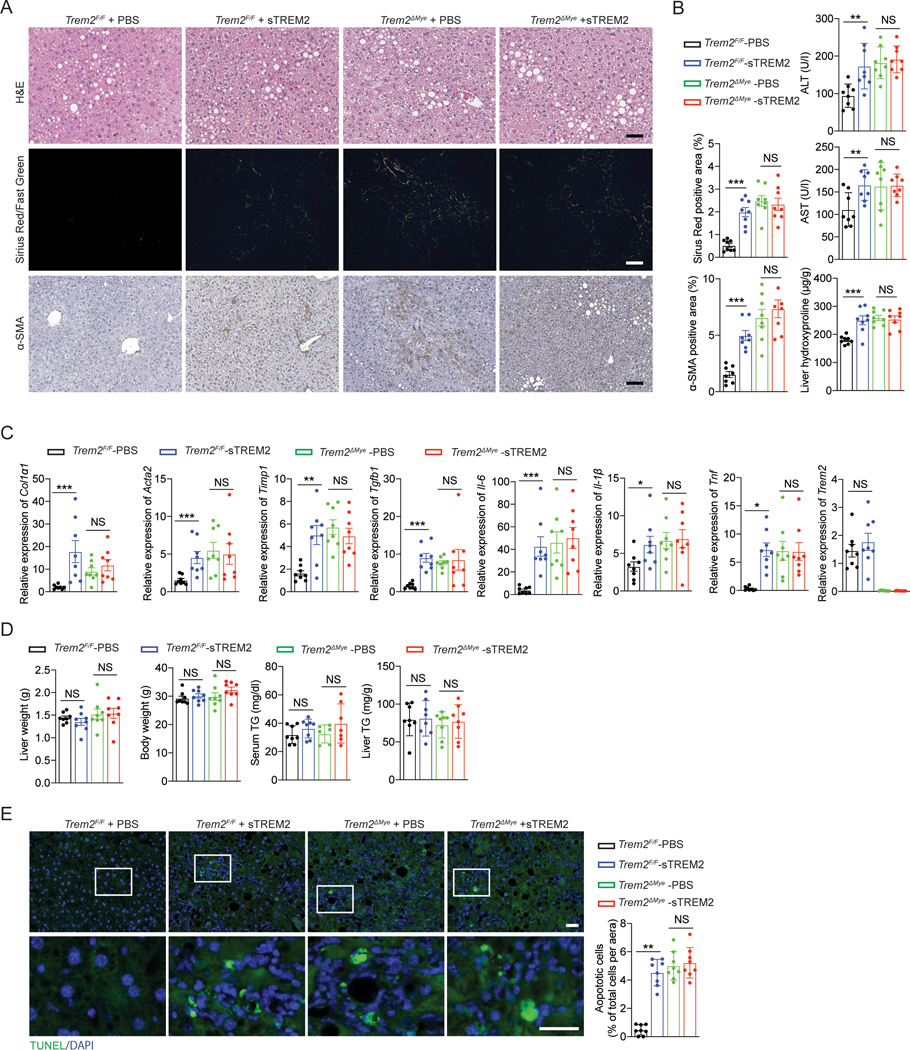
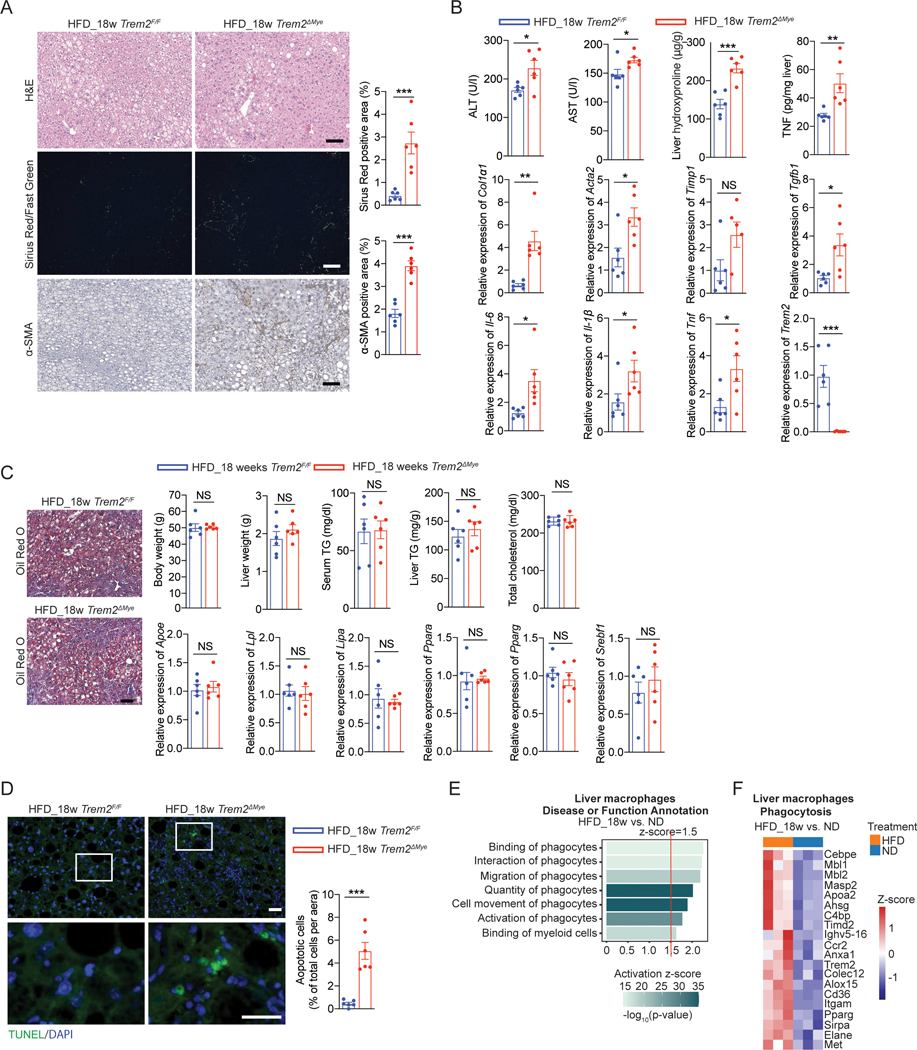
Obesity-induced chronic liver inflammation is a hallmark of nonalcoholic steatohepatitis (NASH)-an aggressive form of nonalcoholic fatty liver disease. However, it remains unclear how such a low-grade, yet persistent, inflammation is sustained in the liver. Here, we show that the macrophage phagocytic receptor TREM2, induced by hepatocyte-derived sphingosine-1-phosphate, was required for efferocytosis of lipid-laden apoptotic hepatocytes and thereby maintained liver immune homeostasis. However, prolonged hypernutrition led to the production of proinflammatory cytokines TNF and IL-1β in the liver to induce TREM2 shedding through ADAM17-dependent proteolytic cleavage. Loss of TREM2 resulted in aberrant accumulation of dying hepatocytes, thereby further augmenting proinflammatory cytokine production. This ultimately precipitated a vicious cycle that licensed chronic inflammation to drive simple steatosis transition to NASH. Therefore, impaired macrophage efferocytosis is a previously unrecognized key pathogenic event that enables chronic liver inflammation in obesity. Blocking TREM2 cleavage to restore efferocytosis may represent an effective strategy to treat NASH.

Keywords: TREM2; chronic inflammation; efferocytosis; nonalcoholic steatohepatitis; proinflammatory cytokines.


Conflict of interest statement

Declaration of interests The authors declare no competing interests.

Figures

Figure 1.
Figure 1.. Genetic ablation of Trem2 in macrophages exacerbates NASH pathology
(A and C) Representative H&E, Sirius Red/Fast Green, and α-SMA staining of liver sections from Trem2F/F and Trem2ΔMye mice fed with western diet (WD) for 8 (A) and 24 (C) weeks. Sirius Red/Fast Green staining was detected under polarized light. WD_8w, n = 8 mice per group. WD_24w Trem2F/F, n = 12 mice; WD_24w Trem2ΔMye, n = 14 mice. (B and D) Serum ALT, AST, hepatic hydroxyproline, and TNF amounts in liver tissue from mice as in (A and C) were measured. Relative mRNA expression of fibrosis-related genes, inflammatory genes, and Trem2 in liver tissue were analyzed by RT-qPCR. Scale bar, 100 μm. Data are shown as mean ± s.e.m.. *p<0.05; **p<0.01; ***p<0.001. See also Figure S1 and Table S1.
Figure 2.
Figure 2.. Obesity upregulates TREM2 in infiltrated liver macrophages via hepatocyte derived S1P
(A and B) RT-qPCR analysis of Trem2 mRNA and immunoblot analysis of TREM2 in BMDMs after coculturing with palmitic acid (PA)-treated AML12 cells (A) or murine primary hepatocytes (B) in a transwell system. (C) RT-qPCR analysis of Trem2 mRNA and immunoblot analysis of TREM2 in BMDMs after stimulation with cell culture medium collected from 800 μM PA-treated AML12 cells. (D) RT-qPCR analysis of Trem2 mRNA and immunoblot analysis of TREM2 in BMDMs after stimulation with fresh culture medium (Ctrl) or culture medium collected from AML12 cells treated with PA of various concentrations for 24 hours. LCM, live cell culture medium; ACM, apoptotic cell culture medium; NCM, necrotic cell culture medium. (E) RT-qPCR analysis of Trem2 mRNA and immunoblot analysis of TREM2 in BMDMs treated with S1P for 24 hours. (F) RT-qPCR analysis of Trem2 mRNA and immunoblot analysis of TREM2 in BMDMs treated with S1P. (G and H) S1P concentrations were quantified by ELISA in cell culture media collected from PA-treated AML12 cells (G) or liver tissue from C57BL/6 mice (H). (I and J) RT-qPCR analysis of Trem2 mRNA, immunoblot analysis of TREM2, and flow cytometry analysis of cell surface TREM2 in BMDMs stimulated with S1P. BMDMs were either pretreated with VPC (VPC23019, an S1PR1/3 inhibitor), JTE (JTE-013, an S1PR2 inhibitor) (I), or transduced with lentiviral constructs expressing two different shRNAs against S1pr1 (J). (K-M) Immunoblot analysis of TREM2 in BMDMs stimulated with cell culture medium of AML12 cells. BMDMs were either pretreated with VPC (K) or transduced with lentiviral constructs expressing shS1pr1 (L). LCM and NCM were collected from AML12 cells transduced with lentiviral constructs expressing indicated sgRNAs (M). (N) RT-qPCR analysis of Trem2 mRNA and immunoblot analysis of TREM2 in liver tissue from C57BL/6 mice that were treated with VPC or PBS. n=6 mice per group. Data are shown as mean ± s.e.m.. *p<0.05; **p<0.01; ***p<0.001; NS, not significant. All in vitro experiments were repeated independently at least three times. See also Figure S2.
Figure 3.
Figure 3.. Uncoupled regulation of Trem2 mRNA and its protein during NASH development
(A and B) RT-qPCR analysis of Trem2 mRNA (A) and immunoblot analysis of TREM2 (B) in liver tissue from C57BL/6 mice. ND, n = 8 mice; WD_8w, n = 8 mice; WD_24w, n= 7 mice. (C) Representative immunofluorescent staining of F4/80 (Red) and TREM2 (Green) in liver sections. The percentage of double positive cells (F4/80+TREM2+) in total number of macrophages (F4/80+) was quantified. (D and E) RT-qPCR analysis of Trem2 mRNA (D) and immunoblot analysis of TREM2 (E) in primary liver macrophages isolated from C57BL/6 mice. ND, n = 3 mice; WD_8w, n = 10 mice; WD_24w, n = 6 mice. (F) Flow cytometry analysis of CLEC4F and TIM-4 in F4/80+ liver macrophages isolated from C57BL/6 mice using anti-CD11b magnetic beads. Cell surface TREM2 in TIM-4CLEC4F recruited macrophages and TIM-4+CLEC4F+ resident macrophages was further quantified by MFI. (G) Database (GSE89632, n = 63 and GSE130970, n = 78) analysis of TREM2 mRNA in two independent clinical cohorts of individuals with healthy, simple steatosis (SS), and NASH livers. (H) Representative immunofluorescent staining of CD68 and TREM2 in human liver sections. (I and J) immunoblot analysis of TREM2 (I) and RT-qPCR analysis of Trem2 mRNA (J) in BMDMs treated with TNF or IL-1β for 24 hours, or with 1 ng/ml of TNF or IL-1β for different time durations (hours). (K) Flow cytometry analysis of cell surface TREM2 in BMDMs treated with 1 ng/ml TNF or IL-1β for 24 hours. Scale bar, 100 μm. Data are shown as mean ± s.e.m.. *p<0.05; ***p<0.001. All in vitro experiments were repeated independently at least three times. See also Figure S3 and Table S2.
Figure 4.
Figure 4.. TNF and IL-1β induce TREM2 proteolytic cleavage by activating ADAM17
(A) ELISA analysis of sTREM2 in mouse sera of C57BL/6 mice. ND, n = 8 mice; WD_8w, n = 8 mice; or WD_24w, n = 7 mice. (B) ELISA analysis of sTREM2 in cell culture medium from BMDMs treated with indicated stimuli for 24 hours. S1P (500 nM), TAPI (ADAM17 inhibitor, 10 μM) TNF or IL-1β (1 ng/ml). **p < 0.01 vs. Ctrl group; ##p < 0.01 vs. TNF treated group; &&p < 0.01 vs. IL-1β treated group. (C and D) RT-qPCR analysis of Adam17 mRNA and immunoblot analysis of ADAM17 in BMDMs stimulated with TNF (C) or IL-1β (D). (E) Relative ADAM17 activity was quantified in BMDMs after 24 hours of TNF (1 ng/ml) or IL-1β (1 ng/ml) stimulation. (F) Immunoblot analysis of TREM2 in BMDMs treated with 10 μM TAPI (an ADAM17 inhibitor) or 20 μM GI (an ADAM10 inhibitor) in combination with 1 ng/ml of TNF or IL-1β for 24 hours. (G) Flow cytometry analysis of cell surface TREM2 in BMDMs pretreated with 10 μM TAPI followed by stimulation with 1 ng/ml of TNF or IL-1β for 24 hours. MFI was used for flow cytometry analysis. (H) Immunoblot analysis of ADAM10 and ADAM17 in primary liver macrophages isolated from C57BL/6 mice. (I) ELISA analysis of sTREM2 in human plasma from individuals with healthy, steatosis, and NASH livers (n = 20 subjects per group). (J) Relative mRNA expression of ADAM17, IL-1B, and TNF in human liver tissue in a clinical cohort (GSE130970, n = 78). Healthy, n = 6; simple steatosis (SS), n = 14; NASH, n = 58. (K and L) Association of TREM2 expression in human liver tissue with their pathohistological annotations, SPHK1 and SPHK2 expression, Sphingosine biosynthesis, and S1P receptor activity in a clinical cohort of NAFLD patients (GSE130970, n = 78). Data are shown as mean ± s.e.m.. *p<0.05; **p<0.01; ***p<0.001; NS, not significant. All in vitro experiments were repeated independently at least three times. See also Figure S4 and Table S3.
Figure 5.
Figure 5.. TREM2 is essential for macrophage efferocytosis of lipid-laden apoptotic hepatocytes
(A) KEGG pathway enrichment analysis of differentially expressed genes in Trem2−/− (n = 3) and WT (n = 4) BMDMs. (B) Heatmap of phagocytosis related genes (GO:0006909) that were downregulated in Trem2−/− (n = 3) BMDMs compared to WT (n = 4) BMDMs. (C) IPA of phagocytosis related functions in liver macrophages isolated from WD fed Trem2F/F and Trem2ΔMye mice. n = 4 mice per group. (D) GSEA reveals phagosome related genes are enriched in primary liver macrophages isolated from Trem2F/F mice compared to Trem2ΔMye mice after WD feeding. n = 4 mice per group. (E) Representative TUNEL staining of liver sections from Trem2F/F and Trem2ΔMye mice fed with WD for 8 weeks (n = 8 mice per group). (F) Immunoblot analysis of aCasp3 (cleaved caspase-3), Casp3 (caspase-3), and GAPDH in liver tissue from Trem2F/F and Trem2ΔMye mice fed with WD for 8 weeks (n = 3 mice per group). (G) BMDMs (left panel) or primary liver macrophages (right panel) from Trem2F/F and Trem2ΔMye mice were cocultured for 4 hours with AML12 cells that were labeled with pHrodo Red and treated with PA to induce apoptosis. Flow cytometry analysis of TREM2 and pHrodo Red was then performed for assessing the efficacy of macrophage efferocytosis of apoptotic hepatocytes. (H) PA-treated apoptotic AML12 cells were cocultured with Trem2F/F and Trem2ΔMye BMDMs for 2 hours. n = 6 per group. (I) PA-treated apoptotic AML12 cells were cocultured with WT BMDMs that were pretreated with either TREM2 neutralizing antibody (Anti-TREM2, 200 ng/ml) or an isotype control antibody (IgG2B). n = 6 per group. (J) PA-treated primary hepatocytes were cocultured with primary liver macrophages from C57BL/6 mice. n = 6 per group. (K) WT BMDMs were cocultured with AML12 cells that were treated with PA to induce apoptosis followed by incubation with recombinant sTREM2 (200 ng/ml). n = 6 per group. Scale bar, 100μm. Efferocytosis was quantified as the percentage of BMDMs engulfing apoptotic AML12 cells. Data are shown as mean ± s.e.m.. **p<0.01; ***p<0.001. All in vitro experiments were repeated independently at least three times. See also Figure S5, Video S1, and Video S2.
Figure 6.
Figure 6.. Absence of sTREM2 did not contribute to the exacerbated NASH pathology in WD-fed Trem2ΔMye mice
Trem2F/F and Trem2ΔMye mice were fed with WD for 8 weeks and treated with PBS or sTREM2 (weekly i.v. injection, 1 μg/mouse). n = 8 mice per group. (A) Representative histological results of liver sections stained with H&E, Sirius Red/Fast Green, and α-SMA. Sirius Red/Fast Green staining was detected under polarized light. (B) Serum ALT, AST, and hepatic hydroxyproline amounts were measured. (C) Relative mRNA expression of fibrosis-related genes, inflammatory genes, and Trem2 was measured by RT-qPCR in liver tissue. (D) Liver weight, body weight, serum TG, and liver TG were analyzed. (E) Apoptotic cells in liver tissue were stained with TUNEL and quantified. Scale bar, 100 μm. Data are shown as mean ± s.e.m.. *p<0.05; **p<0.01; ***p<0.001; NS, not significant. See also Figure S6.
Figure 7.
Figure 7.. HFD feeding is sufficient to induce NASH development in Trem2ΔMye mice
(A) Representative H&E, Sirius Red/Fast Green, and α-SMA staining of liver sections from Trem2F/F and Trem2ΔMye mice fed with HFD for 18 weeks, n = 6 mice per group. Sirius Red/Fast Green staining was detected under polarized light. (B) Serum ALT, AST, hepatic hydroxyproline, and TNF amounts in liver tissue from mice as in (A) were measured. Relative mRNA expression of fibrosis-related genes, inflammatory genes, and Trem2 was analyzed by RT-qPCR using liver tissue, n = 6 mice per group. (C) Representative Oil Red O staining of liver sections from mice as in (A). Scale bar, 100 μm. Body weight, liver weight, serum TG, liver TG, and total cholesterol from these mice were also analyzed. Relative mRNA expression of lipid-associated genes in liver tissue was measured by RT-qPCR. n = 6 mice per group. (D) Apoptotic cells in liver tissue from mice as in (A) were stained with TUNEL and quantified. n = 6 mice per group. (E) IPA on phagocytosis related functions in primary liver macrophages isolated from WT C57BL/6 mice that were fed with HFD (n=3) or ND (n=3) for 18 weeks. (F) Heatmap of upregulated phagocytosis related genes (GO:0006909) in primary liver macrophages isolated from 18 weeks HFD (n=3) compared to ND (n=3) fed WT mice. Scale bar, 100 μm. Data are shown as mean ± s.e.m.. *p<0.05; **p<0.01; ***p<0.001; NS, not significant. See also Figure S7.

Comment in

References

    1. Arrese M, Cabrera D, Kalergis AM, and Feldstein AE (2016). Innate Immunity and Inflammation in NAFLD/NASH. Dig Dis Sci 61, 1294–1303. 10.1007/s10620-016-4049-x. - DOI - PMC - PubMed
    1. Byrne CD, and Targher G. (2015). NAFLD: a multisystem disease. J Hepatol 62, S47–64. 10.1016/j.jhep.2014.12.012. - DOI - PubMed
    1. Friedman SL, Neuschwander-Tetri BA, Rinella M, and Sanyal AJ (2018). Mechanisms of NAFLD development and therapeutic strategies. Nat Med 24, 908–922. 10.1038/s41591-018-0104-9. - DOI - PMC - PubMed
    1. Schuster S, Cabrera D, Arrese M, and Feldstein AE (2018). Triggering and resolution of inflammation in NASH. Nat Rev Gastroenterol Hepatol 15, 349–364. 10.1038/s41575-018-0009-6. - DOI - PubMed
    1. Arab JP., Arrese M., and Trauner M. (2018). Recent Insights into the Pathogenesis of Nonalcoholic Fatty Liver Disease. Annu Rev Pathol 13, 321–350. 10.1146/annurev-pathol-020117-043617. - DOI - PubMed

Publication types